
Table of Content
- Key Takeaways
- What is a Bullish Reversal Pattern?
- How a Single Candlestick Represents Price Data?
- Importance of Candlestick Patterns
- Key Bullish Reversal Candlestick Patterns
- Tools to Use in Bullish Reversal Pattern
- How to Confirm the Pattern with Confidence?
- Common Mistakes Traders Make with Bullish Reversal Pattern
- Conclusion
- Frequently Asked Questions (FAQ’s)
Link copied!
Bullish Reversal Patterns
Bullish reversal patterns are chart formations that signal a potential change in trend direction from a downtrend to an uptrend. These patterns indicate that selling pressure may be weakening, and buying interest could soon push the price higher.
Key Takeaways
- Bullish reversal patterns signal a potential shift in momentum from sellers to buyers. Common patterns include the Hammer, Inverted Hammer, Bullish Engulfing, Piercing Line, and Morning Star.
- Candlestick patterns should not be used in isolation. Confirmation through volume, support and resistance levels, and the next candle’s close improves trade reliability.
- Combining patterns with indicators like the Relative Strength Index, Moving Average Convergence Divergence, and Moving Average helps reduce false signals and strengthens analysis.
- Risk management remains essential, as even strong bullish reversal patterns can fail under volatile market conditions.
What is a Bullish Reversal Pattern?
A bullish reversal pattern is a type of candlestick formation that signals a potential change in market direction from a downtrend to an uptrend. These patterns indicate that selling pressure may be weakening while buyers are gradually gaining control of the stock market.
In Technical Analysis, bullish reversal patterns help traders identify possible buying opportunities before a new upward trend begins. Common bullish reversal patterns include the Hammer, Inverted Hammer, Bullish Engulfing, Piercing Line, and Morning Star patterns.
While these patterns can provide early signs of a trend reversal, traders often combine them with volume analysis, support and resistance levels, and technical indicators for better confirmation and accuracy.
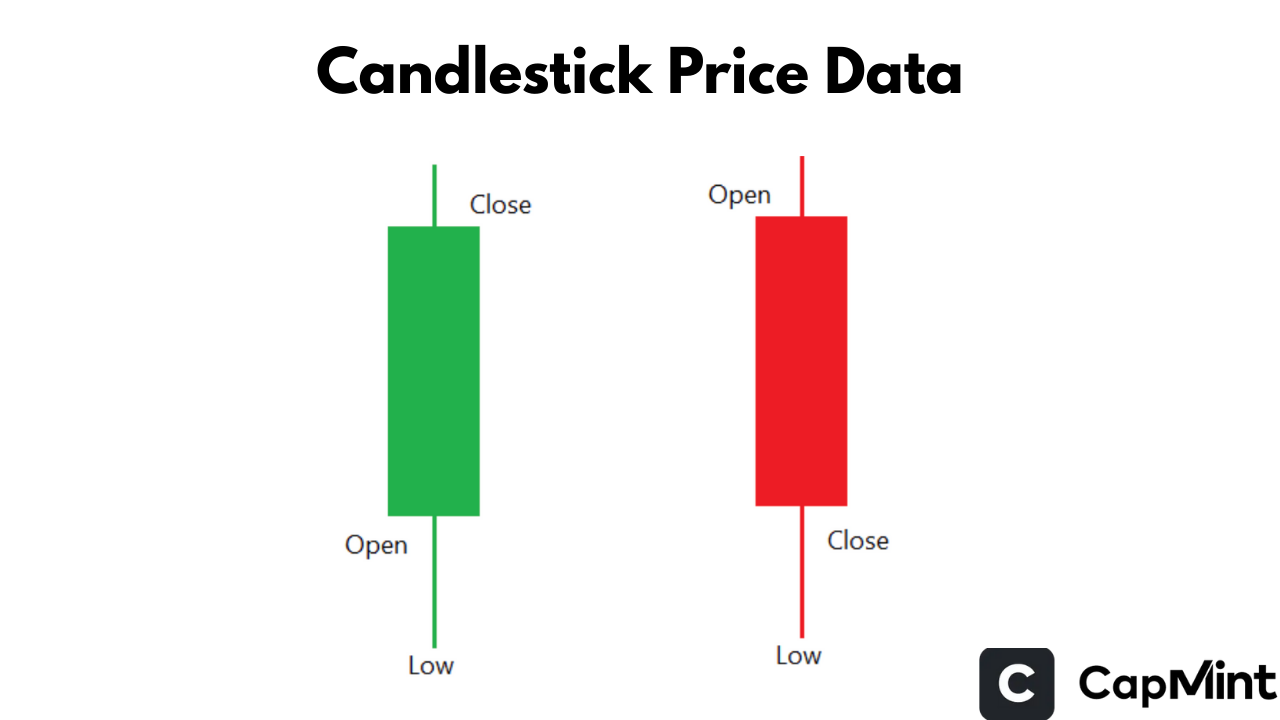
How a Single Candlestick Represents Price Data?
Each candlestick on the chart provides essential price data for a specific time frame. A single candlestick showcases four critical price points:
Open
The price at which the security was traded at the beginning of the period.
Close
The price at which the security was traded at the end of the period.
High
The highest price reached during the period.
Low
The lowest price recorded during the period.
This information allows traders to visualise the battle between bulls and bears, ultimately depicting market sentiment.
Importance of Candlestick Patterns
Candlestick patterns are not just visuals; they’re signals. Especially during key market turning points, bullish reversal patterns can indicate a shift from bearish sentiment to bullish momentum.
Here’s why candlestick patterns are crucial for traders:
Visual Storytelling
They offer an immediate, visual representation of market psychology, showing the battle between bulls and bears at a glance.
Early Reversal Signals
Bullish reversal patterns can provide early entry points before a major uptrend begins, allowing for better risk-reward trades.
Applicable Across Timeframes
Candlestick patterns work across all timeframes, from intraday to weekly charts, making them versatile tools.
Easy to Combine with Indicators
Candlestick signals work seamlessly with other technical tools such as RSI, MACD, or support/resistance zones to improve accuracy. Patterns are not just visuals, they’re signals. Especially during key market turning points, bullish reversal patterns can indicate a shift from bearish sentiment to bullish momentum.
Key Bullish Reversal Candlestick Patterns
Let’s take a look at a few of the widely used reversal candlestick patterns.
The Hammer
The Hammer candlestick pattern appears after a downtrend, characterised by a small body and a long lower wick. This signals a potential reversal, as the buyers have stepped in to push prices back up.
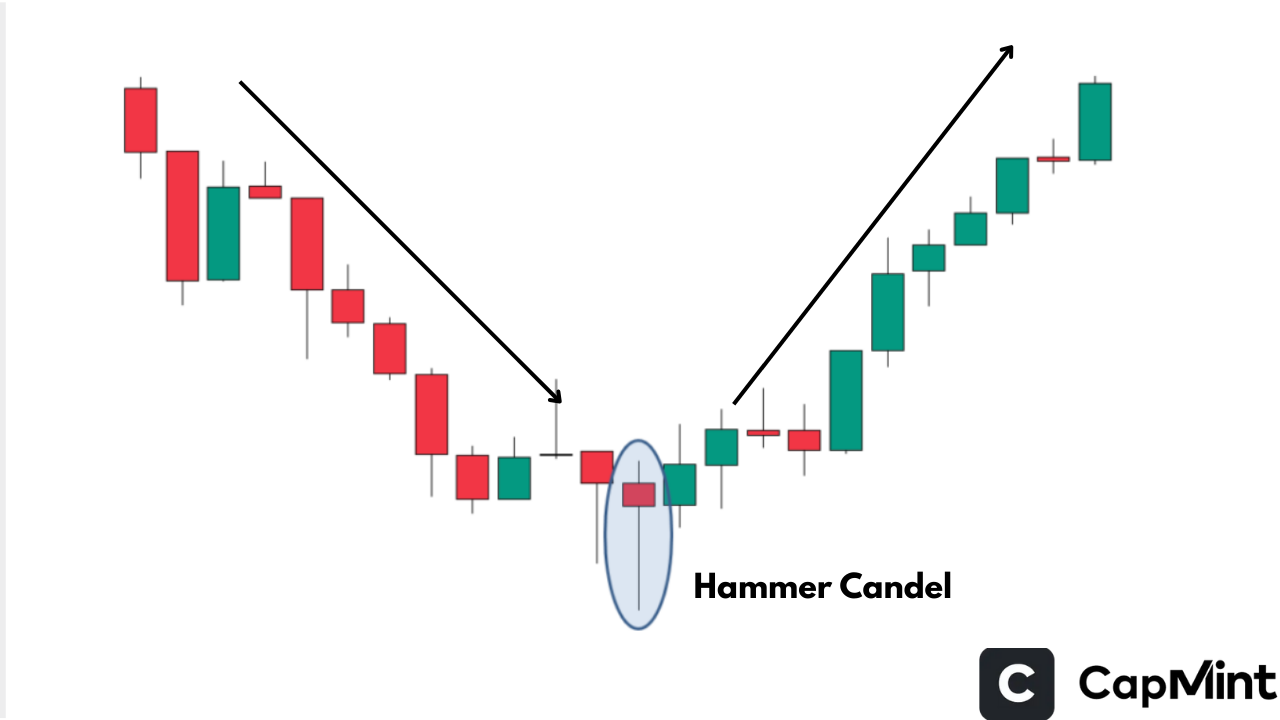
- A hammer candle forms after a downtrend and signals a potential bullish reversal. It has a small real body near the top and a long lower shadow, indicating that prices dropped significantly during the session but recovered strongly before the close.
- The long lower wick shows that sellers initially dominated, but buyers came in aggressively, pushing the price back up, a sign of rejection of lower prices and weakening bearish momentum.
- This shift in price action reflects a psychological change in the market, where bears lose control and bulls start showing strength, hinting at a possible trend reversal.
- A bullish confirmation candle (closing above the hammer’s high) on the following day strengthens the pattern and increases the likelihood of an upward move.
The Inverted Hammer
Similar to the Hammer, the Inverted Hammer forms at the bottom of a downtrend but has its long wick on top. This pattern indicates buying pressure and suggests a shift in trend direction could be imminent.
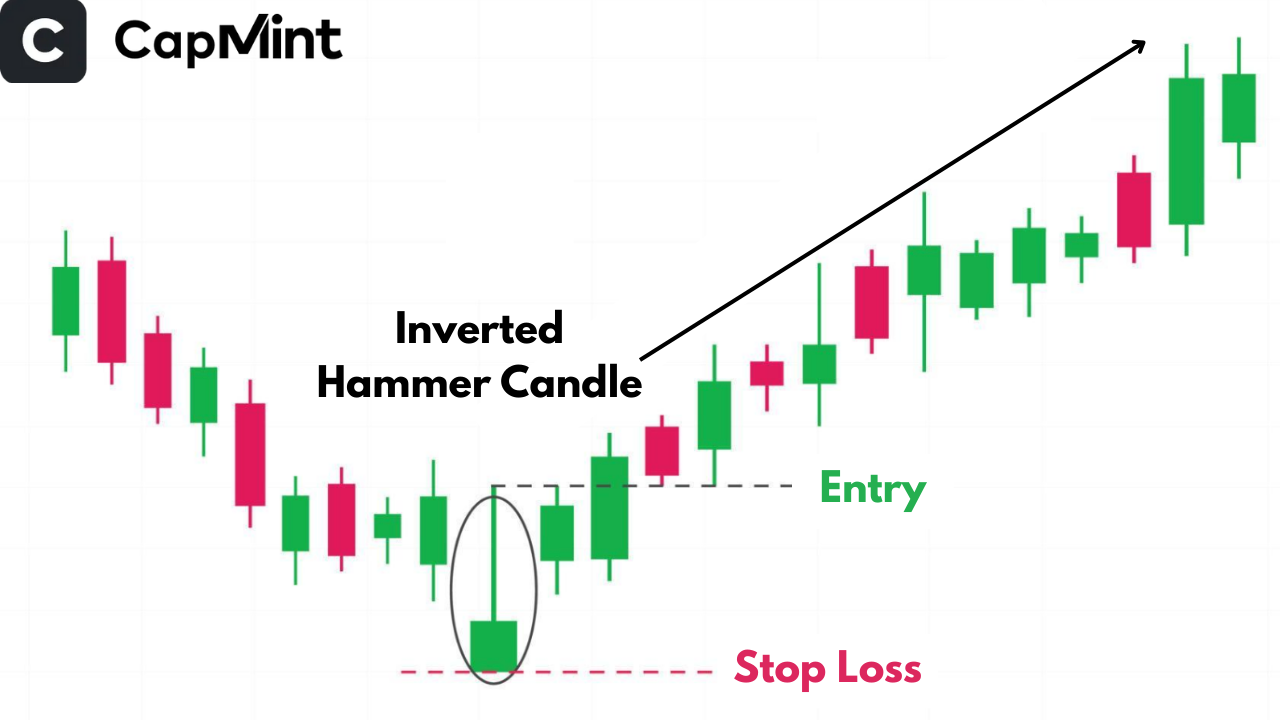
An inverted hammer appears after a downtrend and suggests a potential bullish reversal. It has a small real body near the bottom and a long upper shadow, with little to no lower shadow, resembling an upside-down hammer.
During the session, buyers attempted to push the price higher, creating the long upper wick, but couldn’t hold those levels by the close. Still, their presence shows early signs of buying interest returning to the market.
Psychologically, this pattern reflects a challenge to bearish dominance, though sellers managed to pull the price back down; the strong upward move during the session hints that bulls are testing control.
Like the regular hammer, this pattern requires confirmation from the next candle, ideally a strong bullish close above the inverted hammer’s high, to validate the potential reversal.
The Bullish Engulfing
The Bullish Engulfing pattern consists of two candlesticks. The second candlestick completely engulfs the first, indicating strong buying interest and a bullish reversal.
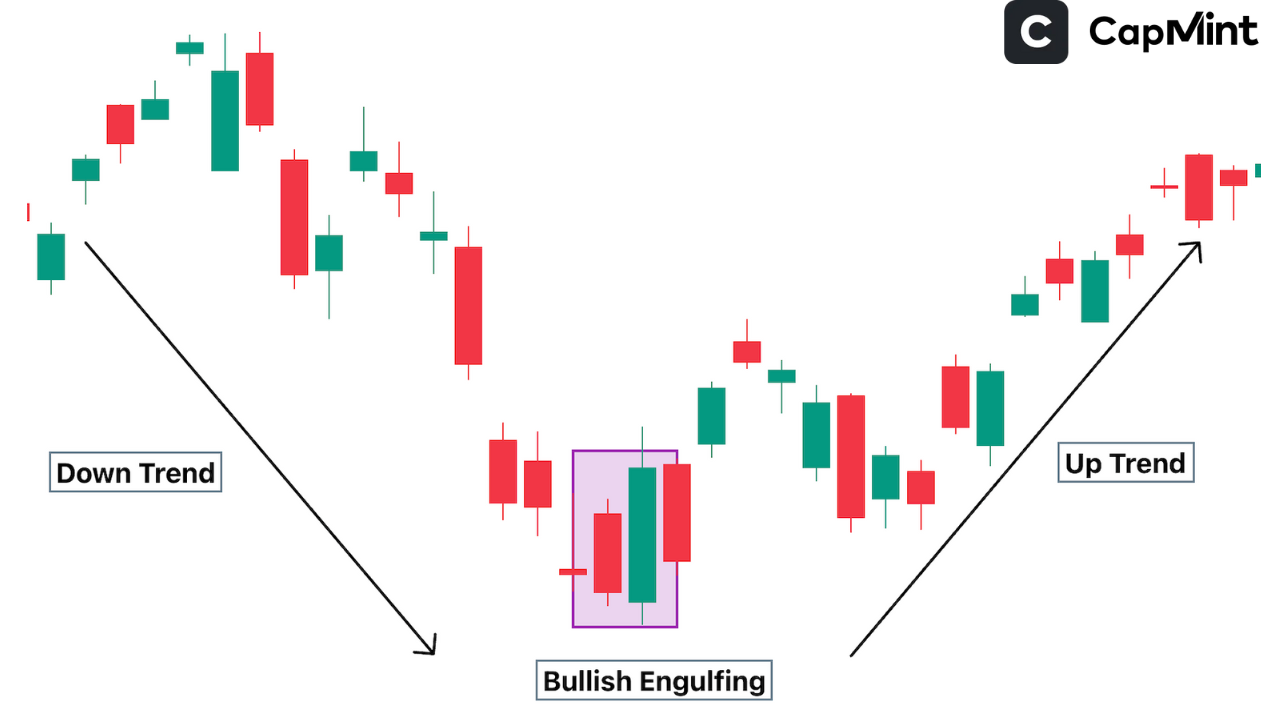
- The Bullish Engulfing is a two-candle bullish reversal pattern that appears after a downtrend. The first candle is a small bearish one, followed by a larger bullish candle that completely engulfs the body of the previous candle.
- The pattern signals a strong shift in momentum. Sellers were in control initially, but buyers stepped in forcefully the next day, overwhelming the prior selling pressure with a wide-range bullish candle.
- Psychologically, this shows that bears are losing grip, and bulls are asserting dominance, as the market rejects lower prices and closes significantly higher.
- The pattern is more reliable when the bullish candle closes near its high, and a confirmation candle on the following day (closing above the engulfing candle’s high) further increases the chances of a sustained uptrend.
The Piercing Line
This pattern forms when a downtrend is followed by a bullish candle that opens below the previous candle’s close but closes above its midpoint. It hints at a potential trend change from bearish to bullish.
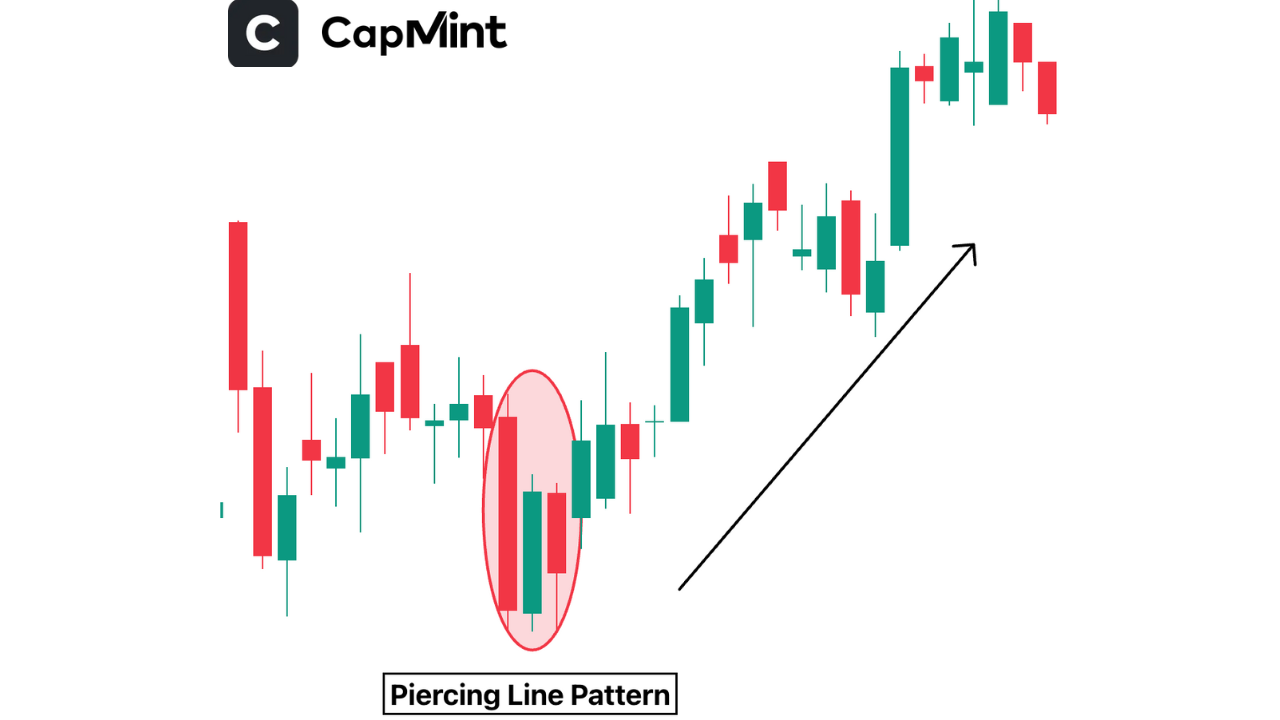
- The Piercing Line pattern is a two-candle bullish reversal pattern that appears after a downtrend. The first candle is a long bearish one, followed by a bullish candle that opens lower but closes above the midpoint of the previous candle’s body.
- The gap down on the second day reflects continued bearish sentiment, but the strong recovery by bulls closing more than halfway into the prior candle signals a shift in control from sellers to buyers.
- Psychologically, it shows that although bears were initially in control, buyers stepped in aggressively, rejecting lower prices and suggesting growing bullish momentum.
- A confirmation candle closing above the second candle’s high strengthens the pattern and indicates that a trend reversal may be underway.
The Morning Star
The Morning Star is a three-candle pattern signalling a bullish reversal. The first candle is bearish, followed by a small-bodied candle (the star), and concluded with a bullish candle that closes above the midpoint of the first candle.
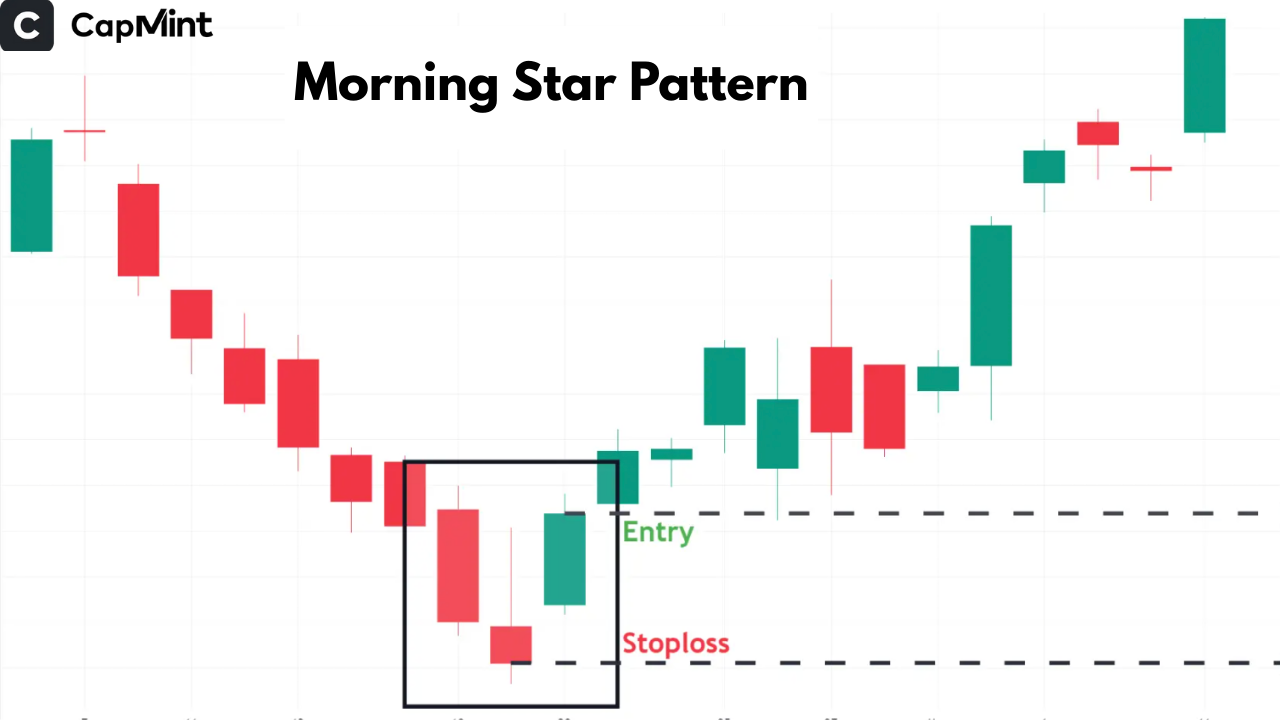
- The Morning Star is a three-candle bullish reversal pattern that forms after a downtrend. It starts with a long bearish candle, followed by a small-bodied candle (which can be bullish or bearish), and ends with a strong bullish candle that closes well into the body of the first candle.
- The second candle reflects indecision or slowing bearish momentum, often forming a gap down. The third candle confirms that buyers have taken control, making a strong upward move.
- Psychologically, the pattern shows a shift in sentiment from bearish dominance (first candle), to uncertainty (second candle), to bullish strength (third candle), signalling that a potential trend reversal is taking shape.
- The pattern becomes more reliable when the third candle closes above the midpoint or high of the first candle, and preferably with increased volume.
Tools to Use in Bullish Reversal Pattern
Bullish reversal candlestick patterns become far more effective when combined with additional trading tools and confirmation techniques. Professional traders rarely rely on candlestick formations alone. Instead, they use supporting indicators and market context to improve trade accuracy and reduce false signals.
1. Volume Analysis
Volume Analysis helps traders understand the strength behind a price move. When a bullish reversal pattern forms with a noticeable increase in trading volume, it often indicates stronger buying participation and higher conviction from market participants.
For example, a Bullish Engulfing or Hammer pattern supported by high volume may signal that institutional buyers are stepping into the market, increasing the probability of a successful reversal.
2. Support and Resistance Levels
Support and Resistance are crucial while analysing bullish reversal patterns. Patterns that form near major support zones generally carry more reliability because buyers tend to defend these levels aggressively.
Similarly, if the price breaks above a resistance level after forming a bullish reversal pattern, it may confirm renewed bullish momentum and a potential trend reversal.
3. Relative Strength Index (RSI)
The Relative Strength Index is a popular momentum indicator used to identify overbought and oversold conditions.
When a bullish reversal candlestick pattern forms while the RSI is below 30 and starts moving upward, it often signals weakening selling pressure and improving bullish momentum.
4. MACD Indicator
Moving Average Convergence Divergence helps traders identify momentum shifts and potential trend reversals.
A bullish MACD crossover occurring alongside a bullish reversal candlestick pattern can strengthen the overall trade setup and provide additional confirmation that market sentiment may be shifting in favour of buyers.
5. Moving Averages
Moving averages are widely used to determine trend direction and dynamic support or resistance zones.
If a bullish reversal pattern forms near a key moving average, such as the 20 EMA or 50 EMA, and the price starts moving above it, traders often interpret it as a sign of strengthening bullish momentum.
6. Price Action and Market Structure
Price Action analysis helps traders understand the broader market structure beyond individual candlestick patterns.
A bullish reversal pattern forming after a prolonged downtrend, near a strong demand zone, or alongside higher lows can provide stronger confirmation compared to patterns appearing during random sideways price movement.
Combining candlestick patterns with technical indicators, volume confirmation, and market structure analysis can significantly improve trading decisions and help traders avoid low-probability setups.
How to Confirm the Pattern with Confidence?
Bullish reversal patterns become more reliable when supported by confirmation tools like volume, support and resistance levels, and technical indicators.
1. Volume Analysis
Volume is a key measure of conviction behind price moves. When a bullish reversal pattern forms alongside a noticeable increase in volume, it suggests that a larger number of market participants support the price change. This increases the reliability of the pattern and reduces the chances of a false breakout.
2. Support and Resistance Zones
Patterns forming near strong support levels tend to produce more dependable reversals. If the price bounces off a support zone with a bullish reversal pattern, it often indicates the end of selling pressure. Similarly, when a bullish pattern is followed by a breakout above a resistance level, it confirms renewed buying strength and signals trend continuation.
3. Technical Indicators
Using additional indicators provides further confirmation. For example:
- Moving Averages: If the price moves above a key moving average like the 20 EMA after forming a bullish pattern, it reinforces the potential reversal.
- RSI: A bullish pattern accompanied by an RSI rising from oversold conditions (below 30) indicates strengthening bullish momentum.
- MACD: A bullish crossover in the MACD (MACD line crossing above the signal line) can validate the candlestick reversal and suggest a trend change is underway.
Common Mistakes Traders Make with Bullish Reversal Pattern
While bullish reversal patterns can be effective trading signals, traders should be aware of common mistakes and limitations before relying on them completely.
Falling for False Signals
Bullish candlestick patterns are useful, but they aren’t foolproof. A single candle can sometimes reflect temporary noise or manipulation. Traders must always wait for confirmation before acting.
Ignoring the Bigger Picture
A candlestick pattern in isolation means little without a broader market context. For example, a bullish reversal pattern during a strong downtrend may not hold unless supported by other factors like the ongoing geopolitical shifts or the fundamentals of the company or industry.
Skipping Confirmation
Indicators like RSI, MACD, or increased volume are essential to back up what the candlestick is signalling. Relying solely on the visual pattern can lead to premature or inaccurate trades.
Neglecting Risk Management
Even the strongest pattern can fail. Having a stop-loss strategy and proper position sizing helps protect against unexpected market moves, preserving capital in the long run.
Conclusion
Bullish reversal candlestick patterns are powerful tools for identifying potential turning points in the market. They help traders spot moments when selling pressure is fading and buyers are starting to gain momentum. However, patterns alone are not enough. To trade them effectively, one must combine pattern recognition with confirmation tools, broader market context, and disciplined risk management. When used wisely, these patterns can significantly improve your entry timing and overall trading edge.
Frequently Asked Questions (FAQ’s)
What is the most reliable bullish reversal candlestick pattern?
There’s no single “most reliable” pattern, as their effectiveness can vary based on context. However, patterns like the Morning Star and Bullish Engulfing tend to be more reliable, especially when supported by high volume, a strong support zone, or additional indicators.
Can bullish reversal patterns be used in intraday trading?
Yes, these patterns work across all timeframes from 1-minute charts to weekly charts. Intraday traders often use them for quick reversals, but lower timeframes may have more noise, so confirmation becomes even more important.
How do I confirm a bullish reversal pattern before entering a trade?
Confirmation typically comes from:
- A bullish close above the pattern’s high.
- Increased volume during the reversal.
- Supporting signals from indicators like RSI (rising from oversold), MACD crossover, or a bounce from a support level.
Are bullish candlestick patterns enough for trading decisions?
No. While they offer great visual cues, it’s best to combine them with technical indicators, chart context, and risk management. Relying solely on candlesticks without confirmation can lead to false signals and poor trades.
What’s the difference between a Hammer and an Inverted Hammer?
Both appear after a downtrend and suggest potential reversals. The Hammer has a long lower wick and shows buying pressure after sellers push the price down. The Inverted Hammer has a long upper wick and suggests buyers tried to push prices higher but couldn’t hold gains, yet still indicates a potential shift in sentiment.
Disclaimer: This content is for educational purposes only and does not constitute financial or investment advice. Investments in securities or other financial instruments are subject to market risk, including partial or total loss of capital. Past performance is not indicative of future results. Always consider your financial situation carefully and consult a licensed financial advisor before making investment or trading decisions.
Table of Content
- Key Takeaways
- What is a Bullish Reversal Pattern?
- How a Single Candlestick Represents Price Data?
- Importance of Candlestick Patterns
- Key Bullish Reversal Candlestick Patterns
- Tools to Use in Bullish Reversal Pattern
- How to Confirm the Pattern with Confidence?
- Common Mistakes Traders Make with Bullish Reversal Pattern
- Conclusion
- Frequently Asked Questions (FAQ’s)
Engineered for the obsessed. Built for traders.

Purpose-built terminals.
Zero compromise.
Built for speed.
Plot No 1290, 2nd Floor, 17th Cross, 5th Main, Sector-7, HSR Layout, Bangalore 560102
Follow us on
Mintcap Brokers Private Limited
CIN – U66110KA2023PTC178706 | Registered Address: Plot No 1290, Second Floor, 17th Cross, 5th Main, Sector-7, HSR Layout, Bangalore 560102 | Tel: 080 – 49552310 | Email ID: compliance@capmint.com | SEBI registered Stock Broker: INZ000322732 | NSE Cash/F&O Member ID: 90430 | BSE Cash/F&O Member ID: 6903 | MCX Member ID: 57400 | NCDEX Member ID: 1312 | SEBI registered Depository Participant: IN-DP-806-2025 | CDSL DP ID: 12102300 | NSE Clearing Member code: M70108 | AMFI-Registered Mutual Fund Distributor: ARN-289109 (Valid upto 28-Feb-2027) | Category II Execution Only Platform : E6903
Details of Client Bank Account
Compliance Officer: Ms. Shridevi Vungarala | Email ID: compliance@capmint.com | Tel no. + 91 9035330126 | Grievance Redressal Officer (GRO) – Ms. Shikha Gupta | Email ID: Grievance@capmint.com | Tel no: 9035331595.
Procedure to file a complaint on SEBI SCORES: Register on SCORES portal. Mandatory details for filing complaints on SCORES: Name, PAN, Address, Mobile Number, E-mail ID. Benefits: Effective Communication, Speedy redressal of the grievances. You may refer the website https://scores.sebi.gov.in/ for more information. You may also download the SEBI Scores app to log a complaint Android: https://play.google.com > store > apps > sebiscores iOS: https://apps.apple.com > app > sebiscores
Disclaimer
Investment in the securities market are subject to market risks, read all the related documents carefully before investing. Brokerage will not exceed the SEBI prescribed limit.
Mutual fund investments are subject to market risks, read all scheme related documents carefully before investing. Mutual Funds are not exchange-traded products.
Attention Investor:
- Stock Brokers can accept securities as margin from clients only by way of pledge in the depository system w.e.f. September 1, 2020.
- Update your mobile number & email Id with your stock broker/depository participant and receive OTP directly from depository on your email id and/or mobile number to create pledge.
- Pay 20% as upfront margin of the transaction value to trade in cash market segment.
- Investors may please refer to the Exchange’s Frequently Asked Questions (FAQs) issued vide circular reference NSE/INSP/45191 dated July 31, 2020 and NSE/INSP/45534 dated August 31, 2020 and other guidelines issued from time to time in this regard.
- Check your Securities /MF/ Bonds in the consolidated account statement issued by NSDL/CDSL every month.