
Link copied!
Hanging Man Pattern
The hanging man is a single candlestick pattern that appears after an uptrend and signals a possible reversal of a prevailing uptrend.
Key Takeaways
- A Hanging Man is a single candlestick pattern that forms after an uptrend. It has a small body and a long lower shadow, and it signals that the trend might reverse and prices could fall.
- The pattern shows that sellers are trying to take control after a strong uptrend. Even though buyers pushed the price up by the close, the long lower wick shows selling pressure during the day.
- Traders use the Hanging Man as a chance to short a stock. Risk-takers may enter right after the pattern forms, while cautious traders wait for a confirmation candle. A stop loss should be placed above the high or recent swing high.
What Is A Hanging Man Pattern?
The hanging man is similar to a hammer but is formed at the top of the trend. A hanging man helps traders to set up directional trades. The colour of the trade does not matter, but the crucial thing we must consider is a shadow-to-accurate body ratio, which is the same as the hammer length of the shadow, which should be at least double the size of the body.
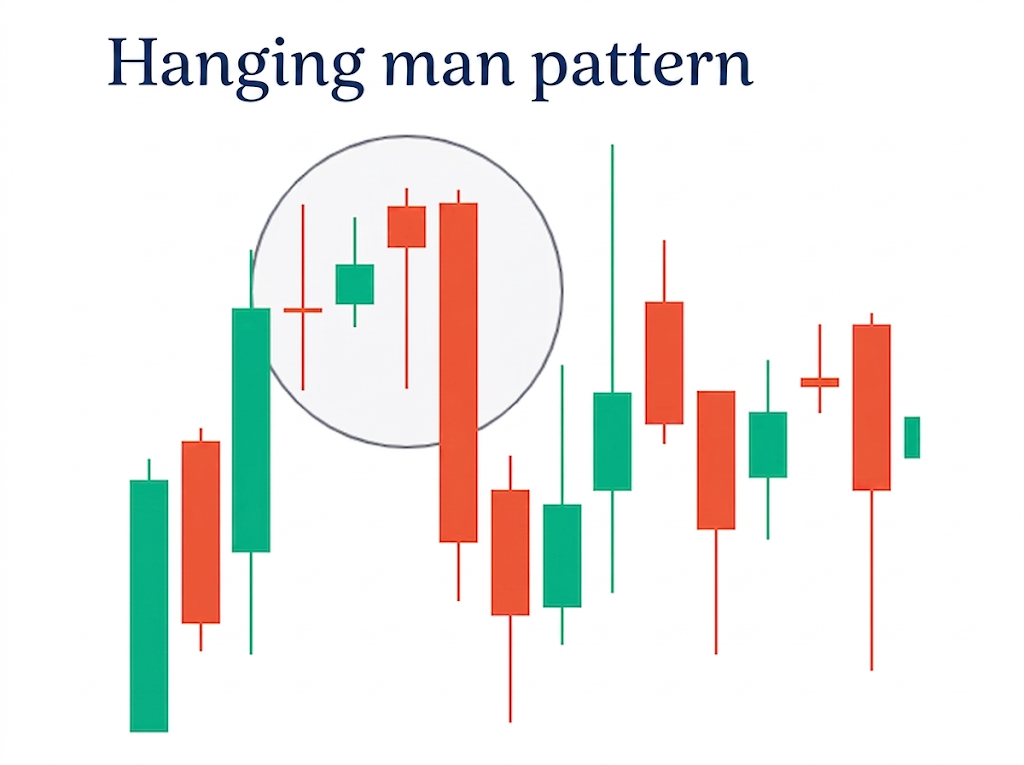
A hanging man signals a market high; after the occurrence of a hanging man, a bearish hanging man pattern signals sell pressure. It is only considered when an uptrend precedes it.
The market is in an uptrend, signalling a bullish trend. The bears entered after the hanging man’s formation, depicted by a longer lower shadow. The entry of bears signifies that they are trying to break the stronghold of bulls. Let’s look at the example of Asian Paints.
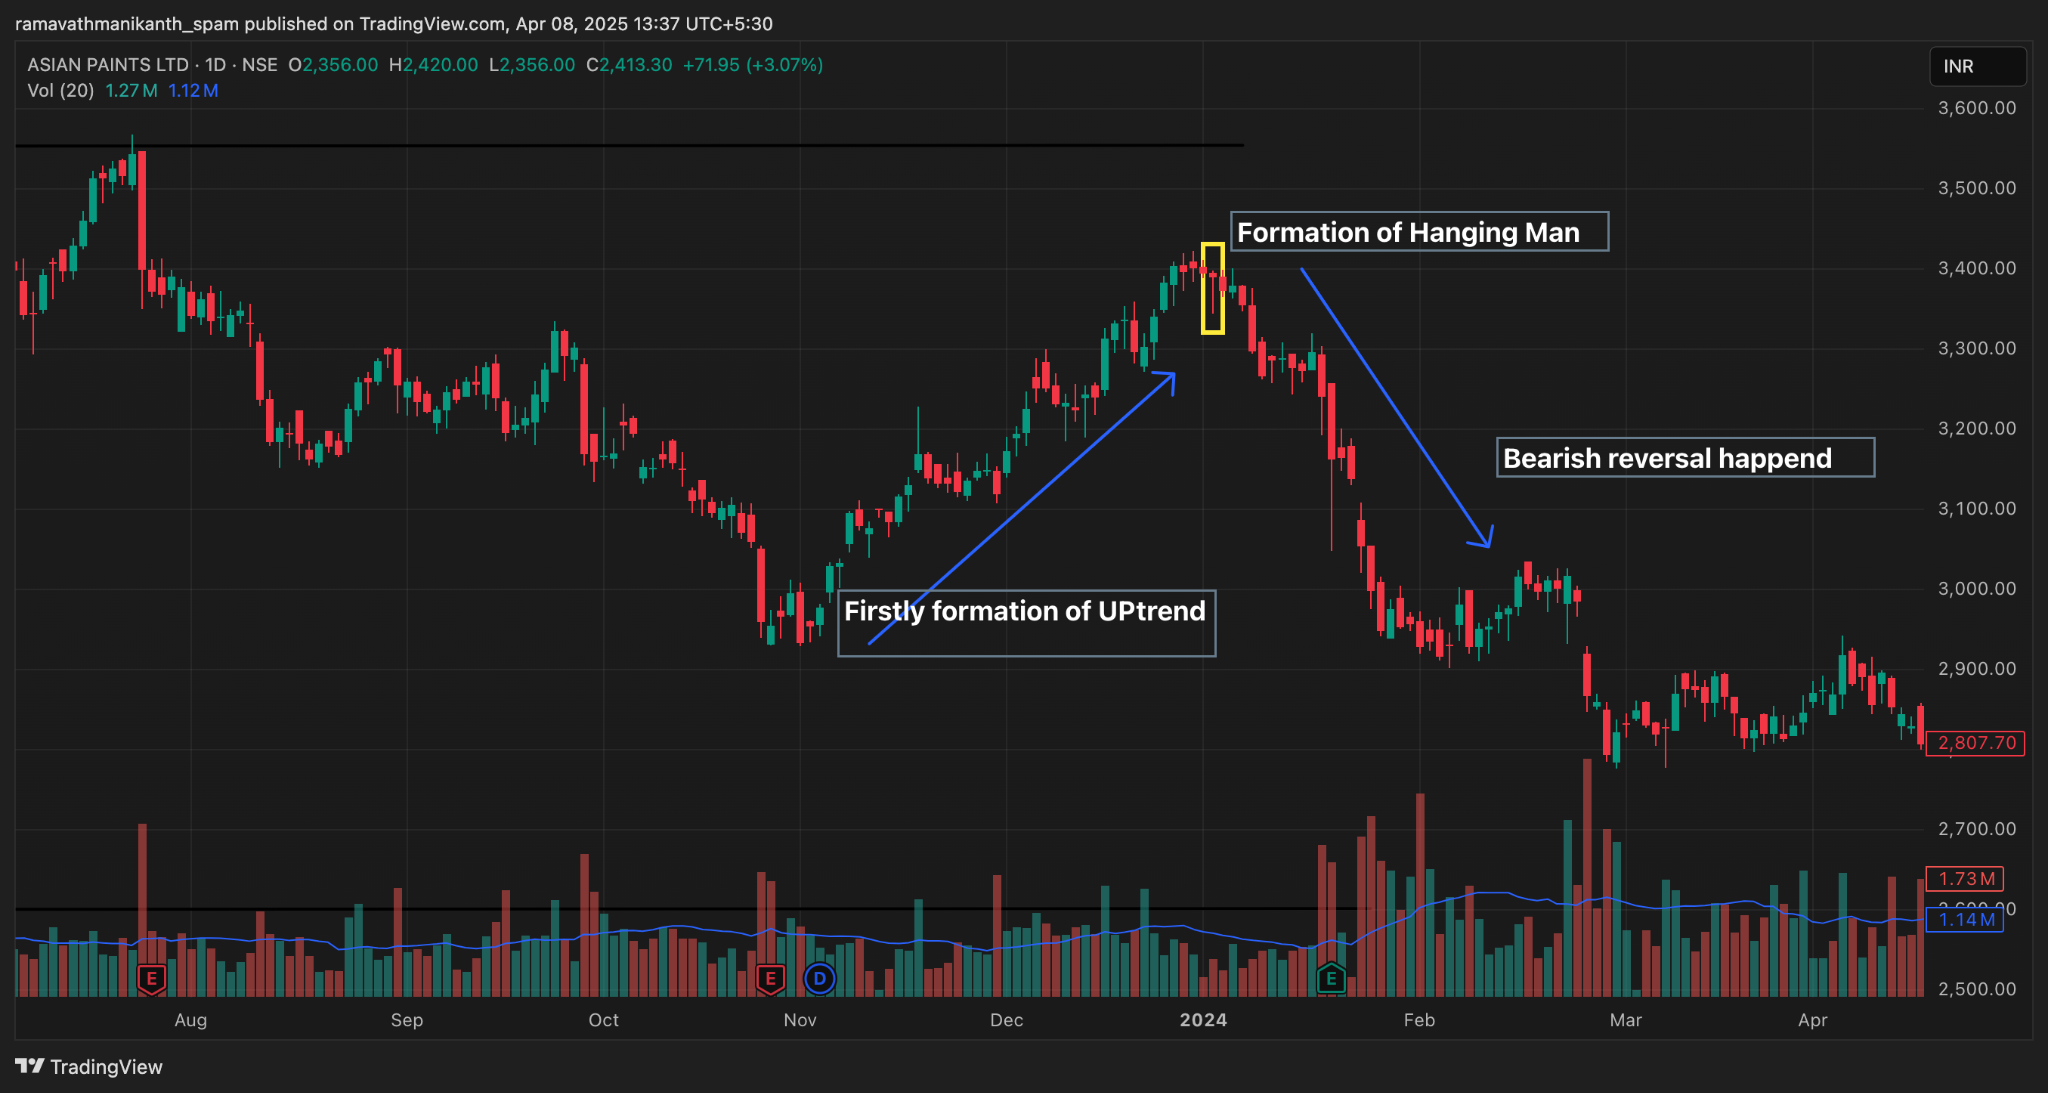
In the above chart of Asian Paints, after a significant trend, a hanging man pattern is formed. Asian Paints saw a downfall after the occurrence of a hanging man.
Types of Hanging Man Candlestick Pattern
The Hanging Man pattern can be classified into two types based on the colour of the candle:
Red Hanging Man Candlestick
In this pattern, the closing price is lower than the opening price, forming a red body. This indicates stronger selling pressure, as sellers managed to push prices down by the end of the session. It is generally considered a more reliable bearish signal.
Green Hanging Man Candlestick
Here, the closing price is higher than the opening price, forming a green body. While buyers managed to recover by the close, the long lower shadow still indicates selling pressure during the session. This suggests weakening bullish momentum.
Although colour is not the most critical factor, a red Hanging Man is often seen as a stronger indication of a potential reversal.
How to Identify the Hanging Man Pattern?
The Hanging Man pattern has specific characteristics that make it easy to recognise. However, it must always appear after an uptrend to be valid.
Small Body:
The candle has a small real body positioned near the top of the price range. It can be either red or green and indicates indecision between buyers and sellers.
Long Lower Wick:
The lower shadow is at least two times the size of the body. This shows that sellers pushed prices significantly lower during the session.
Little or No Upper Wick:
The candle has a very small or no upper shadow, indicating limited upward movement and weak buying strength.
Appears After a Uptrend:
This is a key condition. The pattern is only meaningful when it forms after a sustained upward price movement.
These features together indicate that selling pressure is entering the market and the uptrend may be losing strength.
What are the Pros and Cons of the Hanging Man Candlestick Pattern?
|
Advantages |
Disadvantages |
|---|---|
|
Early Warning: The Hanging Man can signal a potential trend reversal before prices actually start falling. |
Needs Confirmation: The pattern alone is not reliable and requires a bearish confirmation candle. |
|
Easy to Identify: Its small body and long lower shadow make it simple for traders to spot. |
False Signals: It may appear even when the uptrend continues, leading to incorrect trades. |
|
Improves Decision-making: When used with other indicators, it helps traders plan better entries and exits. |
Context Dependent: Its effectiveness depends on market conditions and trend strength. |
|
Useful for Short Trades: Helps traders identify potential shorting opportunities after an uptrend. |
Not Effective Alone: Should not be used without technical indicators or overall market analysis. |
Psychology Behind the Hanging Man Pattern
Hanging is a bearish reversal candlestick pattern. Here is the psychology behind the formation of a hanging man
- The market is in an uptrend, showing that buyers are in control and prices are steadily rising.
- Sudden selling pressure causes a sharp intraday drop, but buyers push the price back up before closing, leaving a small real body and a long lower wick.
- This signals that sellers are entering the market, buyer strength is weakening, and a potential trend reversal may be approaching.
Trade setup for Hanging Man
As a hanging man is a bearish reversal candlestick pattern, one should look for shorting opportunities for a particular stock or index. Wait for the formation of the hanging man candle.
Entry Point:
- For risk-takers: Enter a short position at the opening of the next candle after the Hanging Man forms, anticipating a reversal.
- For risk-averse traders: Wait for a clear confirmation candle (bearish close below Hanging Man’s body) before entering the trade.
Confirmation
A bearish candle following the Hanging Man is considered confirmation. It shows that sellers are continuing to push prices down, validating the reversal signal.
Stop loss
Place a stop loss above the high of the Hanging Man candle or the recent swing high, whichever is higher, to limit potential losses if the trade goes against you.
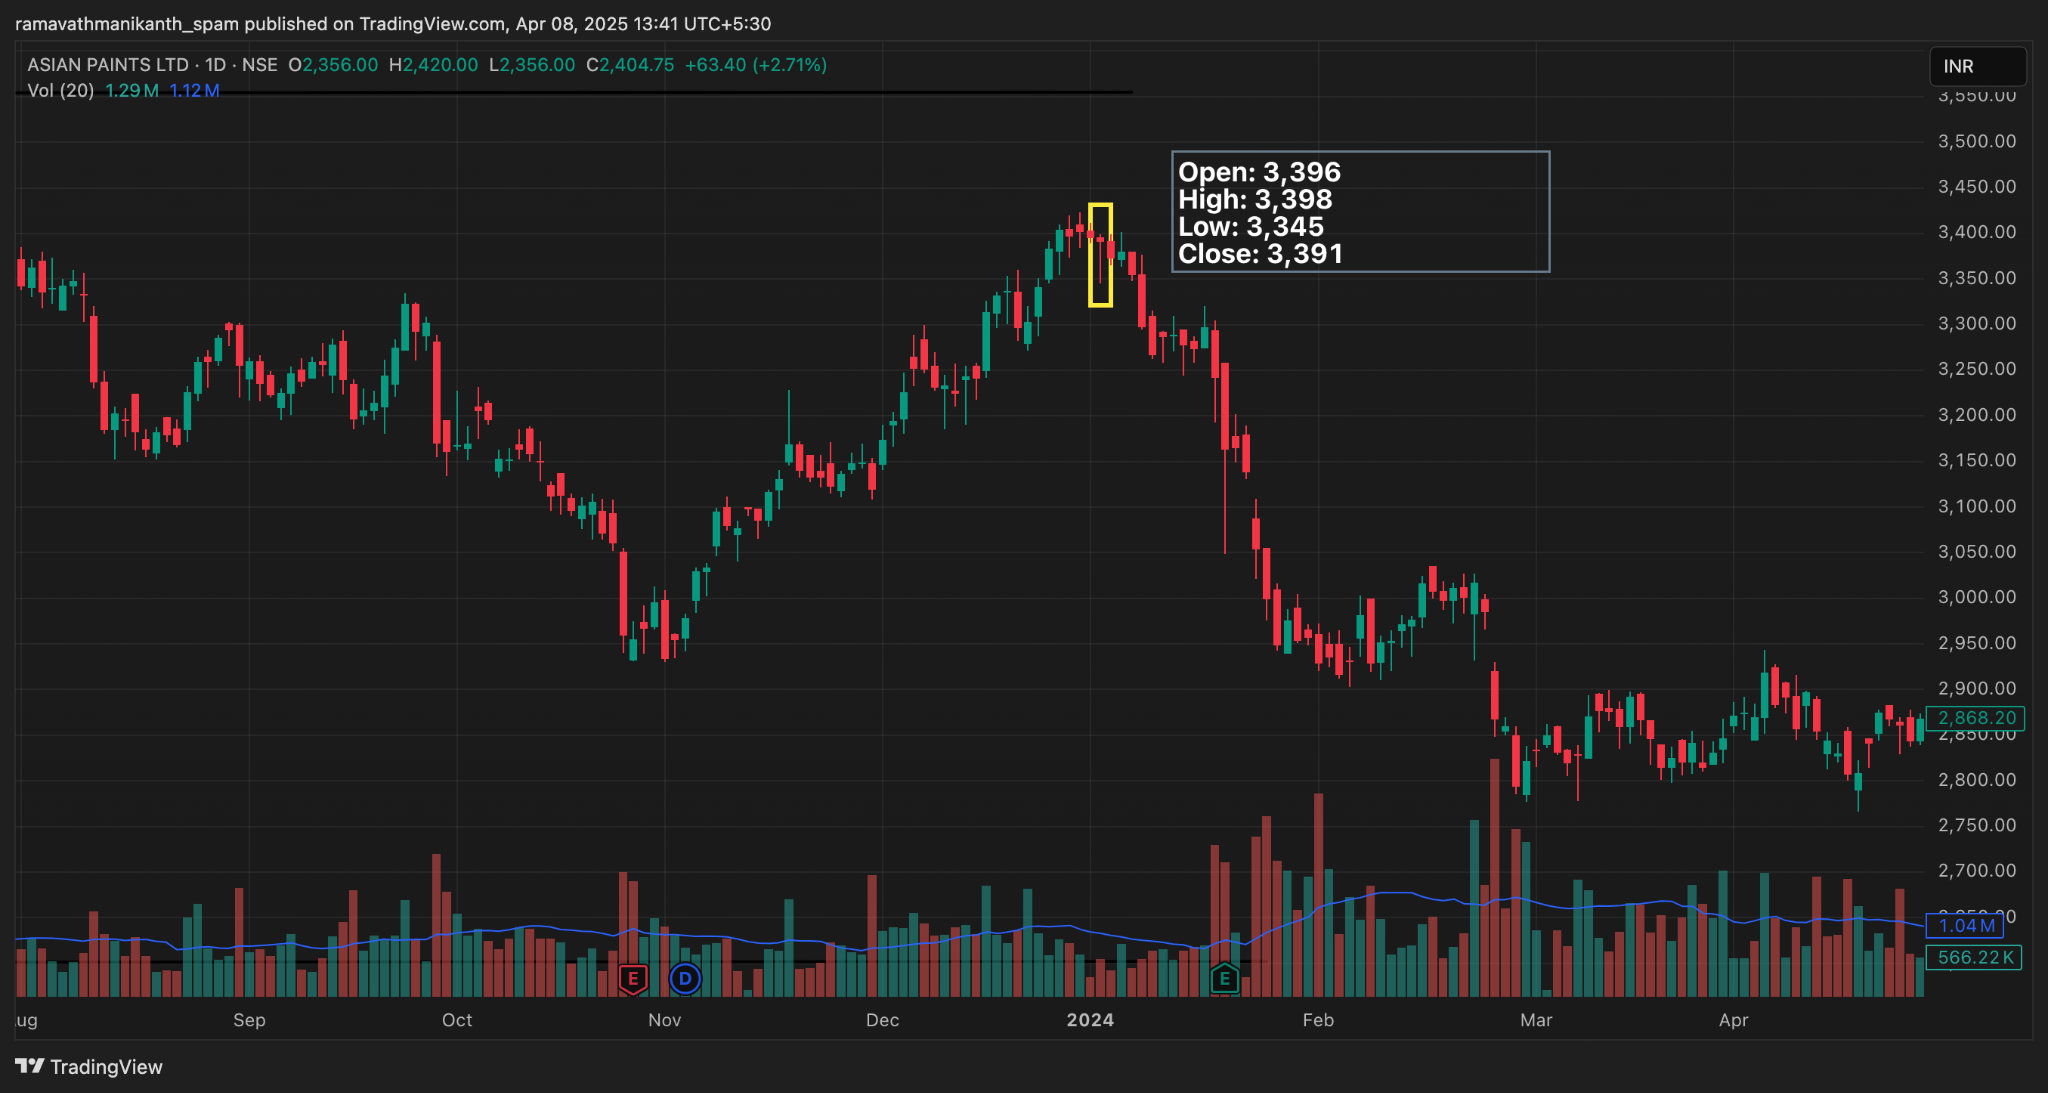
For the example of Asian paints below, the entry would be opening 3396, and the stop loss would be the high of candle 3398. We would have been profitable here.
Conclusion
The Hanging Man is a reliable bearish reversal signal when it appears after an uptrend, especially with confirmation. The Asian Paints example clearly marked the trend reversal, offering a profitable shorting opportunity. Traders should combine pattern recognition with proper risk management for effective decision-making.
Frequently Asked Questions about Hanging Man Pattern
Is Hanging Man bullish or bearish?
The Hanging Man is a bearish reversal pattern. It appears after an uptrend and suggests that the buying momentum is weakening.
What is a Hanging Man Candlestick?
A Hanging Man is a single candlestick pattern that forms at the top of an uptrend. It shows that sellers tried to take control, even though the day ended near the opening price. It warns of a possible price drop.
What is the opposite of Hanging Man?
The opposite of a Hanging Man is a Hammer. It forms after a downtrend and signals a possible bullish reversal, meaning prices may go up.
How do you trade a hanging man pattern?
Traders look for short opportunities after a Hanging Man appears in an uptrend. Enter on the next candle or after bearish confirmation. Place a stop-loss above the candle’s high and target lower levels as the trend reverses, ensuring proper risk management.
Disclaimer: This content is for educational purposes only and does not constitute financial or investment advice. Investments in securities or other financial instruments are subject to market risk, including partial or total loss of capital. Past performance is not indicative of future results. Always consider your financial situation carefully and consult a licensed financial advisor before making investment or trading decisions.
Engineered for the obsessed. Built for traders.

Purpose-built terminals.
Zero compromise.
Built for speed.
Plot No 1290, 2nd Floor, 17th Cross, 5th Main, Sector-7, HSR Layout, Bangalore 560102
Follow us on
Mintcap Brokers Private Limited
CIN – U66110KA2023PTC178706 | Registered Address: Plot No 1290, Second Floor, 17th Cross, 5th Main, Sector-7, HSR Layout, Bangalore 560102 | Tel: 080 – 49552310 | Email ID: compliance@capmint.com | SEBI registered Stock Broker: INZ000322732 | NSE Cash/F&O Member ID: 90430 | BSE Cash/F&O Member ID: 6903 | MCX Member ID: 57400 | NCDEX Member ID: 1312 | SEBI registered Depository Participant: IN-DP-806-2025 | CDSL DP ID: 12102300 | NSE Clearing Member code: M70108 | AMFI-Registered Mutual Fund Distributor: ARN-289109 (Valid upto 28-Feb-2027) | Category II Execution Only Platform : E6903
Details of Client Bank Account
Compliance Officer: Ms. Shridevi Vungarala | Email ID: compliance@capmint.com | Tel no. + 91 9035330126 | Grievance Redressal Officer (GRO) – Ms. Shikha Gupta | Email ID: Grievance@capmint.com | Tel no: 9035331595.
Procedure to file a complaint on SEBI SCORES: Register on SCORES portal. Mandatory details for filing complaints on SCORES: Name, PAN, Address, Mobile Number, E-mail ID. Benefits: Effective Communication, Speedy redressal of the grievances. You may refer the website https://scores.sebi.gov.in/ for more information. You may also download the SEBI Scores app to log a complaint Android: https://play.google.com > store > apps > sebiscores iOS: https://apps.apple.com > app > sebiscores
Disclaimer
Investment in the securities market are subject to market risks, read all the related documents carefully before investing. Brokerage will not exceed the SEBI prescribed limit.
Mutual fund investments are subject to market risks, read all scheme related documents carefully before investing. Mutual Funds are not exchange-traded products.
Attention Investor:
- Stock Brokers can accept securities as margin from clients only by way of pledge in the depository system w.e.f. September 1, 2020.
- Update your mobile number & email Id with your stock broker/depository participant and receive OTP directly from depository on your email id and/or mobile number to create pledge.
- Pay 20% as upfront margin of the transaction value to trade in cash market segment.
- Investors may please refer to the Exchange’s Frequently Asked Questions (FAQs) issued vide circular reference NSE/INSP/45191 dated July 31, 2020 and NSE/INSP/45534 dated August 31, 2020 and other guidelines issued from time to time in this regard.
- Check your Securities /MF/ Bonds in the consolidated account statement issued by NSDL/CDSL every month.