
Link copied!
Hammer Candlestick Pattern
A Hammer is a single-candle bullish reversal pattern that forms after a downtrend. It has a small real body near the top of the candle and a long lower shadow, with little or no upper shadow.
Key Takeaways
- Bullish Reversal Indicator – The Hammer pattern suggests that selling pressure is fading, and buyers may be ready to step in, especially when it forms at the bottom of a downtrend.
- Psychology Behind the Pattern – Discover the market sentiment and trader behaviour that make the Hammer a powerful visual cue for trend shifts.
- How to Trade It Effectively – Get practical tips on trade entry, stop-loss placement, profit targets, and the importance of confirmation for safer decision-making.
- Works Best with Support Levels – The Hammer becomes more reliable when it appears near established support levels, where buyers are already expected to defend the price and push it higher.
What is the Hammer Candlestick?
The Hammer is a single candlestick pattern that appears during a downtrend and signals a potential reversal to the upside. It has a small real body near the top of the candle and a long lower shadow, at least twice the length of the body. This formation shows that sellers drove prices lower during the session, but buyers pushed it back up by the close.
It gets its name because it “hammers out” a bottom, representing a potential turning point in the market.
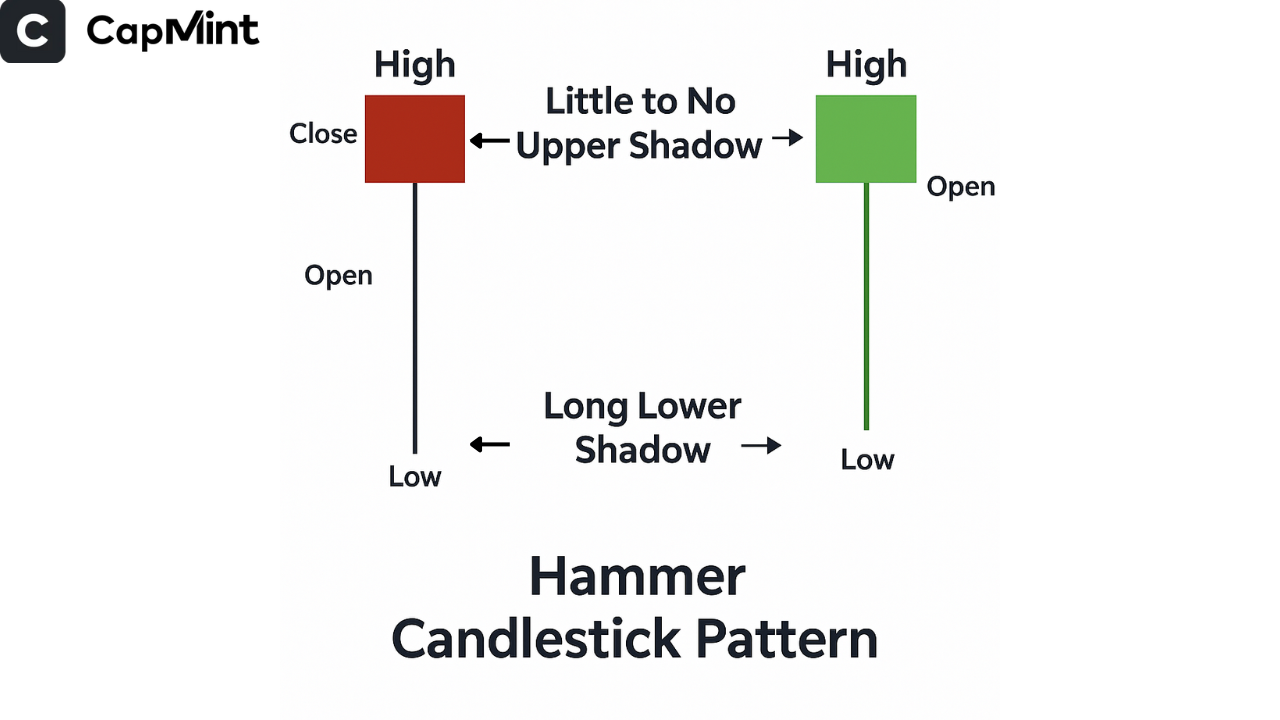
Components of the Hammer Pattern
Small Real Body
The open and close prices are close together and near the top of the candle.
Long Lower Shadow
At least two times the size of the body, showing a strong rejection of lower prices.
Little to No Upper Shadow
The absence of an upper wick reinforces the strength of the rebound.
The Hammer’s structure reflects a failed attempt by sellers to continue the downtrend and a strong comeback by buyers.
Types of Hammer Candlestick Patterns
Here are the main types of hammer candlestick patterns:
1) Hammer Candlestick Pattern
The hammer candlestick is formed when the closing price is higher than the opening price, showing that buyers gained control by the end of the session.
Even though sellers pushed the price lower initially, buyers stepped in strongly and drove the price back up. This shift in momentum signals a potential bullish reversal, especially after a downtrend.
2) Inverted Hammer Candlestick Pattern
The inverted hammer is formed when the closing price is higher than the opening price, with a long upper wick and a small body.
This pattern shows that buyers tried to push the price higher during the session but faced some resistance before closing. Although it is slightly weaker than a regular hammer, it still indicates a possible bullish reversal when it appears after a downtrend.
Psychology Behind the Pattern
The Hammer candlestick represents a shift in market sentiment. Initially, sellers are in control, pushing the price lower. However, buyers begin to enter the market aggressively, absorbing the selling pressure and eventually driving the price back up near or above the opening level.
This constant battle between bears and bulls ends with buyers regaining control, signalling that the market could be preparing for a bullish reversal. This psychological shift is crucial for interpreting the Hammer as more than just a shape; it’s a reflection of changing trader behaviour.
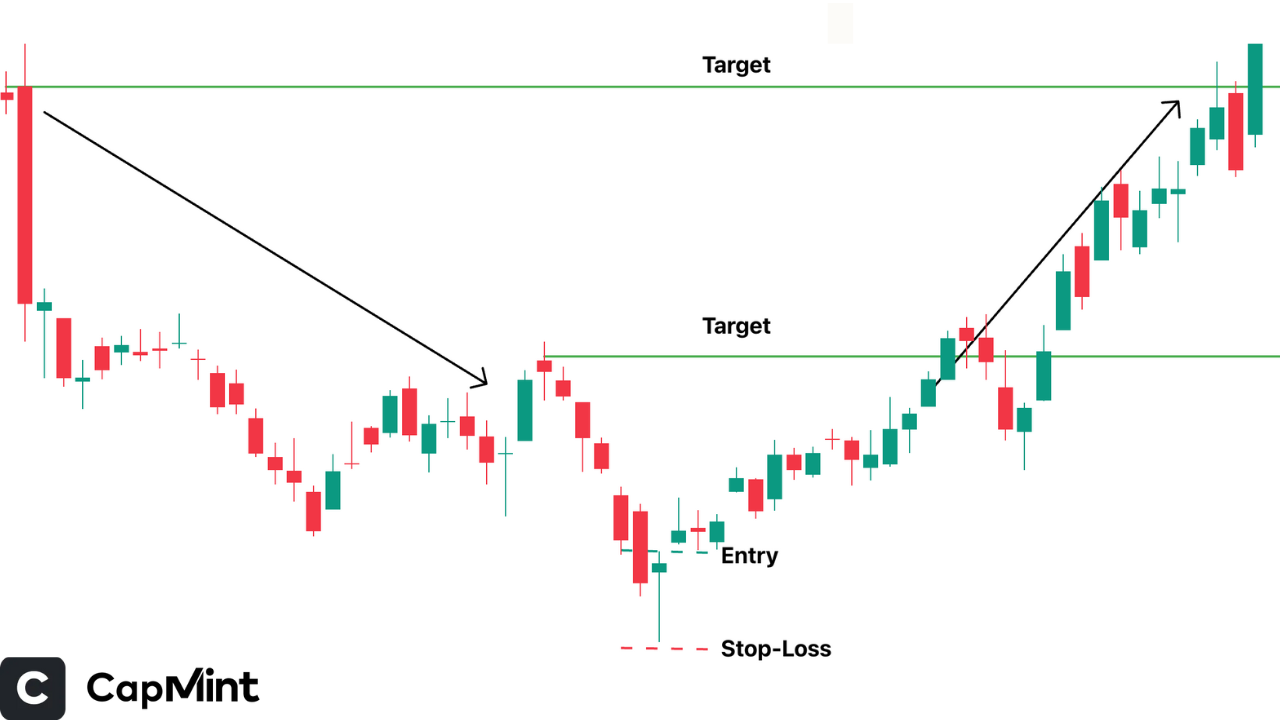
How to Trade the Hammer Pattern?
Entry Points
For aggressive traders, an entry can be made immediately after the Hammer forms, anticipating a quick reversal. For risk-averse traders, it’s safer to wait for confirmation, such as a strong green candle that closes above the Hammer’s high, before entering a trade.
Stop-Loss Placement
Set a stop-loss just below the low of the Hammer candle to limit potential downside risk if the reversal fails.
Profit Targets
Use prior resistance levels as a natural target, since price often reacts to those zones after a reversal. You can also combine them with Fibonacci retracement zones or set fixed risk-reward ratios (e.g., 1:2 or 1:3) based on your strategy.
Confirming the Pattern
Confirmation helps traders feel more confident when using the Hammer pattern. It helps filter out weak setups and avoid jumping in too early:
Volume
There should be significant buying power post the hammer pattern formation. This indicates that these buyers are willing to take the risk and are serious, and traders are showing further interest.
RSI (Relative Strength Index)
The RSI pattern, gaining value or bouncing off an oversold position, adds value to the setup and tends towards a reversal.
Support Zones
A hammer formation taking place near important support zones tends to be more accurate since these areas have a good value and high demand for purchasing.
Using these simple tools together can help improve decision-making and make the pattern more effective.
Advantages and Limitations
Understanding both the benefits and drawbacks of the Hammer pattern can help traders use it more effectively and avoid common mistakes.
Advantages:
- Easy to Spot – The Hammer has a simple and distinct look, making it great for beginners. You don’t need any special tools to recognise it on a chart.
- Helpful for Spotting Trend Reversals – This pattern often appears when a downtrend is losing strength. It gives traders a heads-up that prices might soon start to move upward.
- Works Across Timeframes and Markets – Whether you’re day trading or investing long-term, and no matter the asset, stocks, crypto, or forex, the Hammer pattern can be useful.
Limitations:
- Needs Extra Confirmation – The pattern alone doesn’t guarantee a reversal. To avoid bad trades, combine it with other signals like volume or RSI.
- Common in Sideways Markets – In flat or choppy markets, the Hammer can appear often, but may not mean anything. This can lead to false alarms.
- Doesn’t Show How Big the Move Will Be – Even if the pattern is correct, it doesn’t tell you how far or how long the price will rise. You’ll need other tools to judge that.
Conclusion
The Hammer candlestick pattern is a powerful signal of potential bullish reversal when found after a downtrend. While it’s easy to recognise and offers early entry opportunities, traders should always confirm the signal using volume, RSI, and key support zones. With proper risk management and confirmation, the Hammer can be a valuable tool in a trader’s strategy.
Frequently Asked Questions (FAQs)
Is the Hammer pattern bullish or bearish?
The Hammer pattern is considered a bullish signal. It typically shows that sellers tried to push the price lower but failed, and buyers managed to bring the price back up strongly.
Can the Hammer form in any trend?
While it can technically appear in any trend, it is most effective and meaningful when it shows up during a downtrend. That’s when it usually indicates a potential reversal to the upside.
How is it different from the Hanging Man?
Both patterns look alike, but their meaning changes with their location on the chart. A Hammer appears after a downtrend and signals a bullish reversal. A Hanging Man appears after an uptrend and warns of a bearish reversal.
Is volume important with the Hammer?
Yes, very much so. When the Hammer forms with higher volume, it confirms that buyers are stepping in forcefully. This gives more confidence that the trend might actually be changing.
Can beginners use this pattern?
Absolutely. The Hammer is simple to spot and understand, which makes it perfect for beginners. Just make sure to use confirmation tools like RSI or volume to boost your success rate.
Disclaimer: This content is for educational purposes only and does not constitute financial or investment advice. Investments in securities or other financial instruments are subject to market risk, including partial or total loss of capital. Past performance is not indicative of future results. Always consider your financial situation carefully and consult a licensed financial advisor before making investment or trading decisions.
Engineered for the obsessed. Built for traders.

Purpose-built terminals.
Zero compromise.
Built for speed.
Plot No 1290, 2nd Floor, 17th Cross, 5th Main, Sector-7, HSR Layout, Bangalore 560102
Follow us on
Mintcap Brokers Private Limited
CIN – U66110KA2023PTC178706 | Registered Address: Plot No 1290, Second Floor, 17th Cross, 5th Main, Sector-7, HSR Layout, Bangalore 560102 | Tel: 080 – 49552310 | Email ID: compliance@capmint.com | SEBI registered Stock Broker: INZ000322732 | NSE Cash/F&O Member ID: 90430 | BSE Cash/F&O Member ID: 6903 | MCX Member ID: 57400 | NCDEX Member ID: 1312 | SEBI registered Depository Participant: IN-DP-806-2025 | CDSL DP ID: 12102300 | NSE Clearing Member code: M70108 | AMFI-Registered Mutual Fund Distributor: ARN-289109 (Valid upto 28-Feb-2027) | Category II Execution Only Platform : E6903
Details of Client Bank Account
Compliance Officer: Ms. Shridevi Vungarala | Email ID: compliance@capmint.com | Tel no. + 91 9035330126 | Grievance Redressal Officer (GRO) – Ms. Shikha Gupta | Email ID: Grievance@capmint.com | Tel no: 9035331595.
Procedure to file a complaint on SEBI SCORES: Register on SCORES portal. Mandatory details for filing complaints on SCORES: Name, PAN, Address, Mobile Number, E-mail ID. Benefits: Effective Communication, Speedy redressal of the grievances. You may refer the website https://scores.sebi.gov.in/ for more information. You may also download the SEBI Scores app to log a complaint Android: https://play.google.com > store > apps > sebiscores iOS: https://apps.apple.com > app > sebiscores
Disclaimer
Investment in the securities market are subject to market risks, read all the related documents carefully before investing. Brokerage will not exceed the SEBI prescribed limit.
Mutual fund investments are subject to market risks, read all scheme related documents carefully before investing. Mutual Funds are not exchange-traded products.
Attention Investor:
- Stock Brokers can accept securities as margin from clients only by way of pledge in the depository system w.e.f. September 1, 2020.
- Update your mobile number & email Id with your stock broker/depository participant and receive OTP directly from depository on your email id and/or mobile number to create pledge.
- Pay 20% as upfront margin of the transaction value to trade in cash market segment.
- Investors may please refer to the Exchange’s Frequently Asked Questions (FAQs) issued vide circular reference NSE/INSP/45191 dated July 31, 2020 and NSE/INSP/45534 dated August 31, 2020 and other guidelines issued from time to time in this regard.
- Check your Securities /MF/ Bonds in the consolidated account statement issued by NSDL/CDSL every month.