
Link copied!
Bearish Engulfing Pattern
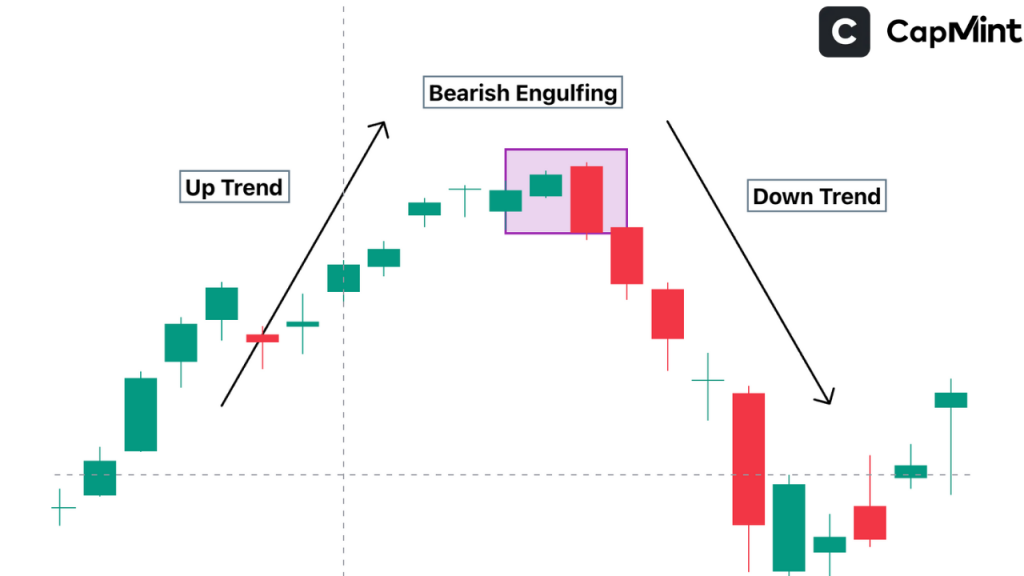
A Bearish Engulfing Pattern is a two-candle candlestick reversal pattern that appears at the end of an uptrend, signalling a potential shift from bullish to bearish momentum. It is widely regarded as one of the most reliable bearish reversal patterns in technical analysis.
Key Takeaways
- A Bearish Engulfing Pattern signals a potential trend reversal at the end of an uptrend when a large red candle completely engulfs the previous green candle.
- Confirmation is necessary using volume analysis, moving averages, and RSI, which can help validate the pattern before entering a trade.
- Risk management is crucial, as large engulfing candlesticks can create wide stop-loss levels. Traders should aim for favourable risk-reward ratios (1:2 or 1:3).
- Avoid common mistakes such as trading without confirmation, ignoring broader market trends, failing to set stop-losses, and relying solely on candlestick patterns without other indicators.
What is a Bearish Engulfing Pattern?
Imagine a stock’s price has been rising for several days. Suddenly, sellers step in and push the price lower, forming a strong red candle that completely engulfs the previous day’s green candle. This is called a Bearish Engulfing Pattern, and it signals that sellers are taking control.
Key Features of the Pattern
- A Bearish Engulfing indicator appears after an uptrend, signalling a possible reversal.
- The first candle is small and green, indicating buyers were in control.
- The second candle is large and red, completely engulfing the previous green candle, which suggests that sellers have stepped in with strong momentum, potentially pushing the price downward.
- The size differential between the two candles matters. A red candle that barely engulfs a relatively large green candle carries less conviction than one that dwarfs a small green candle by two or three times its range.
How to Interpret a Bearish Engulfing Pattern?
This pattern is a strong sign that the market sentiment is shifting. Initially, buyers attempt to push the price higher, continuing the existing uptrend. However, as the price approaches a certain resistance level, sellers step in with increased momentum, overpowering the buying pressure. The larger red candle that engulfs the previous green one indicates that sellers have gained control, creating a strong reversal signal.
For a Bearish Engulfing candlestick pattern to be valid, the red candle on day 2 should open gap-up in the morning and then close lower than the opening of the previous day’s green candle, ensuring that it engulfs the entire prior day’s candle. In Indian markets, particularly on Nifty 50 constituents, the gap-up component is often modest, sometimes just 0.2–0.5%, so the engulfing action relies more on the intraday sell-off than on a dramatic opening gap.
Since the stock both opens higher than it closed on day 1 and closes lower than it opened on day 1, the red candlestick in a Bearish Engulfing Pattern represents a day in which bulls initially controlled the price in the morning, only to have bears decisively take over by the end of the day.
This shift suggests that market participants are becoming more pessimistic, and if supported by increased trading volume and other technical indicators, it may present a shorting opportunity. One subtle detail worth watching is whether the selling accelerates in the final hour of the session. A red candle that builds most of its body in the last 60–90 minutes tends to carry stronger follow-through the next day compared to one where the bulk of the decline happened at the open and then stabilised.
How to Trade the Bearish Engulfing Pattern?
1. Wait for Confirmation
Don’t rush in just because you see the pattern; look for additional confirmation using:
Moving Averages: If the price drops below a key moving average (like the 50-day), it’s a strong signal that the stock may continue downward.
RSI (Relative Strength Index): If the Relative Strength Index is above 70 (overbought), the reversal is more likely. When the engulfing pattern forms with RSI between 65 and 70, the signal is weaker but still worth monitoring, especially if other indicators align.
Higher Volume: More sellers stepping in strengthens the pattern. You can look for weakening volume when the stock is in an uptrend and for rising volume when the Bearish Engulfing is formed. A useful benchmark is to check whether volume on the red candle day is at least 1.5 times the 10-day average volume. Anything below that makes the pattern less convincing.
Using additional indicators improves the trade setup. Traders should consider the broader market context, as just looking at two candlesticks may not be enough. Bearish Engulfing Patterns are more effective when they are preceded by four or more green candles.
Also, read about Volume in Trading.
2. Entry Point
A good strategy is to enter a trade at the opening of the next candle after the pattern forms.
More conservative traders wait for a slight price retracement to get a better shorting opportunity, but note that sometimes the price may not retrace after the formation of the engulfing red candle. In strongly bearish follow-throughs, the third day can gap down at the open, leaving retracement-seekers watching from the sidelines. Balancing between the two approaches often comes down to how aggressively the red candle closed relative to its low. If it closed near the day’s low, waiting for a pullback is reasonable; if it closed well above the low, the pattern’s strength is already somewhat diluted.
3. Stop-Loss & Risk Management
Set a stop-loss order above the high of the Bearish Engulfing candle to limit potential losses.
If you are trading solely based on this pattern, you could aim for 1:2 or 1:3 risk-reward trades. The challenge here is that a very large red candle creates a wide stop-loss distance, which can make the risk-reward arithmetic unfavourable unless the nearest support level is far enough below to justify the trade. Before entering, it is worth measuring the stop-loss distance in percentage terms. If the stop is more than 3–4% above the entry price, the position size may need to be reduced to keep the absolute risk manageable.
If you are looking for a longer-term trade, use additional indicators or fundamentals to decide whether to hold for a trend reversal.
Limitations of Using Bearish Engulfing Patterns
While a Bearish Engulfing Pattern can be a strong reversal signal, it is not always reliable. These patterns work best after a clear and sustained uptrend, as they indicate a shift in momentum. However, if the price action is erratic, volatile, or consolidating, the reliability of the pattern weakens. In sideways markets, engulfing patterns can appear frequently and fail just as often, generating false signals that erode capital through repeated small losses.
Another challenge is that the second candle in the pattern can sometimes be significantly large, making it difficult for traders to place a stop-loss without increasing risk. If the potential reward does not outweigh the risk, the trade might not be favourable.
Additionally, Bearish Engulfing Patterns do not provide a specific exit point. Traders must rely on other tools, such as moving averages, support levels, or trend analysis to determine profit-taking levels or when to close their short positions. A practical approach is to use the nearest horizontal support level as the first profit target and then trail the stop if the move extends beyond that level.
Common Mistakes to Avoid
Even though the Bearish Engulfing Pattern is a powerful signal, traders often make mistakes when interpreting or acting on it. Here are some common pitfalls and how to avoid them:
Jumping in Without Confirmation
Not all engulfing patterns lead to reversals. Some may appear due to temporary selling pressure that fades quickly. Always check for additional confirmation, such as higher volume, resistance levels, or other technical indicators, before making a trade. A common scenario is an engulfing pattern forming on a Friday afternoon with thin volumes, only for the stock to gap up on Monday as fresh buying resumes. Patterns formed on low-volume sessions deserve extra scepticism.
Ignoring the Market Trend
The Bearish Engulfing Pattern works best in markets that are topping out after an uptrend. If the stock market is moving sideways with no clear direction, the pattern may not be as effective. Always analyse the broader trend before acting. If the broader Nifty or sectoral index is still firmly trending upward, a bearish engulfing on an individual stock is more likely to result in a shallow pullback trading rather than a sustained reversal.
No Stop-Loss
Risk management is crucial in trading. Without a stop-loss, a trade that initially looks promising could turn into a significant loss. Always set a stop-loss above the high of the engulfing candle to protect against unexpected reversals.
Trading Only on Candlestick Patterns
Relying solely on the Bearish Engulfing Pattern without considering other technical indicators can be risky. For better accuracy, combine it with tools like moving averages, RSI, or trendlines to increase the probability of a successful trade.
By avoiding these mistakes and using a disciplined approach, traders can make better-informed decisions and improve their success rate when trading the Bearish Engulfing Pattern.
Conclusion
The Bearish Engulfing Pattern is a strong reversal signal that indicates a potential shift from bullish to bearish momentum. However, relying on this pattern alone can lead to false signals, especially in volatile or sideways markets.
Traders should always seek confirmation through indicators like moving averages, RSI, or volume analysis before entering a trade. Additionally, proper risk management is essential, with stop-losses placed strategically to minimise potential losses.
By combining this pattern with broader technical and fundamental analysis, traders can improve their chances of making successful short trades. The pattern is best treated as a trigger to investigate further, not as a standalone reason to commit capital.
Frequently Asked Questions (FAQs)
What is a Bearish Engulfing Pattern?
A Bearish Engulfing Pattern is a two-candle reversal pattern that typically appears after an uptrend. It consists of a smaller bullish (green) candle followed by a larger bearish (red) candle that completely engulfs the body of the previous candle, indicating a potential shift from bullish to bearish momentum.
How reliable is the Bearish Engulfing Pattern in predicting market reversals?
The Bearish Engulfing Pattern is generally considered a reliable indicator of potential market reversals, especially when it occurs after a clear uptrend and is accompanied by high trading volume. However, its reliability varies across different markets and timeframes. On daily charts, the pattern tends to produce more dependable signals than on intraday timeframes like 15-minute or hourly charts, where noise is higher. It is advisable to use it in conjunction with other technical indicators for confirmation.
What is the difference between a Bearish Engulfing Pattern and a Bearish Harami Pattern?
Both are bearish reversal patterns, but they differ in structure. A Bearish Engulfing Pattern features a smaller bullish candle followed by a larger bearish candle that engulfs the previous candle’s body. In contrast, a Bearish Harami Pattern consists of a large bullish candle followed by a smaller bearish candle that is contained within the body of the first candle. The engulfing pattern is generally regarded as the stronger signal of the two because of the more decisive shift in control it represents.
Can a Bearish Engulfing Pattern occur during a downtrend?
While a Bearish Engulfing Pattern typically appears after an uptrend, signalling a potential reversal to the downside, its occurrence during a downtrend may not carry the same significance and is generally considered less reliable as a reversal signal. In a downtrend, it may simply indicate continuation rather than a fresh reversal, which reduces its usefulness as a trading trigger.
How does trading volume affect the significance of a Bearish Engulfing Pattern?
Increased trading volume during the formation of the bearish engulfing candle adds credibility to the pattern, indicating strong selling pressure and increasing the likelihood of a true reversal. Conversely, an engulfing pattern formed on below-average volume suggests the move may lack institutional participation and is more prone to reversal.
Disclaimer: This content is for educational purposes only and does not constitute financial or investment advice. Investments in securities or other financial instruments are subject to market risk, including partial or total loss of capital. Past performance is not indicative of future results. Always consider your financial situation carefully and consult a licensed financial advisor before making investment or trading decisions.
Engineered for the obsessed. Built for traders.

Purpose-built terminals.
Zero compromise.
Built for speed.
Plot No 1290, 2nd Floor, 17th Cross, 5th Main, Sector-7, HSR Layout, Bangalore 560102
Follow us on
Mintcap Brokers Private Limited
CIN – U66110KA2023PTC178706 | Registered Address: Plot No 1290, Second Floor, 17th Cross, 5th Main, Sector-7, HSR Layout, Bangalore 560102 | Tel: 080 – 49552310 | Email ID: compliance@capmint.com | SEBI registered Stock Broker: INZ000322732 | NSE Cash/F&O Member ID: 90430 | BSE Cash/F&O Member ID: 6903 | MCX Member ID: 57400 | NCDEX Member ID: 1312 | SEBI registered Depository Participant: IN-DP-806-2025 | CDSL DP ID: 12102300 | NSE Clearing Member code: M70108 | AMFI-Registered Mutual Fund Distributor: ARN-289109 (Valid upto 28-Feb-2027) | Category II Execution Only Platform : E6903
Details of Client Bank Account
Compliance Officer: Ms. Shridevi Vungarala | Email ID: compliance@capmint.com | Tel no. + 91 9035330126 | Grievance Redressal Officer (GRO) – Ms. Shikha Gupta | Email ID: Grievance@capmint.com | Tel no: 9035331595.
Procedure to file a complaint on SEBI SCORES: Register on SCORES portal. Mandatory details for filing complaints on SCORES: Name, PAN, Address, Mobile Number, E-mail ID. Benefits: Effective Communication, Speedy redressal of the grievances. You may refer the website https://scores.sebi.gov.in/ for more information. You may also download the SEBI Scores app to log a complaint Android: https://play.google.com > store > apps > sebiscores iOS: https://apps.apple.com > app > sebiscores
Disclaimer
Investment in the securities market are subject to market risks, read all the related documents carefully before investing. Brokerage will not exceed the SEBI prescribed limit.
Mutual fund investments are subject to market risks, read all scheme related documents carefully before investing. Mutual Funds are not exchange-traded products.
Attention Investor:
- Stock Brokers can accept securities as margin from clients only by way of pledge in the depository system w.e.f. September 1, 2020.
- Update your mobile number & email Id with your stock broker/depository participant and receive OTP directly from depository on your email id and/or mobile number to create pledge.
- Pay 20% as upfront margin of the transaction value to trade in cash market segment.
- Investors may please refer to the Exchange’s Frequently Asked Questions (FAQs) issued vide circular reference NSE/INSP/45191 dated July 31, 2020 and NSE/INSP/45534 dated August 31, 2020 and other guidelines issued from time to time in this regard.
- Check your Securities /MF/ Bonds in the consolidated account statement issued by NSDL/CDSL every month.