
Link copied!
Marubozu
Marubozu is a Japanese term meaning ‘bald.’ A perfect Marubozu is a candlestick pattern with no upper and lower shadows (therefore appearing bald) represented by just the opening and closing prices, equal to the low and high prices.
Key Takeaways
- A Marubozu is a candlestick with no upper or lower shadows, showing strong buying or selling pressure depending on whether it’s bullish or bearish.
- A bullish Marubozu forms when the price opens at the low and closes at the high, signalling strong buyer control and a likely uptrend.
- A bearish Marubozu forms when the price opens at the high and closes at the low, indicating strong selling pressure and a potential downtrend.
- Marubozu patterns can be used to plan trades, but confirmation and stop losses are important to manage risk and avoid false signals.
Features of the Marubozu Candle Stick Pattern
The Marubozu candlestick is known for its distinct structure and strong indication of market sentiment. Key features include:
No upper or lower shadows:
The candle has no wicks, meaning the open and close are equal to the low and high prices.
Strong price movement:
It reflects continuous buying or selling pressure throughout the session.
Clear market control:
A bullish Marubozu shows buyers in control, while a bearish one indicates seller dominance.
Minimal price fluctuation:
Prices move in one direction with little to no retracement.
Reliable trend signal:
Often indicates the continuation or beginning of a strong trend when supported by volume.
Types of Marubozu Candles
Marubozu candles are broadly classified into two types:
Bullish Marubozu:
This forms when the price opens at the low and closes at the high, showing strong buying pressure. It usually signals a potential uptrend or continuation of an existing bullish trend.
Bearish Marubozu:
This forms when the price opens at the high and closes at the low, indicating strong selling pressure. It often signals a potential downtrend or continuation of bearish momentum.
Advantages and Disadvantages
Advantages
- Clear market sentiment: Easily shows whether buyers or sellers are in control.
- Strong trend indication: Helps identify the beginning or continuation of a trend.
- Simple to interpret: Easy for beginners to recognise and understand.
- Useful for entry timing: Provides potential entry signals when combined with confirmation indicators.
Disadvantages
- Lack of confirmation: On its own, it may give false signals without additional indicators.
- Sensitive to volatility: Can be misleading during highly volatile or news-driven markets.
- Not always perfect: Minor variations in wicks can still appear, making interpretation subjective.
- Limited context: Does not consider broader market trends or support/resistance levels.
How to Trade Using the Marubozu Trading Pattern?
Trading with the Marubozu pattern involves identifying strong momentum and acting accordingly:
Bullish setup:
Enter a buy position near the close of the bullish Marubozu or on the next candle after confirmation.
Bearish setup:
Enter a sell or short position when a bearish Marubozu forms, indicating strong downward momentum.
Confirmation:
Wait for the next candle to break the high (bullish) or low (bearish) for stronger confirmation.
Stop-loss placement:
Place stop-loss below the low of a bullish Marubozu or above the high of a bearish Marubozu to manage risk.
Use with indicators:
Combine with volume, RSI, or support-resistance levels for better accuracy.
Limitations of the Marubozu Trading Pattern
While effective, the Marubozu pattern has certain limitations:
- False signals: Not every Marubozu leads to a sustained trend, especially in sideways markets.
- Lack of context: It does not account for overall market conditions or macro factors.
- Short candles are unreliable: Small Marubozu candles may indicate weak momentum and should be avoided.
- Requires confirmation: Relying solely on this pattern can lead to incorrect trades.
- Risk of reversals: Sudden market changes can reverse the expected trend quickly.
Bullish Marubozu
How does a bullish Marubozu form?
A bullish Marubozu is a candle whose:
- Closing price is greater than its opening price.
- Opening price is equal to the low price.
- Closing price is equal to the high price.
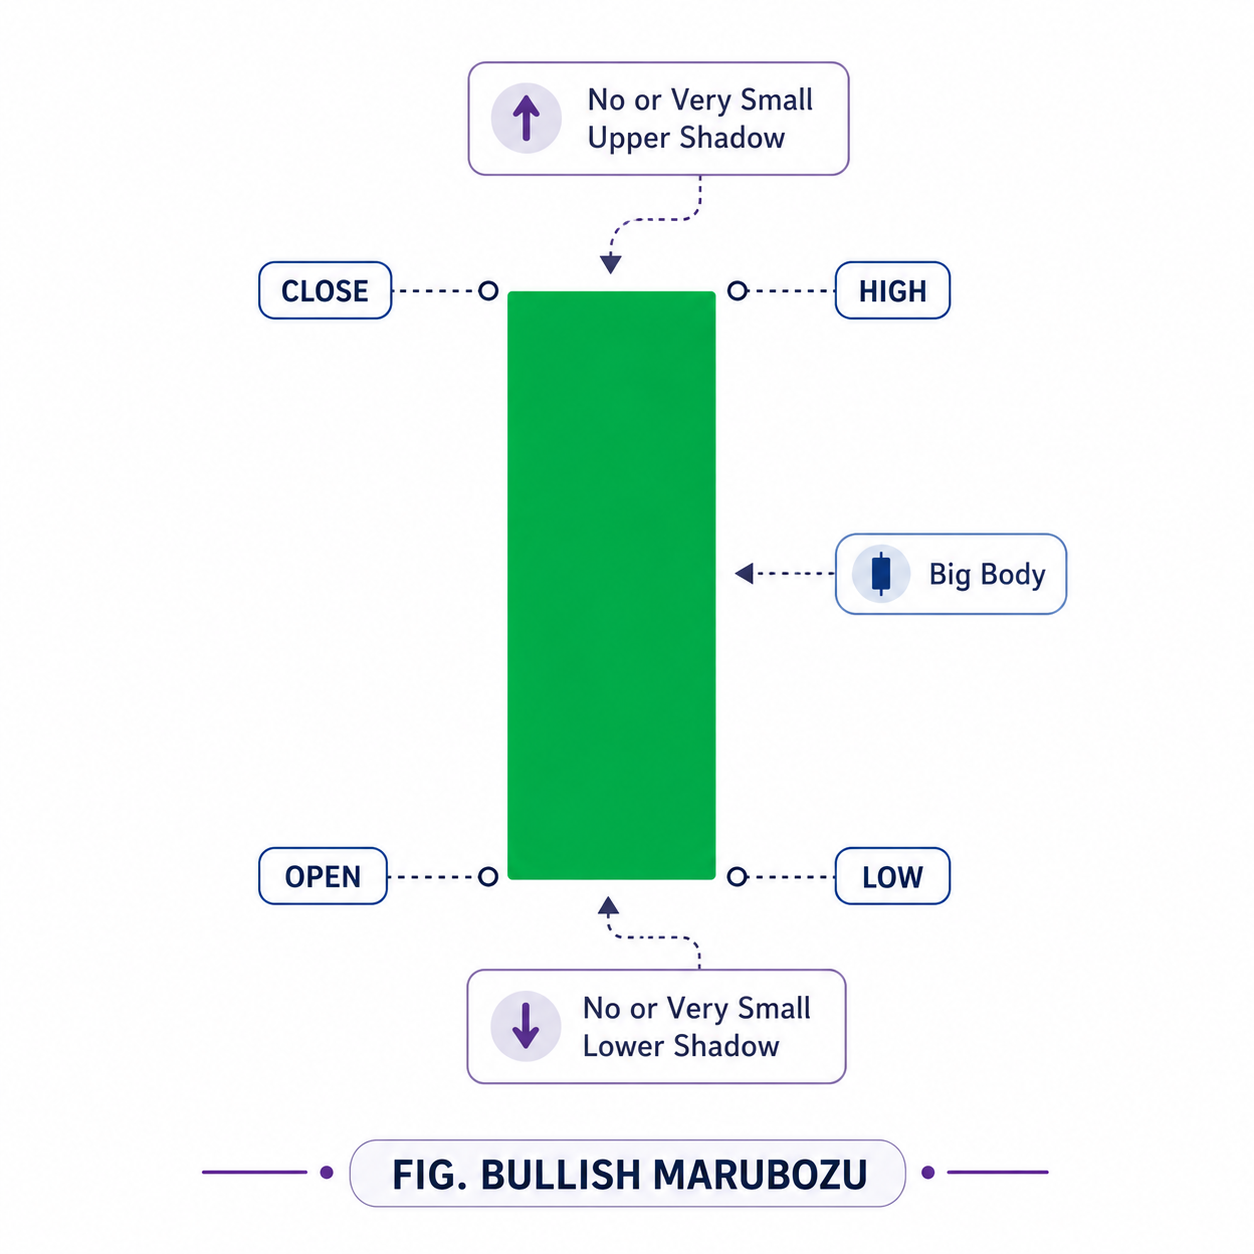
Whenever a candlestick with the above characteristics occurs, a bullish Marubozu is said to be formed. Irrespective of prior trends, a bullish Marubozu indicates strong bullishness in the market. It may look like this:
A bullish Marubozu signifies enormous buying pressure in the market. Considering a daily chart, market participants are willing to buy from the start of the day until the market closes for trading. This shows buyers have gained control of the market, and the overall market sentiment is bullish.
How to trade a bullish Marubozu?
As traders, we should seek buying opportunities since the market outlook has turned bullish with the appearance of the Marubozu candlestick. This bullish sentiment is anticipated to persist for the subsequent few trading sessions.
Ideally, a trade can be entered on the same day the Marubozu is formed, just before the market closes at 3:20 PM. Still, the bullish Marubozu must be validated by checking that the candle’s high equals the stock’s current market price (CMP). If these conditions are met, we can confirm that a bullish Marubozu is formed, and we can go long on the stock.
💡Long: Going “long” on an asset means buying and holding it because you expect its price to increase. This involves purchasing stocks, bonds, or other securities to sell them later at a higher price for a profit. It reflects a positive outlook on the asset’s future performance.
Entry point:
Enter the trade at or just below the close of the bullish Marubozu candle.
Confirmation:
An uptrend is confirmed if the next candle is bullish and breaks the high of the Marubozu. If you prefer a more risk-averse approach, you can also enter here.
Stop loss:
A stop loss can be placed below the low of the bullish Marubozu candle to limit potential losses.
Let’s understand with an example trade in Infosys.
Here, first, we will validate the physical characteristics of a candle as highlighted in the image.
Open = 1414
High = 1427
Low = 1413
Close = 1426
As we know, a bullish Marubozu’s opening price should equal its low price, and a high price should equal its closing price. Although the opening price does not match its low price, there is hardly any difference between them. Remember that there can be minor variations in candlestick patterns, and we must be flexible as long as the logic of the concept holds.
Based on our method, the trade setup for the above Infosys stock would be as follows:
Entry price = Between 1427 and 1430
Stop Loss = 1413
But if we want to confirm the formation of a bullish Marubozu or have a risk-averse approach, we must wait until the next day. The downside is that buying the next day results in a much higher purchase price and a deeper stop loss.
In our example, buying Infosys on the same day or the next day would have been profitable.
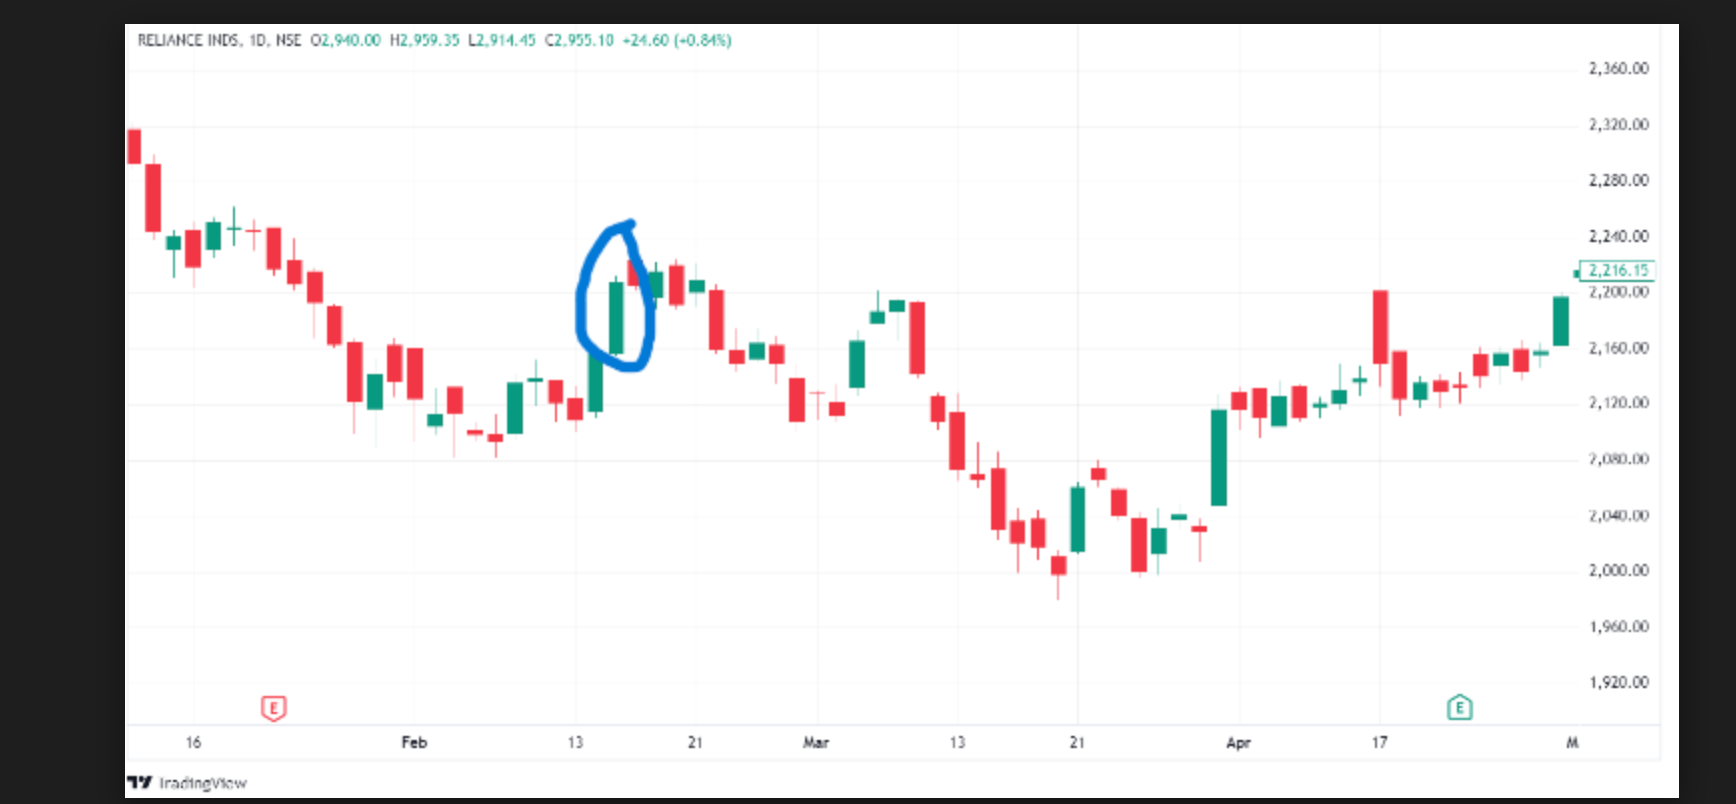
Here is another example of a bullish Marubozu pattern and a resulting uptrend:
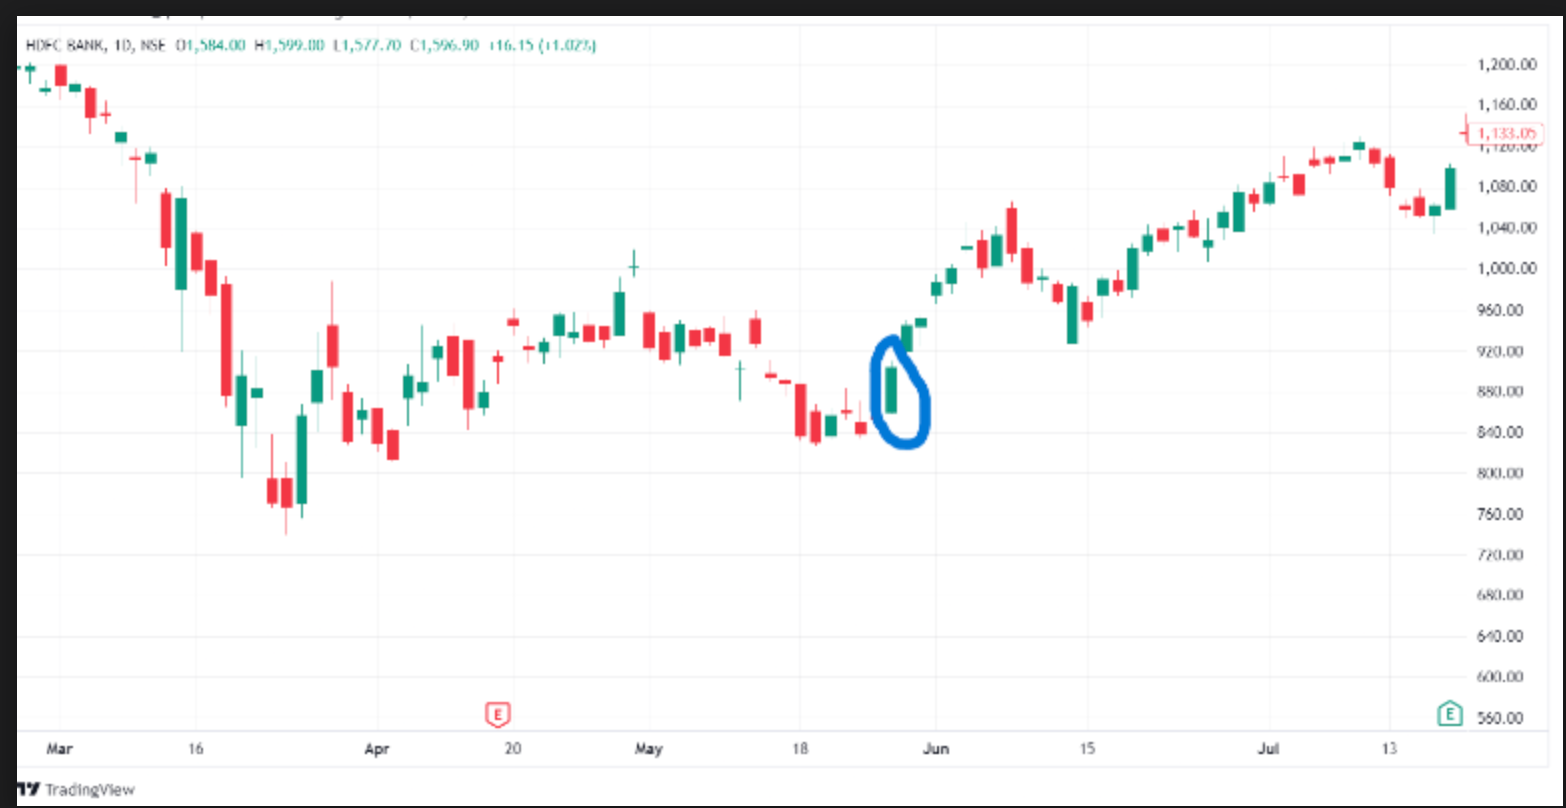
The above example of HDFC Bank shows that it would have been profitable here if we had bought this stock on the same day or the next day. However, there will be some cases where Marubozu candlesticks fail, like the one below:
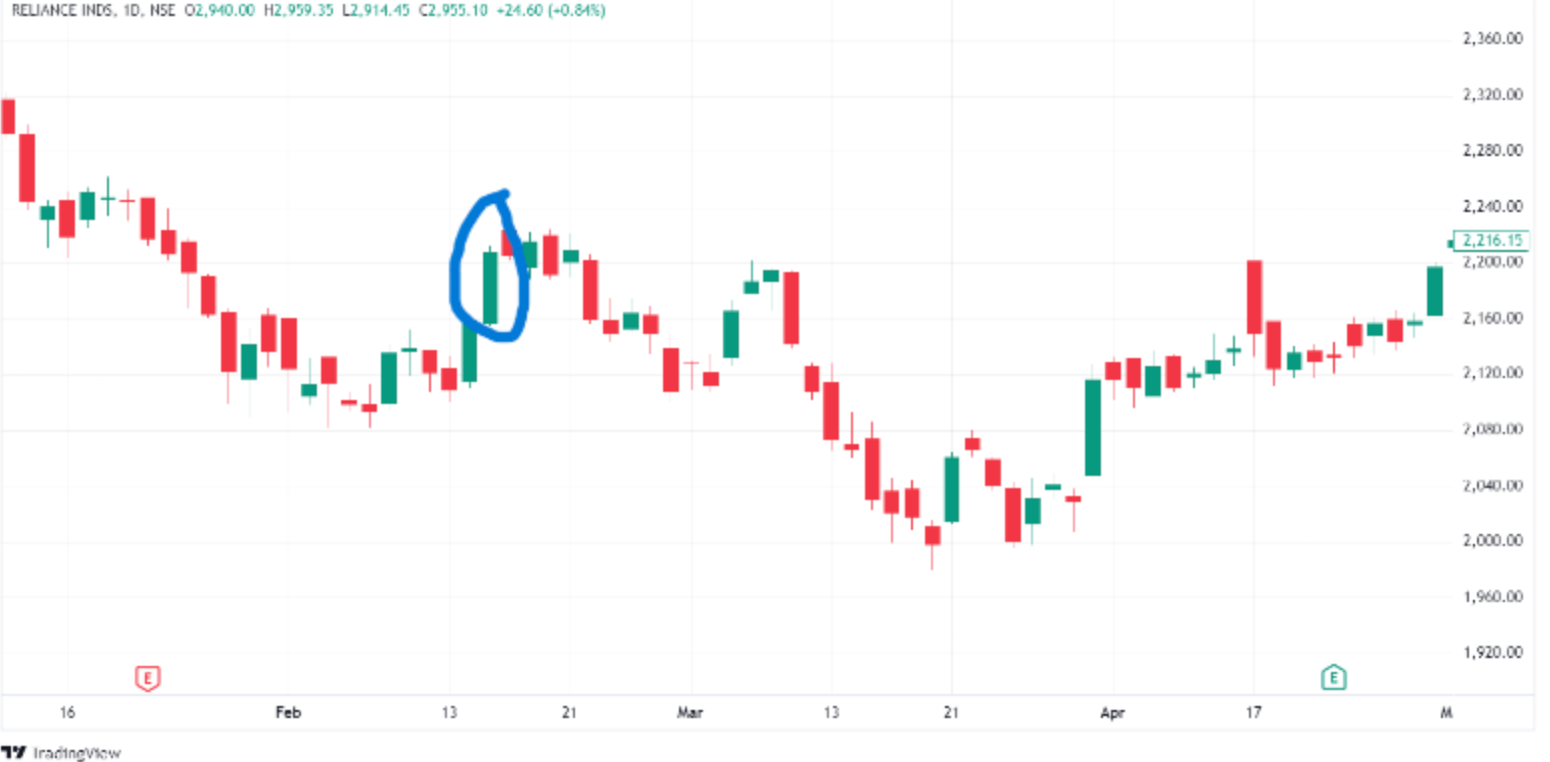
After a bullish Marubozu formed on Reliance’s stock, a downtrend resulted. Hence, remember that not every Marubozu is foolproof, and having a stop loss can help you deal with such situations.
Now, let’s move on to the bearish Marubozu.
Bearish Marubozu
How does a bearish Marubozu form?
As a bullish Marubozu indicates a strong sentiment of bullishness, the bearish Marubozu reflects bearish sentiment in the market, and it is formed when a candle’s
- The closing price is less than its opening price.
- The opening price is equal to its high price.
- The closing price is equal to its low price.
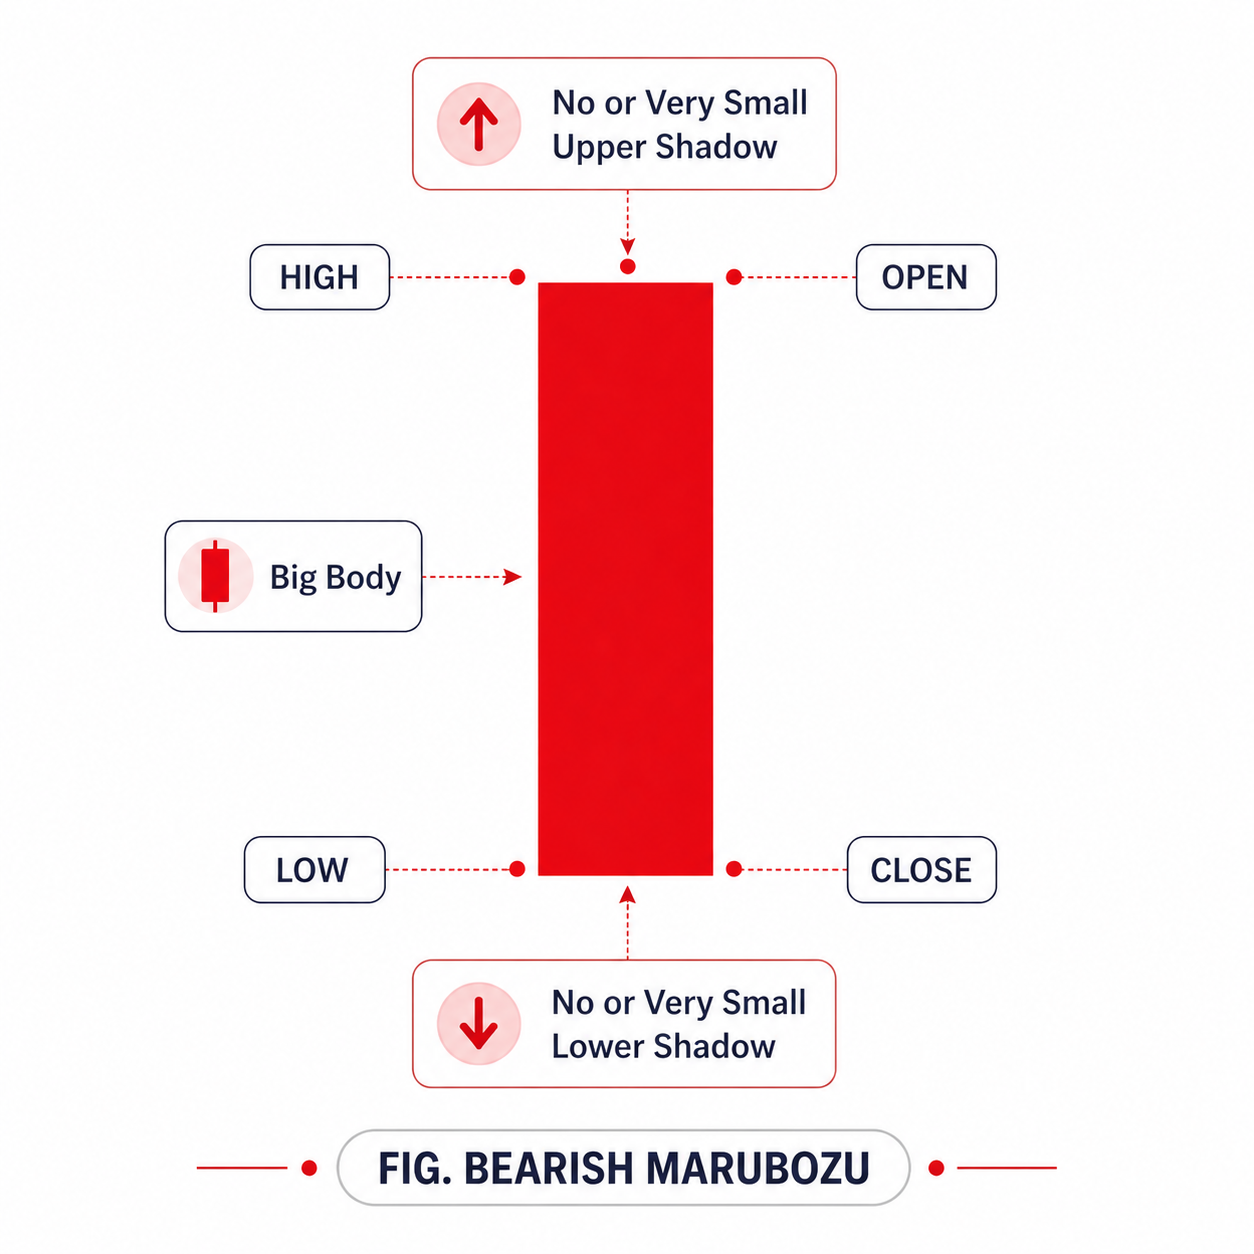
This candlestick indicates that selling is done for each price point throughout the day. It does not matter what the prior trend has been; the action on the Marubozu day suggests that the sentiment has changed, and the stock is now bearish.
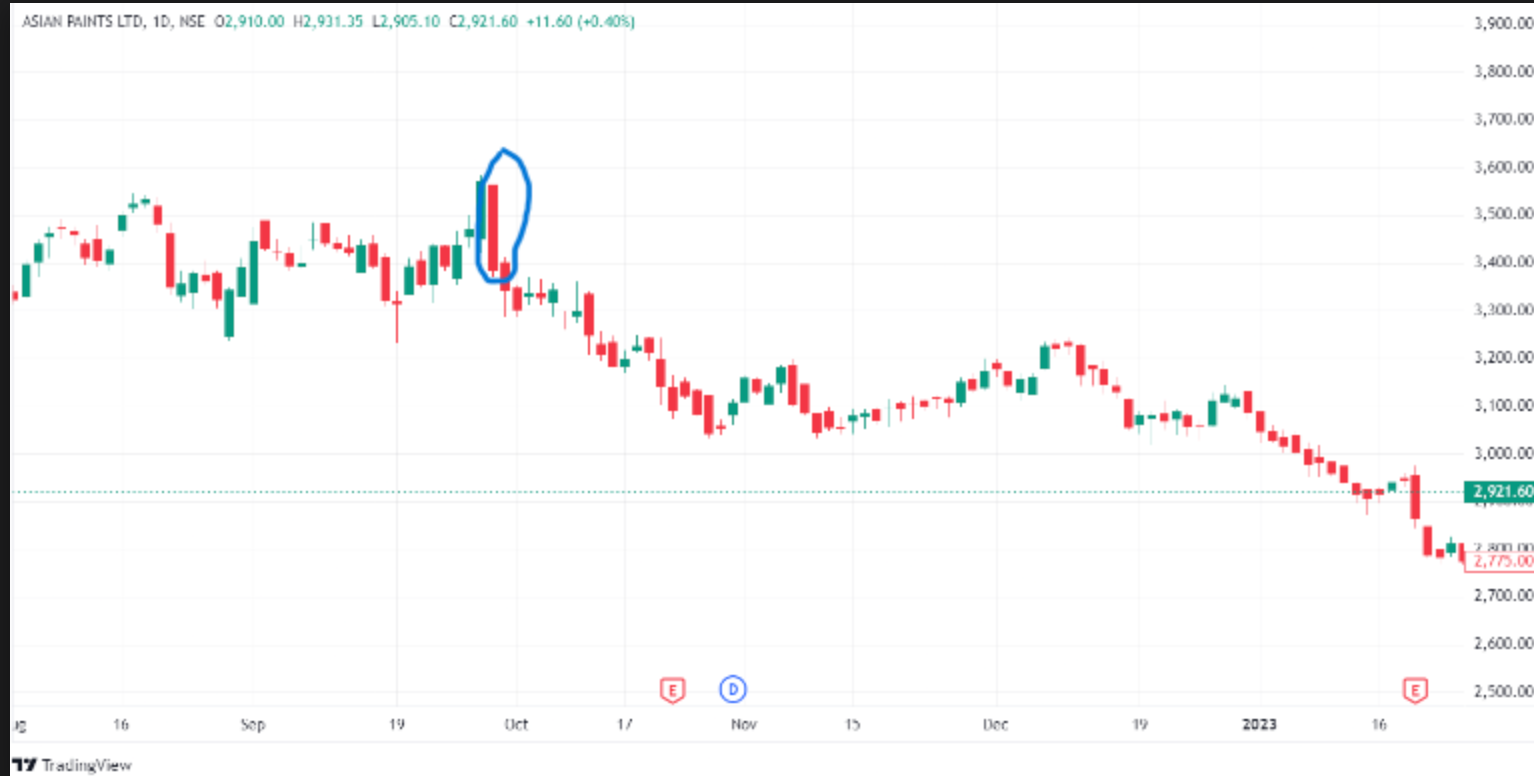
In the above chart of Asian Paints, a bearish Marubozu pattern is formed after a significant drop in the stock. If we look at the OHLC data,
Open = 3563
High = 3563
Low = 3378
Close = 3378
As mentioned before, a slight variation in OHLC is acceptable up to a specific limit.
💡Typically, for a Marubozu candle, the open and high (for bearish Marubozu) or open and low (for bullish Marubozu) can have a slight difference, generally not more than 1% of the stock’s price. We use this 1% limit because it ensures the candle still clearly indicates strong selling (or buying) pressure without significant price fluctuations, which might otherwise weaken the reliability of the Marubozu pattern.
For example, if the stock price is 3563, a 1% variation would be about 36 points. So, if the high were slightly higher at 3599, it would still be considered a valid Marubozu pattern. This 1% limit maintains the integrity of the Marubozu pattern by ensuring it accurately reflects market sentiment.
How to trade a bearish Marubozu?
A trader should look out for shorting opportunities in the market because sudden changes in sentiment will be carried forward over the subsequent few trading sessions.
- Entry Point: Enter the trade at the close of the bearish Marubozu candle or the opening of the next candle.
- Confirmation: Confirm the downtrend by checking if the next candle breaks the Marubozu low. If you prefer a more risk-averse approach, you can also enter here.
- Setting Stop Loss: Place the stop loss at the high of the Marubozu candle to limit potential losses if the trade goes against you.
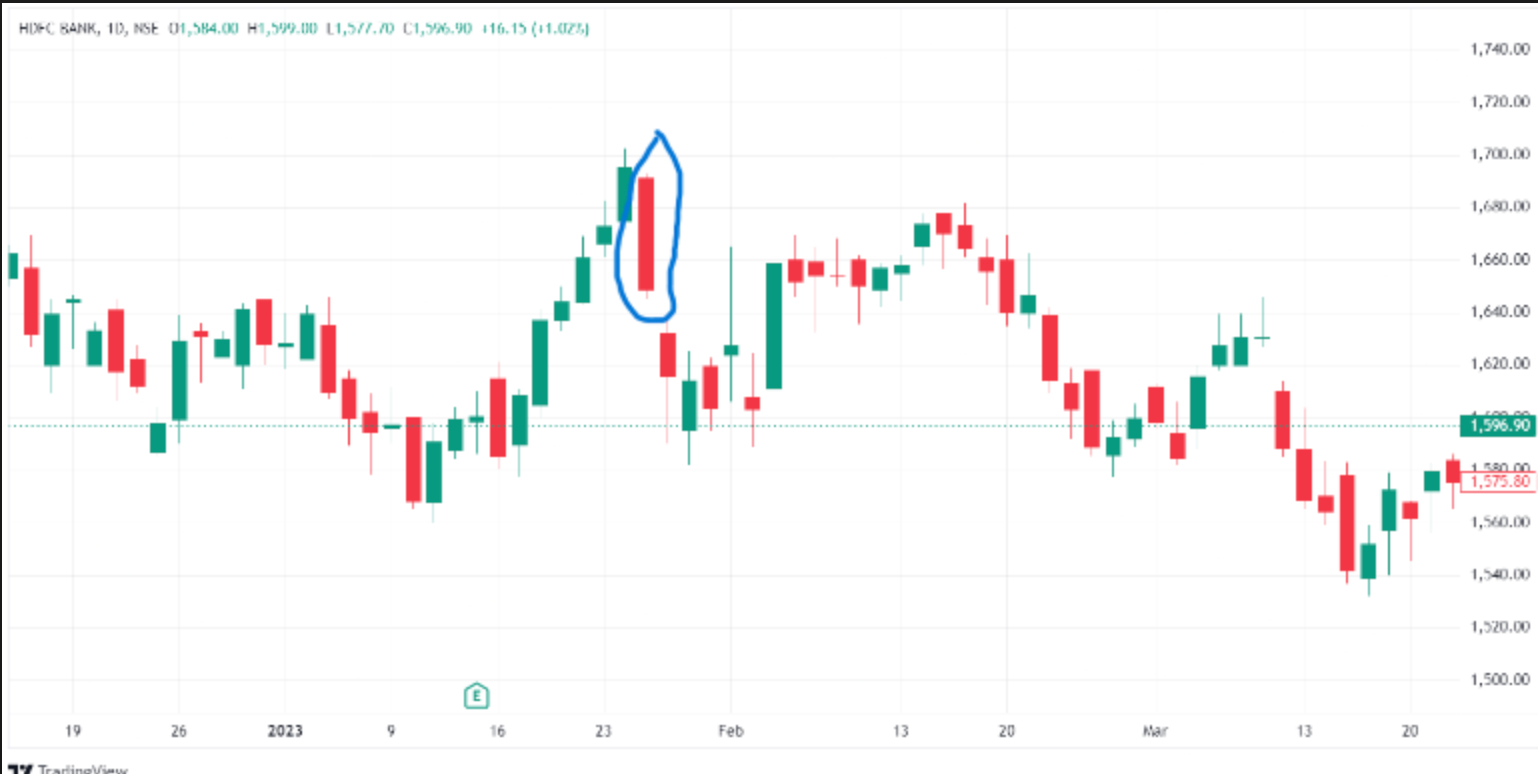
Let’s look at an example in HDFC Bank’s stock:
When the pattern falls short
Earlier in this chapter, we discussed why a candle’s length is essential. We should avoid trading when the candles are small because they show low trading activity. Small candles make it hard to predict market movement because they indicate that prices are the same, making it unclear how the market is going. With fewer people trading, price signals are less reliable, increasing overall volatility.
Here is an example from the Tata Motors Ltd. chart:
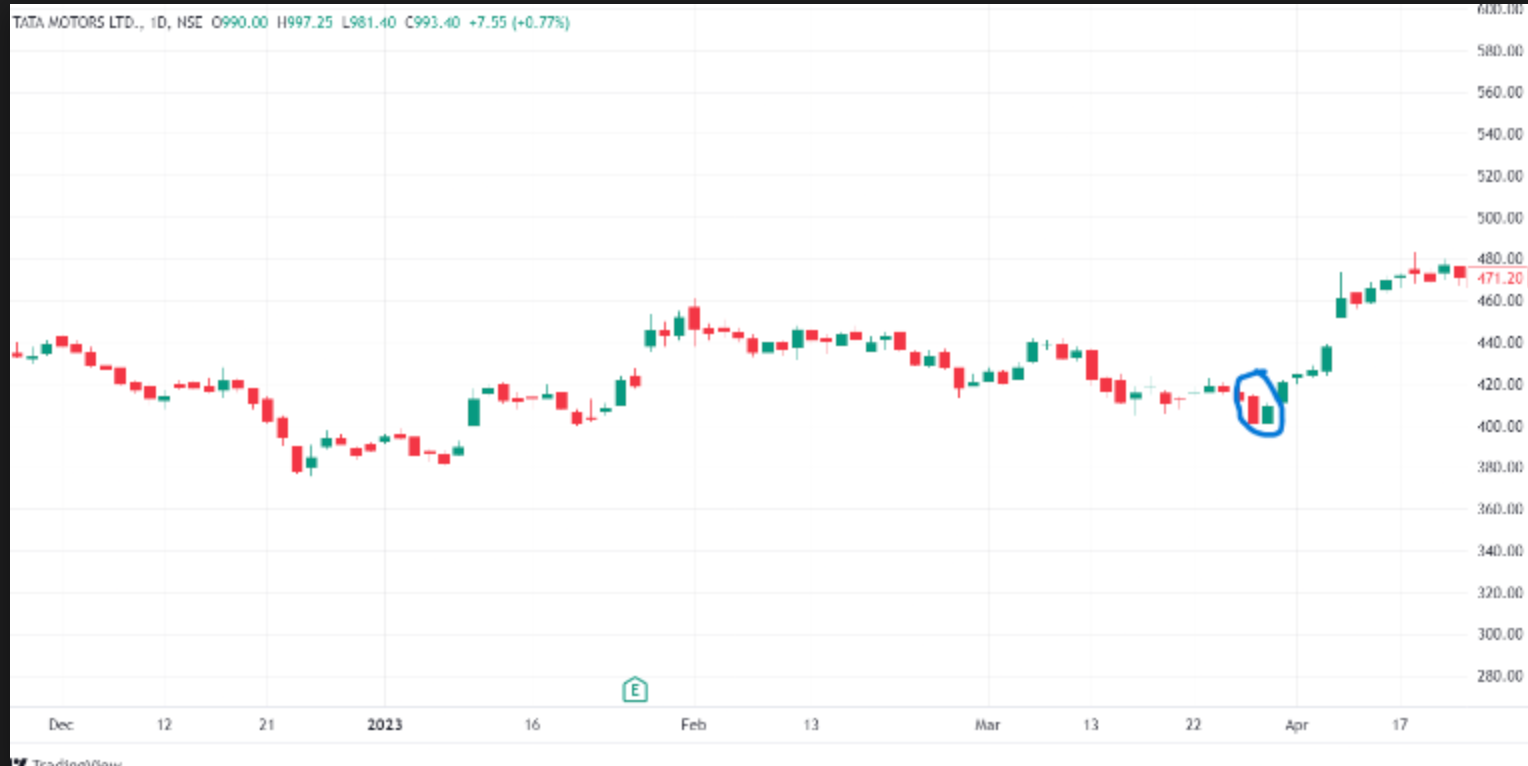
For this reason, one should avoid trading in candles that are too short.
Conclusion
The Marubozu candlestick is a powerful indicator of strong market sentiment. Whether bullish or bearish, it signals clear control by buyers or sellers. While useful for identifying potential trends, traders should always confirm the pattern and use stop losses to manage risk and avoid misleading signals in volatile markets.
Frequently Asked Questions (FAQs)
What does a Marubozu candlestick indicate?
A Marubozu candlestick indicates strong market momentum, where either buyers or sellers have complete control. A bullish Marubozu shows strong buying pressure, while a bearish Marubozu reflects strong selling pressure.
Is the Marubozu pattern reliable for trading?
The Marubozu pattern can be reliable in trending markets, but it should not be used alone. Traders should confirm the signal using indicators like volume or support-resistance levels to avoid false signals.
Where should you place a stop-loss in a Marubozu trade?
In a bullish Marubozu trade, the stop-loss is usually placed below the candle’s low. In a bearish Marubozu trade, it is placed above the candle’s high to limit potential losses.
Can a Marubozu candlestick have small wicks?
Yes, in real market conditions, a Marubozu may have very small wicks. Minor variations are acceptable as long as the candle still reflects strong buying or selling pressure and maintains its overall structure.
When should you avoid trading a Marubozu pattern?
You should avoid trading Marubozu patterns when the candle is too small or formed in low-volume conditions. Such signals may indicate weak momentum and can lead to unreliable trade setups or false signals.
Disclaimer: This content is for educational purposes only and does not constitute financial or investment advice. Investments in securities or other financial instruments are subject to market risk, including partial or total loss of capital. Past performance is not indicative of future results. Always consider your financial situation carefully and consult a licensed financial advisor before making investment or trading decisions.
Engineered for the obsessed. Built for traders.

Purpose-built terminals.
Zero compromise.
Built for speed.
Plot No 1290, 2nd Floor, 17th Cross, 5th Main, Sector-7, HSR Layout, Bangalore 560102
Follow us on
Mintcap Brokers Private Limited
CIN – U66110KA2023PTC178706 | Registered Address: Plot No 1290, Second Floor, 17th Cross, 5th Main, Sector-7, HSR Layout, Bangalore 560102 | Tel: 080 – 49552310 | Email ID: compliance@capmint.com | SEBI registered Stock Broker: INZ000322732 | NSE Cash/F&O Member ID: 90430 | BSE Cash/F&O Member ID: 6903 | MCX Member ID: 57400 | NCDEX Member ID: 1312 | SEBI registered Depository Participant: IN-DP-806-2025 | CDSL DP ID: 12102300 | NSE Clearing Member code: M70108 | AMFI-Registered Mutual Fund Distributor: ARN-289109 (Valid upto 28-Feb-2027) | Category II Execution Only Platform : E6903
Details of Client Bank Account
Compliance Officer: Ms. Shridevi Vungarala | Email ID: compliance@capmint.com | Tel no. + 91 9035330126 | Grievance Redressal Officer (GRO) – Ms. Shikha Gupta | Email ID: Grievance@capmint.com | Tel no: 9035331595.
Procedure to file a complaint on SEBI SCORES: Register on SCORES portal. Mandatory details for filing complaints on SCORES: Name, PAN, Address, Mobile Number, E-mail ID. Benefits: Effective Communication, Speedy redressal of the grievances. You may refer the website https://scores.sebi.gov.in/ for more information. You may also download the SEBI Scores app to log a complaint Android: https://play.google.com > store > apps > sebiscores iOS: https://apps.apple.com > app > sebiscores
Disclaimer
Investment in the securities market are subject to market risks, read all the related documents carefully before investing. Brokerage will not exceed the SEBI prescribed limit.
Mutual fund investments are subject to market risks, read all scheme related documents carefully before investing. Mutual Funds are not exchange-traded products.
Attention Investor:
- Stock Brokers can accept securities as margin from clients only by way of pledge in the depository system w.e.f. September 1, 2020.
- Update your mobile number & email Id with your stock broker/depository participant and receive OTP directly from depository on your email id and/or mobile number to create pledge.
- Pay 20% as upfront margin of the transaction value to trade in cash market segment.
- Investors may please refer to the Exchange’s Frequently Asked Questions (FAQs) issued vide circular reference NSE/INSP/45191 dated July 31, 2020 and NSE/INSP/45534 dated August 31, 2020 and other guidelines issued from time to time in this regard.
- Check your Securities /MF/ Bonds in the consolidated account statement issued by NSDL/CDSL every month.