
Link copied!
Death Cross
A death cross is a chart pattern that shows the price of an asset is weakening. It happens when a short-term moving average crosses below a long-term moving average. This crossover signals that momentum has shifted, and traders who were previously optimistic may now have a bearish outlook.
Key Takeaways
- A death cross is a bearish chart pattern that happens when a short-term moving average crosses below a long-term moving average, signalling that the price trend is weakening.
- Traders often use the 50-day and 200-day moving averages to identify a death cross. When the 50-day moves below the 200-day, it confirms that the recent price action is weaker than the long-term trend.
- The death cross can lead to increased selling pressure as traders react to the signal, creating negative sentiment in the market. However, it does not always mean a major crash is coming.
- The death cross is a lagging indicator, meaning it appears after the trend has already started shifting. It is best used with other technical and fundamental analysis tools for better decision-making.
What Is Death Crossover?
A death cross happens when a short-term moving average crosses below a long-term moving average, signalling a weakening trend and potential further decline in price. The death cross is usually observed using the 50-day and 200-day moving averages. When the short-term moving average (50-day) crosses below the long-term moving average (200-day), it confirms that recent price movements are weaker than the overall trend.
As traders notice this pattern, many start selling, leading to further price drops. This selling pressure creates negative sentiment in the market, which can spread and cause fear among investors, sometimes leading to panic selling.
The Psychology behind the Death Cross formation
The death cross forms when the short-term moving average (like the 50-day) crosses below the long-term moving average (like the 200-day), signalling a shift in market sentiment. Initially, the market is in an uptrend, with buyers in control.
But over time, momentum slows down—short-term price action weakens while the long-term trend holds steady. As selling pressure builds up and short-term averages decline, it reflects that traders are losing confidence.
Once the short-term average drops below the long-term average, it confirms that bears are taking control. This crossover reflects a broader shift from optimism to caution or even fear among market participants.
How to Trade Using the Death Cross Pattern?
The Death Cross is a bearish signal, so traders typically look for shorting opportunities or reducing long positions when they appear. Here’s how to approach it:
Wait for Confirmation
Don’t enter immediately on the crossover. Wait for price action to stay below both the 50-day and 200-day moving averages for a few sessions. This avoids false signals.
Entry Point
Once the price breaks a key support level after the death cross and shows continued weakness, it can be a good entry point for short trades or put options. You can also use it to exit existing long positions.
Combine with Other Indicators
Since the Death Cross is a lagging signal, combine it with leading indicators like RSI or MACD. For example, if RSI also moves into the overbought-to-oversold range, it can strengthen the bearish case.
Use in Trend Following
Swing traders and long-term investors use the Death Cross to confirm a shift from a bullish to a bearish market. It can be used to rebalance a portfolio more defensively.
Stop Loss and Risk Management
Always use a stop loss above recent resistance or moving average to manage risk, as markets can bounce back unexpectedly.
Example Of Death Crossover
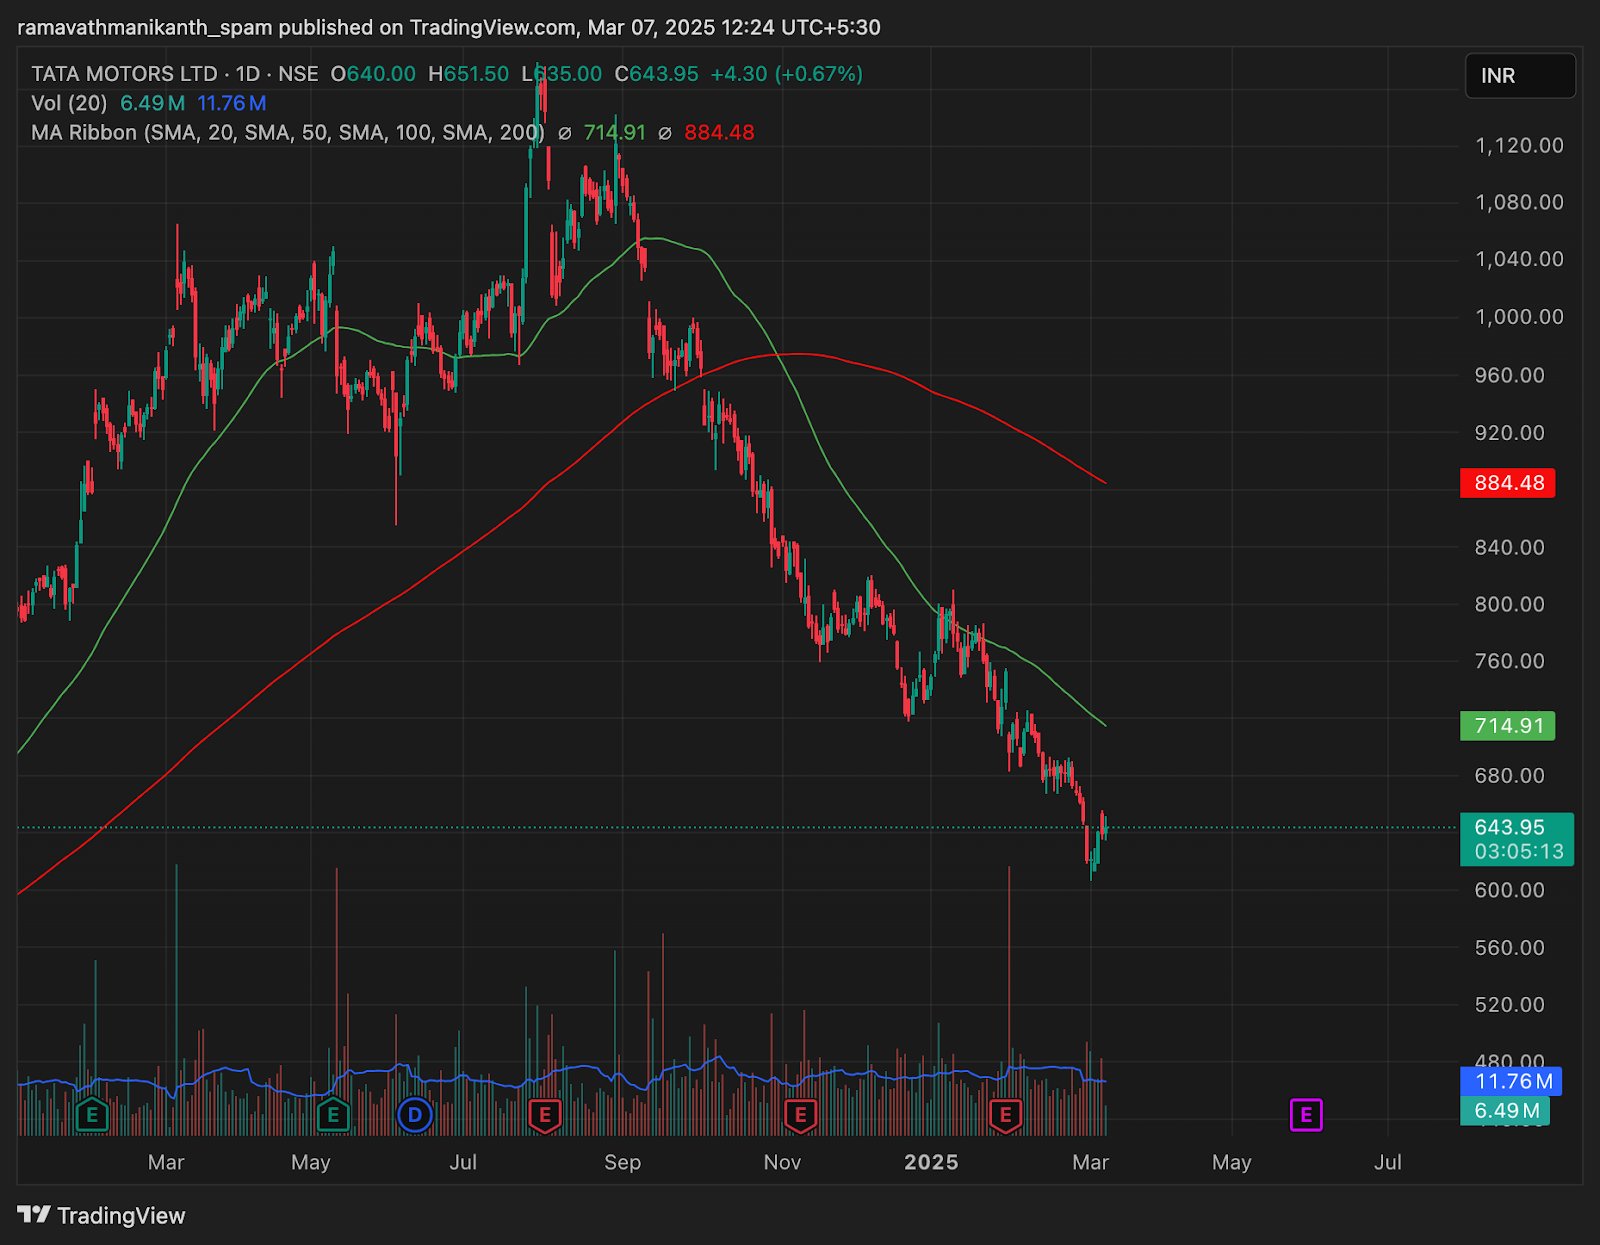
In a death cross, most stock traders use the 50-day and 200-day moving averages on the chart to identify the crossover; for example, in Tata Motors, a death cross occurred, signalling weakness in the stock. After the crossover, the price attempted to move above the 50-day moving average but got rejected, showing that buyers still lack confidence in the stock.
Death Crossover V/s Golden Crossover
A golden crossover is a bullish signal, while a death crossover is its opposite, indicating a bearish trend. In a death crossover, a short-term moving average crosses below a long-term moving average, showing that the price has lost momentum. This suggests that traders are shifting their outlook from bullish to bearish.
After the crossover, the long-term moving average often acts as a resistance level in a death cross, while in a golden cross, it serves as a support level. These crossovers can indicate a trend reversal, but they usually appear after the trend has already started changing.
Limitation Of Death Crossover
If predicting the market were as simple as watching the 50-day and 200-day moving averages, traders would quickly take advantage, making it less reliable. The death cross often grabs attention, but it has mostly signalled short-term negative sentiment rather than the start of a major market crash or recession.
Since moving averages are lagging indicators, the death cross usually appears after the market has already started declining. Since it is a lagging indicator, it can be used along with leading indicators like the RSI to strengthen the signal. For example, if a death cross forms and the RSI also shows the asset is entering an overbought-to-oversold zone, the chances of a trend reversal increase. It can also be used as a complementary tool for fundamental analysis, serving as a confirmation signal for broader market trends.
Conclusion
The death cross is a widely observed technical pattern that signals a potential downtrend, but it is not always a reliable predictor of major market crashes. It mainly reflects short-term shifts in sentiment rather than forecasting long-term trends. Since it is a lagging indicator, the market often starts declining before the crossover happens.
Traders should not rely solely on the Death Cross for investment decisions. Instead, it should be used alongside other technical indicators, fundamental analysis, and market conditions to get a clearer picture of market trends. Understanding its limitations can help investors make more informed and balanced trading choices.
Frequently Asked Questions on Death Cross
What is a death cross?
A death cross is a bearish signal that occurs when a short-term moving average crosses below a long-term moving average, usually the 50-day below the 200-day. It indicates weakening momentum and a potential downward trend.
Is the death cross a reliable indicator?
The death cross is widely followed but not always reliable on its own. It is a lagging indicator, meaning the trend may already be underway. It works better when combined with other indicators and overall market analysis.
What’s the difference between a death cross and a golden cross?
A death cross signals a potential downtrend when the short-term average falls below the long-term average. A golden cross is the opposite, indicating a possible uptrend when the short-term average moves above the long-term average.
Can I trade based on the death cross alone?
Relying only on the death cross can be risky. It is better to confirm the signal with other indicators like RSI, support levels, or volume trends to avoid false signals and improve decision-making.
Does the death cross always mean a market crash?
No, a death cross does not always lead to a major market crash. It often reflects short-term bearish sentiment and weakening momentum rather than predicting a long-term decline.
Disclaimer: This content is for educational purposes only and does not constitute financial or investment advice. Investments in securities or other financial instruments are subject to market risk, including partial or total loss of capital. Past performance is not indicative of future results. Always consider your financial situation carefully and consult a licensed financial advisor before making investment or trading decisions.
Engineered for the obsessed. Built for traders.

Purpose-built terminals.
Zero compromise.
Built for speed.
Plot No 1290, 2nd Floor, 17th Cross, 5th Main, Sector-7, HSR Layout, Bangalore 560102
Follow us on
Mintcap Brokers Private Limited
CIN – U66110KA2023PTC178706 | Registered Address: Plot No 1290, Second Floor, 17th Cross, 5th Main, Sector-7, HSR Layout, Bangalore 560102 | Tel: 080 – 49552310 | Email ID: compliance@capmint.com | SEBI registered Stock Broker: INZ000322732 | NSE Cash/F&O Member ID: 90430 | BSE Cash/F&O Member ID: 6903 | MCX Member ID: 57400 | NCDEX Member ID: 1312 | SEBI registered Depository Participant: IN-DP-806-2025 | CDSL DP ID: 12102300 | NSE Clearing Member code: M70108 | AMFI-Registered Mutual Fund Distributor: ARN-289109 (Valid upto 28-Feb-2027) | Category II Execution Only Platform : E6903
Details of Client Bank Account
Compliance Officer: Ms. Shridevi Vungarala | Email ID: compliance@capmint.com | Tel no. + 91 9035330126 | Grievance Redressal Officer (GRO) – Ms. Shikha Gupta | Email ID: Grievance@capmint.com | Tel no: 9035331595.
Procedure to file a complaint on SEBI SCORES: Register on SCORES portal. Mandatory details for filing complaints on SCORES: Name, PAN, Address, Mobile Number, E-mail ID. Benefits: Effective Communication, Speedy redressal of the grievances. You may refer the website https://scores.sebi.gov.in/ for more information. You may also download the SEBI Scores app to log a complaint Android: https://play.google.com > store > apps > sebiscores iOS: https://apps.apple.com > app > sebiscores
Disclaimer
Investment in the securities market are subject to market risks, read all the related documents carefully before investing. Brokerage will not exceed the SEBI prescribed limit.
Mutual fund investments are subject to market risks, read all scheme related documents carefully before investing. Mutual Funds are not exchange-traded products.
Attention Investor:
- Stock Brokers can accept securities as margin from clients only by way of pledge in the depository system w.e.f. September 1, 2020.
- Update your mobile number & email Id with your stock broker/depository participant and receive OTP directly from depository on your email id and/or mobile number to create pledge.
- Pay 20% as upfront margin of the transaction value to trade in cash market segment.
- Investors may please refer to the Exchange’s Frequently Asked Questions (FAQs) issued vide circular reference NSE/INSP/45191 dated July 31, 2020 and NSE/INSP/45534 dated August 31, 2020 and other guidelines issued from time to time in this regard.
- Check your Securities /MF/ Bonds in the consolidated account statement issued by NSDL/CDSL every month.