
Table of Content
- Key Takeaways
- What Is an Exponential Moving Average?
- How is an EMA calculated?
- How EMA Works in Technical Analysis?
- What is the Objective of EMA?
- How to Use the Exponential Moving Average Strategy?
- How to Choose the Right EMA Period for Your Trading Strategy?
- EMA vs. SMA
- Advantages and Limitations of EMA
- How to Backtest EMA Strategies?
- Conclusion
- Frequently Asked Questions (FAQs)
Link copied!
Exponential Moving Average (EMA)
An Exponential Moving Average (EMA) is a technical indicator that gives weight to the recent and current closing prices, making it more responsive to price changes than the Simple Moving Average (SMA). It is used to identify bullish or bearish trends in the markets.
Key Takeaways
- The Exponential Moving Average (EMA) is a tool in stock trading that focuses more on recent prices, helping traders track trends quickly compared to the Simple Moving Average (SMA).
- EMA helps identify whether a stock is in an uptrend or a downtrend. If the price is above the EMA, it suggests upward momentum, and if it is below, it indicates a downward trend.
- EMA acts as a support or resistance level during strong trends. In an uptrend, it can serve as a “floor” for prices, while in a downtrend, it can act as a “ceiling.”
- Combining EMA with other indicators like RSI or MACD improves decision-making by confirming trends and reducing false signals in the market.
What Is an Exponential Moving Average?
An exponential moving average, also known as EMA, gives more importance and weight to current and recent data prices. Unlike the Simple Moving Average (SMA), which assigns equal weight to all data points in a given period, the EMA applies a weighting factor that prioritises more recent closing prices.
This makes the EMA more responsive to sudden price changes and fluctuations, thereby helping traders and investors quickly identify emerging trends. The EMA is particularly useful in determining the strength and direction of market trends.
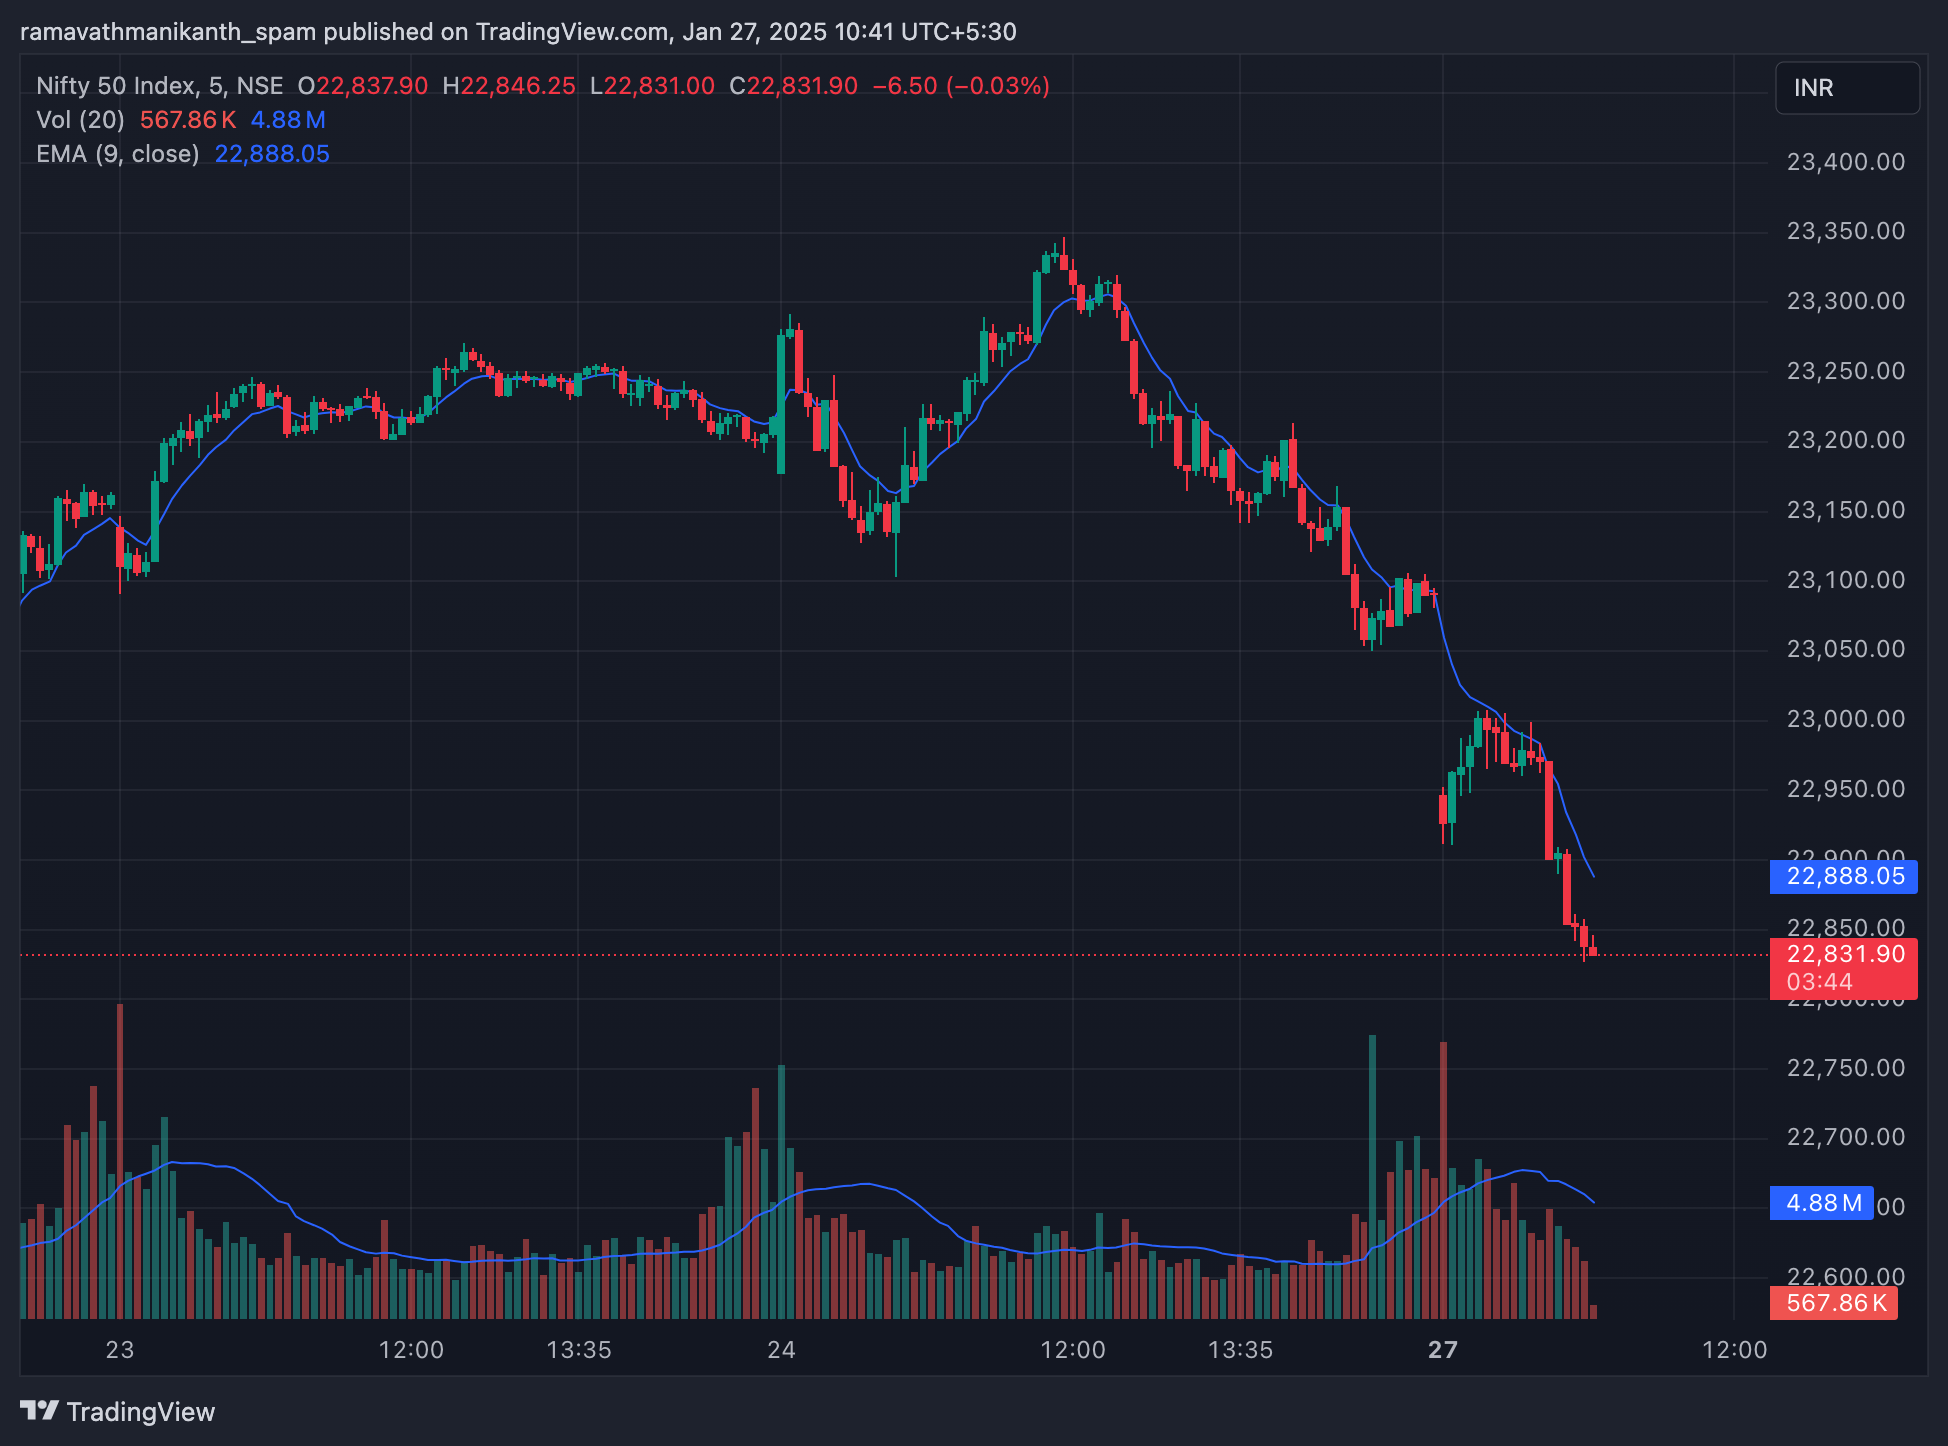
Here’s how EMA will look on the chart: it is the same as a simple moving average.
How is an EMA calculated?
The Exponential Moving Average (EMA) formula involves a weighted approach that gives more importance to recent prices compared to older ones. Here’s the formula:
EMA Formula:
EMA = (Current Price – Previous EMA) * (2 / (Number of Periods + 1)) + Previous EMA
- Closing Price = The price of the asset for the current period (e.g., today’s closing price or most recent price).
- Previous EMA = The Exponential Moving Average calculated for the previous period (e.g., yesterday’s EMA or the last available EMA).
- n = The number of periods over which the EMA is being calculated (e.g., 10, 20, or 50 days).
- Multiplier = A smoothing factor calculated as 2/(n+1)
Exponential Moving Average Calculation Example
|
Date |
January 16, 2025 |
January 15, 2025 |
January 14, 2025 |
January 13, 2025 |
January 10, 2025 |
|---|---|---|---|---|---|
|
Closing Price (₹) |
773.9 |
769.9 |
771 |
751.5 |
787.95 |
The first step is to calculate the simple moving average.
SMA=(773.90+769.90+771.00+751.50+787.95)/5=3854.25/5 = 770
calculate the multiplier Multiplier = 2/(5+1)=2/6 = 0.3333
The first EMA is 770.85 (used as the starting EMA).
EMA of January 13, 2025:
EMA=(751.50−770.85)×0.3333+770.85 EMA=(−19.35)×0.3333+770.85=−6.45+770.85=764.40
EMA = (-19.35) × 0.3333 + 770.85 = -6.45 + 770.85 = 764.40
EMA=(−19.35)×0.3333+770.85=−6.45+770.85=764.40
How EMA Works in Technical Analysis?
The Exponential Moving Average (EMA) is like a trend detector in the stock market. Focusing more on recent prices, it helps traders quickly spot whether a stock is trending up or down. Let’s see how EMA works in stock market analysis:
Identifying Trends
The Exponential Moving Average (EMA) helps you understand the direction of a stock’s movement by reducing the impact of daily price changes and focusing on the overall trend.
- Uptrend: If the stock price is mostly above the EMA, it means the stock is moving up, showing strong buying interest.
- Downtrend: If the stock price is mostly below the EMA, it means the stock is moving down, showing selling pressure.
Support and Resistance Levels
The Exponential Moving Average (EMA) often acts as a dynamic support or resistance line during strong market trends:
Dynamic Resistance in a Downtrend:
In a downtrend, the EMA can act like a “ceiling” where the price struggles to break above the EMA and continues downward. This indicates that selling pressure is keeping the price low.
Dynamic Support in an Uptrend:
When a stock is in an uptrend, the EMA can act like a “floor” where the price bounces back up after touching or nearing the EMA. This shows that buyers are stepping in to keep the price moving upward.
In the above chart of Infosys 9-EMA, exactly like support in an uptrend.
What is the Objective of EMA?
The primary objective of the Exponential Moving Average is to help traders understand the overall direction of the market by analysing past price data.
EMA is used to identify trends, whether a stock is moving upward or downward, and to confirm changes in market direction. It smooths out short-term price fluctuations, making it easier to focus on the broader trend.
It also helps traders make better decisions by providing signals for entry and exit, but it is important to note that EMA is a lagging indicator. This means it cannot predict future price movements; it only reflects trends based on past data.
In simple terms, EMA helps traders track trends, confirm momentum, and make informed trading decisions, but not predict the future.
How to Use the Exponential Moving Average Strategy?
The EMA is not just a trend indicator; it’s also a handy tool for building trading strategies. By combining it with other indicators or patterns, traders can make smarter buy and sell decisions.
EMA Combined With Other Indicators:
The EMA is often combined with other indicators like RSI (Relative Strength Index) or MACD (Moving Average Convergence Divergence) to confirm trends and strengthen trading decisions.
The EMA shows the overall trend, while indicators like RSI help check if the stock is overbought or oversold, and MACD signals momentum changes.
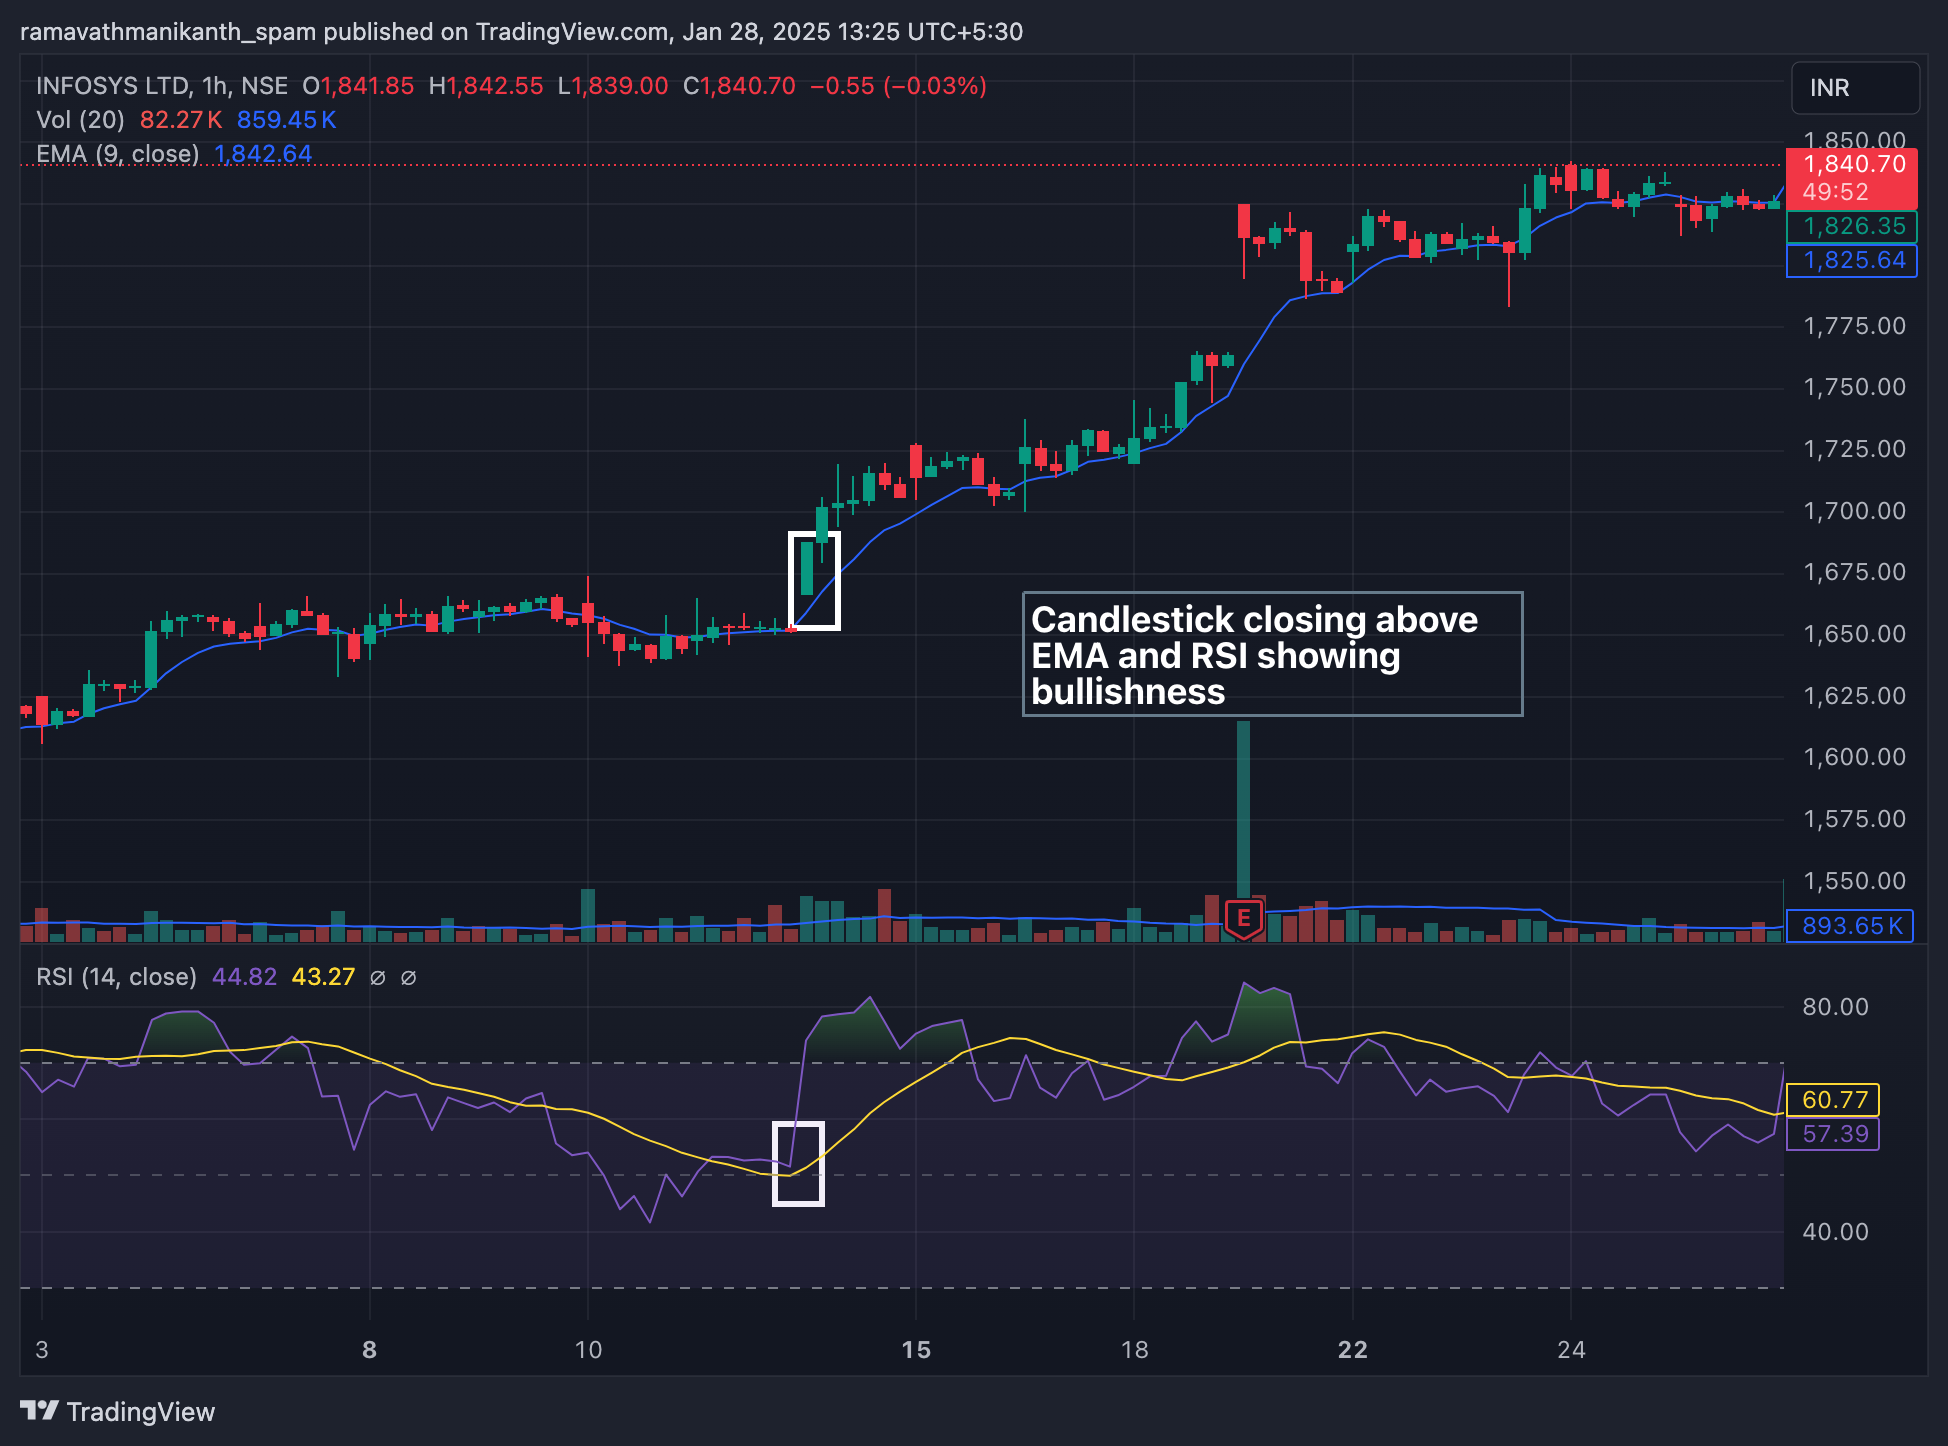
If the price is above the EMA (uptrend) and RSI or MACD also support a bullish signal, it’s a strong confirmation to consider buying. Similarly, in a downtrend, these combinations can confirm selling opportunities.
[Image]
In the Infosys chart above, the price is closing above the EMA, and the RSI is below 60, indicating bullishness. Combining EMA with other indicators helps traders enter and exit the market.
How to Choose the Right EMA Period for Your Trading Strategy?
Selecting the right EMA period depends on your trading style, goals, and the time horizon you are working with. Since the Exponential Moving Average reacts quickly to price changes, shorter EMAs capture trends faster but may also create more noise, while longer EMAs provide smoother signals but react more slowly.
|
Trading Style |
Common EMA Periods |
Why Traders Use It |
Practical Use |
|---|---|---|---|
|
Short-Term (Intraday & Swing Trading) |
9-day, 12-day, 20-day |
Captures quick price momentum; reacts faster to changes |
Acts as dynamic support/resistance; helps in quick entry/exit points |
|
Medium-Term (Position Trading) |
50-day, 100-day |
Balances responsiveness with smoother signals |
Tracks broader market trends over weeks |
|
Long-Term (Investing) |
200-day |
Most widely used globally; signals long-term market direction |
Price above 200 EMA = uptrend; below 200 EMA = downtrend |
|
Multiple EMAs (Crossovers) |
e.g., 20 EMA + 50 EMA |
Confirms trend strength and reversals |
Bullish crossover = buy signal; Bearish crossover = sell signal |
EMA vs. SMA
The distinctions between SMA and EMA are essential for choosing the right moving average based on your trading style, as each reacts differently to price changes and market volatility.
|
Factor |
Simple Moving Average (SMA) |
Exponential Moving Average (EMA) |
|---|---|---|
|
Calculation |
Averages closing prices over a set period with equal weight to each price |
Gives more weight to recent prices, reacting faster to new data |
|
Responsiveness |
Slower to respond to price changes |
Faster response to recent price movements |
|
Best Use |
Identifying long-term trends and smoothing out volatility |
Capturing short-term trends and quicker signals for trading |
|
Signal Sensitivity |
Less sensitive, fewer false signals |
More sensitive, may produce more false signals in choppy markets |
|
Lag |
Higher lag due to equal weighting |
Lower lag due to emphasis on recent prices |
|
Ideal For |
Long-term investors or trend confirmation |
Active traders and short-term strategies |
|
Example |
50-day SMA showing a steady upward trend in a stock over months |
20-day EMA signalling a quick reversal for short-term trading |
Advantages and Limitations of EMA
Advantages of EMA
The Exponential Moving Average (EMA) is widely used because it reacts quickly to price movements and helps traders identify trends effectively.
- Helps Identify and Confirm Trends
EMA makes it easier to understand market direction. When the EMA is moving upward, it indicates an uptrend, and when it moves downward, it signals a downtrend. This helps traders identify potential buy and sell opportunities. - Acts as Dynamic Support and Resistance
EMA often behaves like a moving support or resistance level. In an uptrend, it can act as a support (floor), while in a downtrend, it can act as resistance (ceiling), helping traders plan entry and exit points. - Responds Quickly to Price Changes
Since EMA gives more weight to recent prices, it reacts faster than SMA. This makes it useful for identifying short-term trends and capturing early market movements.
Limitations of EMA
Despite its advantages, EMA also has certain limitations that traders should consider.
- Higher Chances of False Signals
Because EMA is highly sensitive to recent price changes, it may generate more false signals, especially in sideways or volatile markets. - Overemphasis on Recent Data
EMA focuses more on the latest prices, which may ignore broader historical trends and lead to misleading conclusions. - Not Fully Reliable Alone
Like all technical indicators, EMA should not be used in isolation. Traders often combine it with other indicators to confirm signals and improve accuracy.
How to Backtest EMA Strategies?
Backtesting an EMA strategy involves applying the Exponential Moving Average to historical price data to see how it would have performed in real market conditions. This helps traders evaluate potential profits, losses, and overall effectiveness before committing real capital. By backtesting, you can refine your strategy, choose optimal EMA periods, and understand the risk-reward profile of trades.
Example: Suppose you want to test a 20-day EMA crossover strategy on a stock like Reliance Industries over the past year:
- Buy Signal: When the daily closing price crosses above the 20-day EMA.
- Sell Signal: When the daily closing price crosses below the 20-day EMA.
Using historical data:
- If the stock crossed above the EMA on March 5 at ₹2,800 and crossed below on March 20 at ₹3,000, the trade would have yielded ₹200 per share.
- By repeating this across the year, you can calculate overall profit, win rate, and drawdowns, helping refine the strategy or adjust the EMA period for better results.
TradingView Sample Code:
//@version=5
strategy(“20-Day EMA Crossover Backtest”, overlay=true, initial_capital=100000, default_qty_type=strategy.percent_of_equity, default_qty_value=10)
// Input for EMA period
emaPeriod = input.int(20, “EMA Period”)
// Calculate EMA
emaValue = ta.ema(close, emaPeriod)
// Plot EMA on chart
plot(emaValue, color=color.orange, title=”20-Day EMA”)
// Buy signal: price crosses above EMA
if ta.crossover(close, emaValue)
strategy.entry(“Buy”, strategy.long)
// Sell signal: price crosses below EMA
if ta.crossunder(close, emaValue)
strategy.close(“Buy”)
This script calculates the 20-day EMA, triggers a buy trade when the price crosses above the EMA, and closes the trade when the price crosses below. Running it on any stock chart in TradingView shows historical performance, helping traders make data-driven decisions
Conclusion
The Exponential Moving Average (EMA) is a powerful tool for stock market analysis, helping traders and investors identify trends, assess momentum, and make informed decisions. By giving more weight to recent prices, EMA responds quickly to market changes, making it ideal for tracking short-term and long-term trends. It helps determine whether a stock is in an uptrend or a downtrend and acts as dynamic support or resistance during strong market movements.
Traders often use EMA alongside other technical indicators like RSI or MACD to confirm trends and improve the accuracy of their strategies. This combination reduces the chances of false signals and provides a clearer picture of the market. Whether you’re identifying trends, planning entries or exits, or analysing support and resistance levels, EMA remains an essential tool for effective stock market trading and analysis.
Frequently Asked Questions (FAQs)
What is a good exponential moving average?
A good EMA depends on your trading goals. For short-term trading, 9-day or 20-day EMAs work well, while 50-day or 200-day EMAs are better for long-term trends.
What does 20 EMA crossing 50 EMA mean?
When the 20 EMA crosses above the 50 EMA, it signals a possible uptrend (bullish). If the 20 EMA crosses below the 50 EMA, it indicates a downtrend (bearish).
Which is better, EMA or SMA?
EMA is better for spotting quick changes as it gives more weight to recent prices, while SMA is slower and better for a broader view of trends. It depends on your trading style.
Disclaimer: This content is for educational purposes only and does not constitute financial or investment advice. Investments in securities or other financial instruments are subject to market risk, including partial or total loss of capital. Past performance is not indicative of future results. Always consider your financial situation carefully and consult a licensed financial advisor before making investment or trading decisions.
Table of Content
- Key Takeaways
- What Is an Exponential Moving Average?
- How is an EMA calculated?
- How EMA Works in Technical Analysis?
- What is the Objective of EMA?
- How to Use the Exponential Moving Average Strategy?
- How to Choose the Right EMA Period for Your Trading Strategy?
- EMA vs. SMA
- Advantages and Limitations of EMA
- How to Backtest EMA Strategies?
- Conclusion
- Frequently Asked Questions (FAQs)
Engineered for the obsessed. Built for traders.

Purpose-built terminals.
Zero compromise.
Built for speed.
Plot No 1290, 2nd Floor, 17th Cross, 5th Main, Sector-7, HSR Layout, Bangalore 560102
Follow us on
Mintcap Brokers Private Limited
CIN – U66110KA2023PTC178706 | Registered Address: Plot No 1290, Second Floor, 17th Cross, 5th Main, Sector-7, HSR Layout, Bangalore 560102 | Tel: 080 – 49552310 | Email ID: compliance@capmint.com | SEBI registered Stock Broker: INZ000322732 | NSE Cash/F&O Member ID: 90430 | BSE Cash/F&O Member ID: 6903 | MCX Member ID: 57400 | NCDEX Member ID: 1312 | SEBI registered Depository Participant: IN-DP-806-2025 | CDSL DP ID: 12102300 | NSE Clearing Member code: M70108 | AMFI-Registered Mutual Fund Distributor: ARN-289109 (Valid upto 28-Feb-2027) | Category II Execution Only Platform : E6903
Details of Client Bank Account
Compliance Officer: Ms. Shridevi Vungarala | Email ID: compliance@capmint.com | Tel no. + 91 9035330126 | Grievance Redressal Officer (GRO) – Ms. Shikha Gupta | Email ID: Grievance@capmint.com | Tel no: 9035331595.
Procedure to file a complaint on SEBI SCORES: Register on SCORES portal. Mandatory details for filing complaints on SCORES: Name, PAN, Address, Mobile Number, E-mail ID. Benefits: Effective Communication, Speedy redressal of the grievances. You may refer the website https://scores.sebi.gov.in/ for more information. You may also download the SEBI Scores app to log a complaint Android: https://play.google.com > store > apps > sebiscores iOS: https://apps.apple.com > app > sebiscores
Disclaimer
Investment in the securities market are subject to market risks, read all the related documents carefully before investing. Brokerage will not exceed the SEBI prescribed limit.
Mutual fund investments are subject to market risks, read all scheme related documents carefully before investing. Mutual Funds are not exchange-traded products.
Attention Investor:
- Stock Brokers can accept securities as margin from clients only by way of pledge in the depository system w.e.f. September 1, 2020.
- Update your mobile number & email Id with your stock broker/depository participant and receive OTP directly from depository on your email id and/or mobile number to create pledge.
- Pay 20% as upfront margin of the transaction value to trade in cash market segment.
- Investors may please refer to the Exchange’s Frequently Asked Questions (FAQs) issued vide circular reference NSE/INSP/45191 dated July 31, 2020 and NSE/INSP/45534 dated August 31, 2020 and other guidelines issued from time to time in this regard.
- Check your Securities /MF/ Bonds in the consolidated account statement issued by NSDL/CDSL every month.