
Link copied!
Average Directional Index (ADX)
The average directional index is a technical indicator that measures the strength of the ongoing trend, and it is applicable for all asset classes, stocks, forex, and commodities.
Key Takeaways
- ADX shows trend strength – The Average Directional Index (ADX) is a technical indicator that tells you how strong a market trend is, not whether it’s going up or down.
- ADX is based on +DI and -DI. – It works by using two directional indicators (+DI for upward strength and -DI for downward strength) and then smoothing their difference over 14 periods.
- ADX helps in real trading – Traders use ADX to confirm strong trends (usually when ADX is above 25), avoid sideways markets, and combine it with other indicators or price action to decide when to enter or exit trades.
- It has some limitations – ADX is a lagging indicator, which means it reacts after price changes happen. So, it’s best used with other tools like RSI or MACD to avoid false signals and improve accuracy.
What is the ADX Indicator?
The average directional index, also known as ADX, was developed by J. Welles Wilder. It is built using two other indicators: +DI and -DI. The +DI shows the strength of upward movement, while the -DI shows the strength of downward movement.
The ADX is a smoothed average of the difference between +DI and -DI over a 14-period timeframe. It tells us how strong the trend is, no matter the direction. If the ADX is rising, the trend is getting stronger. If the ADX is falling, it suggests the trend is losing strength or the market is moving sideways.
Formula And Example ADX
ADX measures how strong a trend is. It’s calculated using the expansion of price range over a set period, usually 14 bars by default, though other timeframes can also be used
How to Calculate ADX?
- Start by finding +DM (Positive Directional Movement) and -DM (Negative Directional Movement):
- +DM = Current High minus Previous High (only if it’s positive and larger than -DM)
-DM = Previous Low minus Current Low (only if it’s positive and larger than +DM)
Use +DM when the upward movement (current high – previous high) is greater than the downward movement (previous low – current low). Use -DM when the downward movement is greater than the upward movement.
Calculate True Range (TR):
- TR is the greatest of the following three:
- Current High – Current Low
- The absolute value of Current High – Previous Close
- The absolute value of Current Low – Previous Close
Smooth the 14-period averages of +DM, -DM, and TR; it is nothing but a calculation of previous averages.
First, calculate the sum(smoothing) of the first 14 readings of TR, +DM, and -DM. This gives the initial smoothed values.
To find the next smoothed value, use this formula:
- Next 14th day TR = Previous 14TR – (Previous 14TR / 14) + Current TR
- Apply the same formula to +DM and -DM.
Calculate +DI and -DI:
- +DI = (Smoothed +DM / Smoothed TR) * 100
- -DI = (Smoothed -DM / Smoothed TR) * 100
Calculate Directional Movement Index (DMI):
- DMI = (|+DI – -DI|) / (+DI + -DI) * 100
Calculate ADX:
- First, average the DMI values over 14 periods to get the initial ADX value.
- To continue, use the formula:
- ADX = ((Previous ADX * 13) + Current DMI) / 14
ADX calculation is complex, but many platforms provide pre-calculated ADX, which can be used and traded. Here is how ADX will look on the chart.
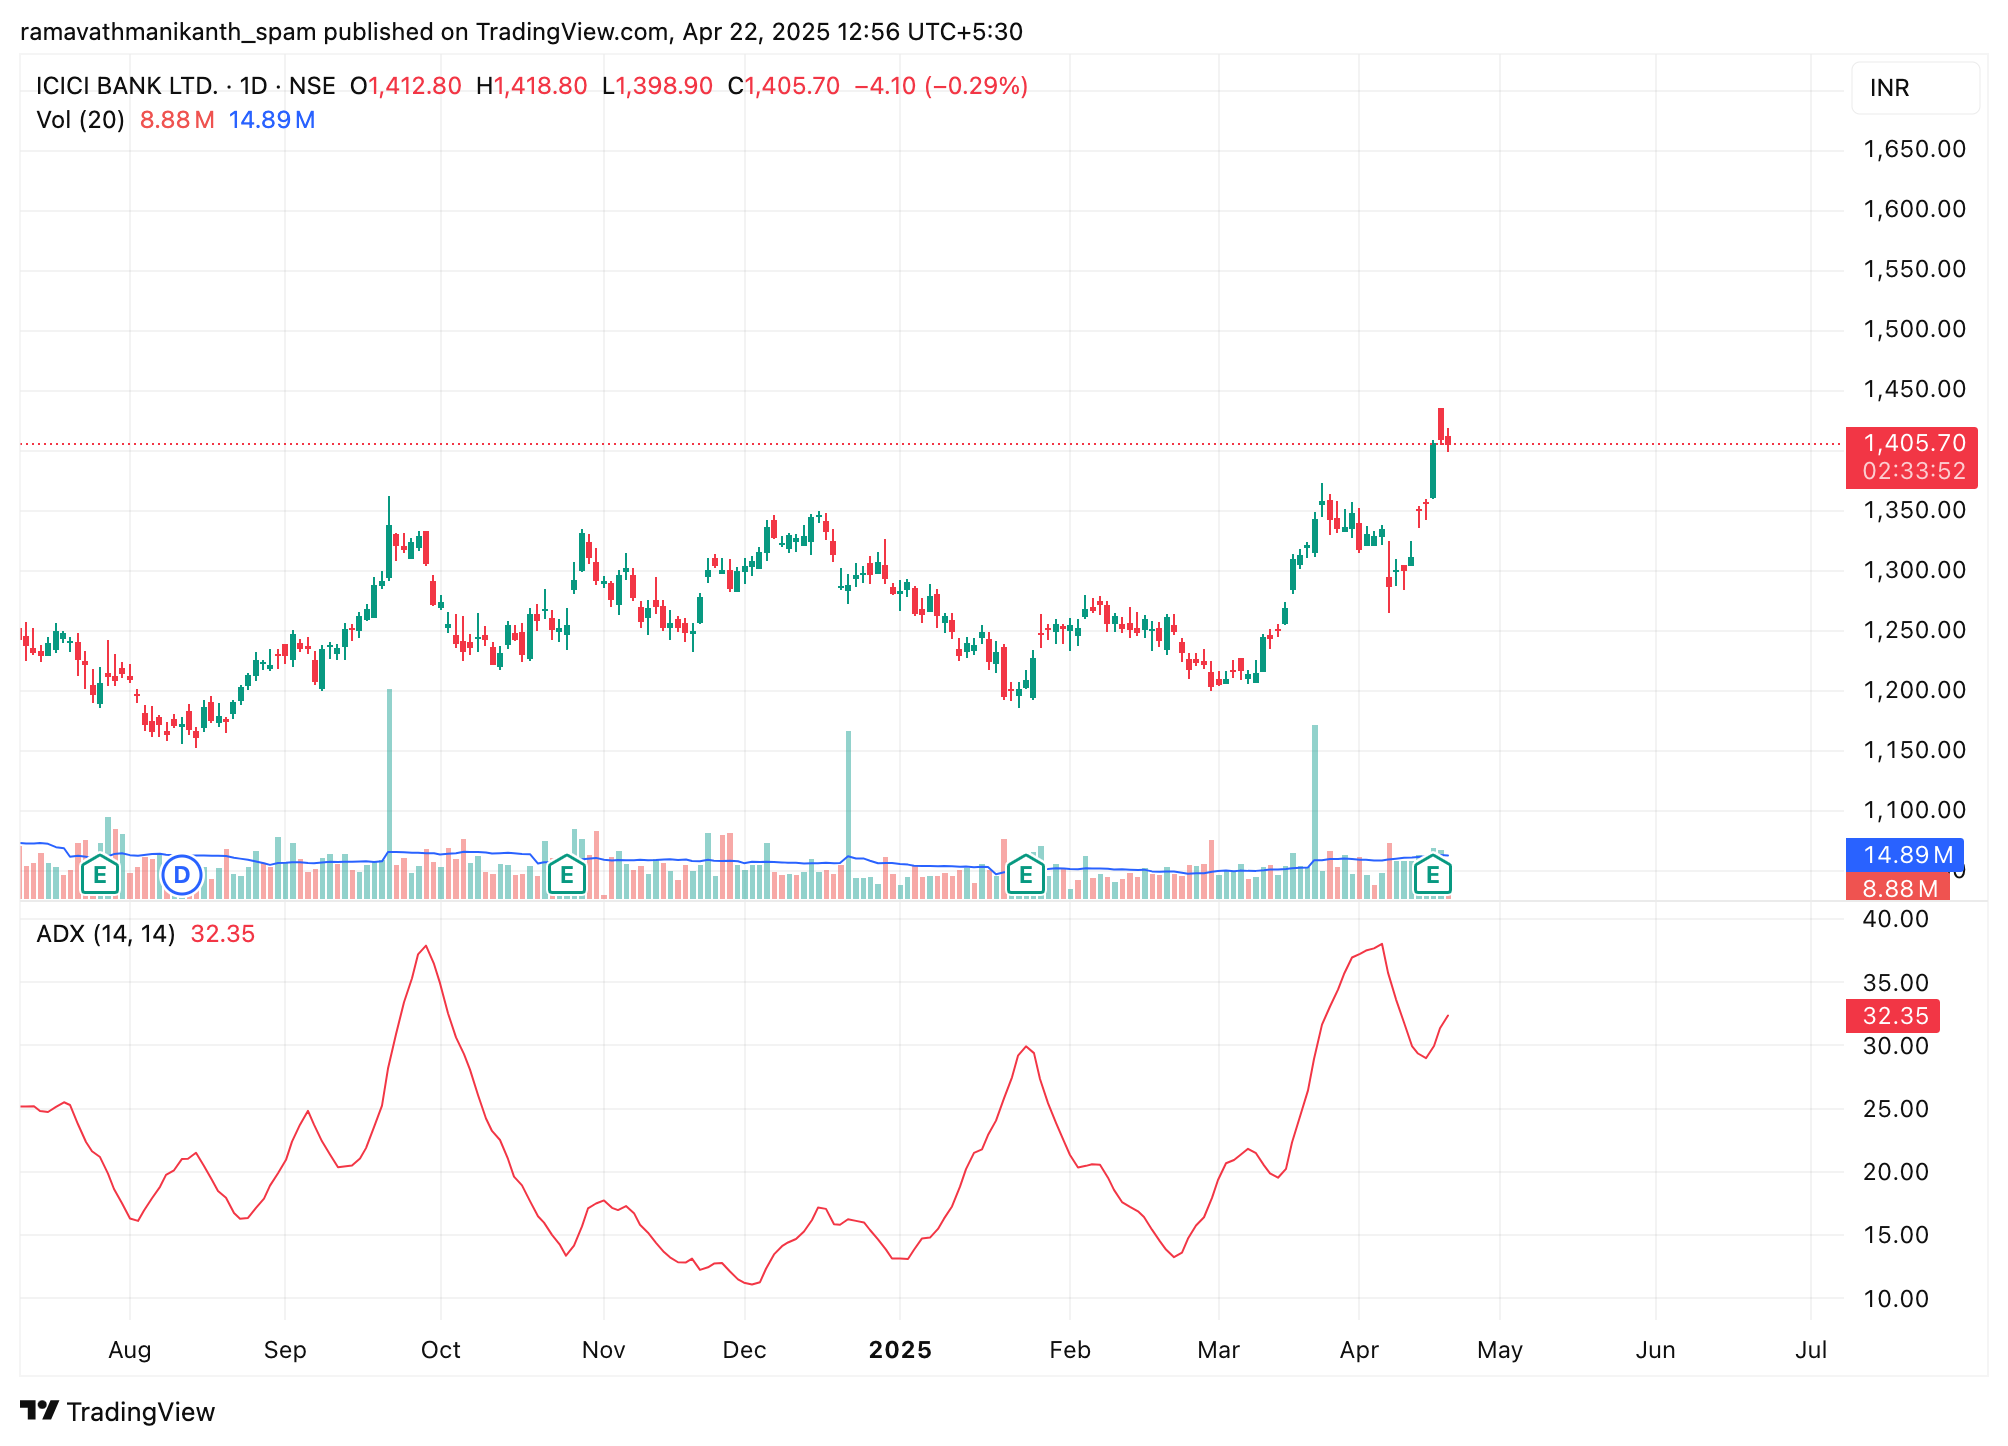
Interpretation Of ADX Values
The ADX is a momentum indicator that shows how strong a trend is. If the ADX is rising, it means the trend, whether upward or downward, is gaining strength. If the ADX is falling, it indicates that the trend is losing momentum.
The ADX value ranges from 0 to 100. Here’s a simple breakdown of what the values typically mean:
|
ADX Value Between |
Trend Strength |
|---|---|
|
0-25 |
Non-trending market or a range-bound market |
|
25-50 |
Strong trend |
|
50-75 |
Very strong trend |
|
75-100 |
Extremely strong trend (rarely happens and can be considered unsustainable) |
How To Use the ADX Indicator in Trading?
Now that we know ADX shows the strength of a trend, let’s see how traders use it in real market situations to make better trading decisions.
Trend Confirmation
Traders often use ADX along with price action or moving averages to confirm whether a trend is strong enough to trade. For example, if ADX is above 25, it usually means the trend has enough strength. This helps traders confidently follow the trend using strategies like buying in an uptrend or selling in a downtrend.
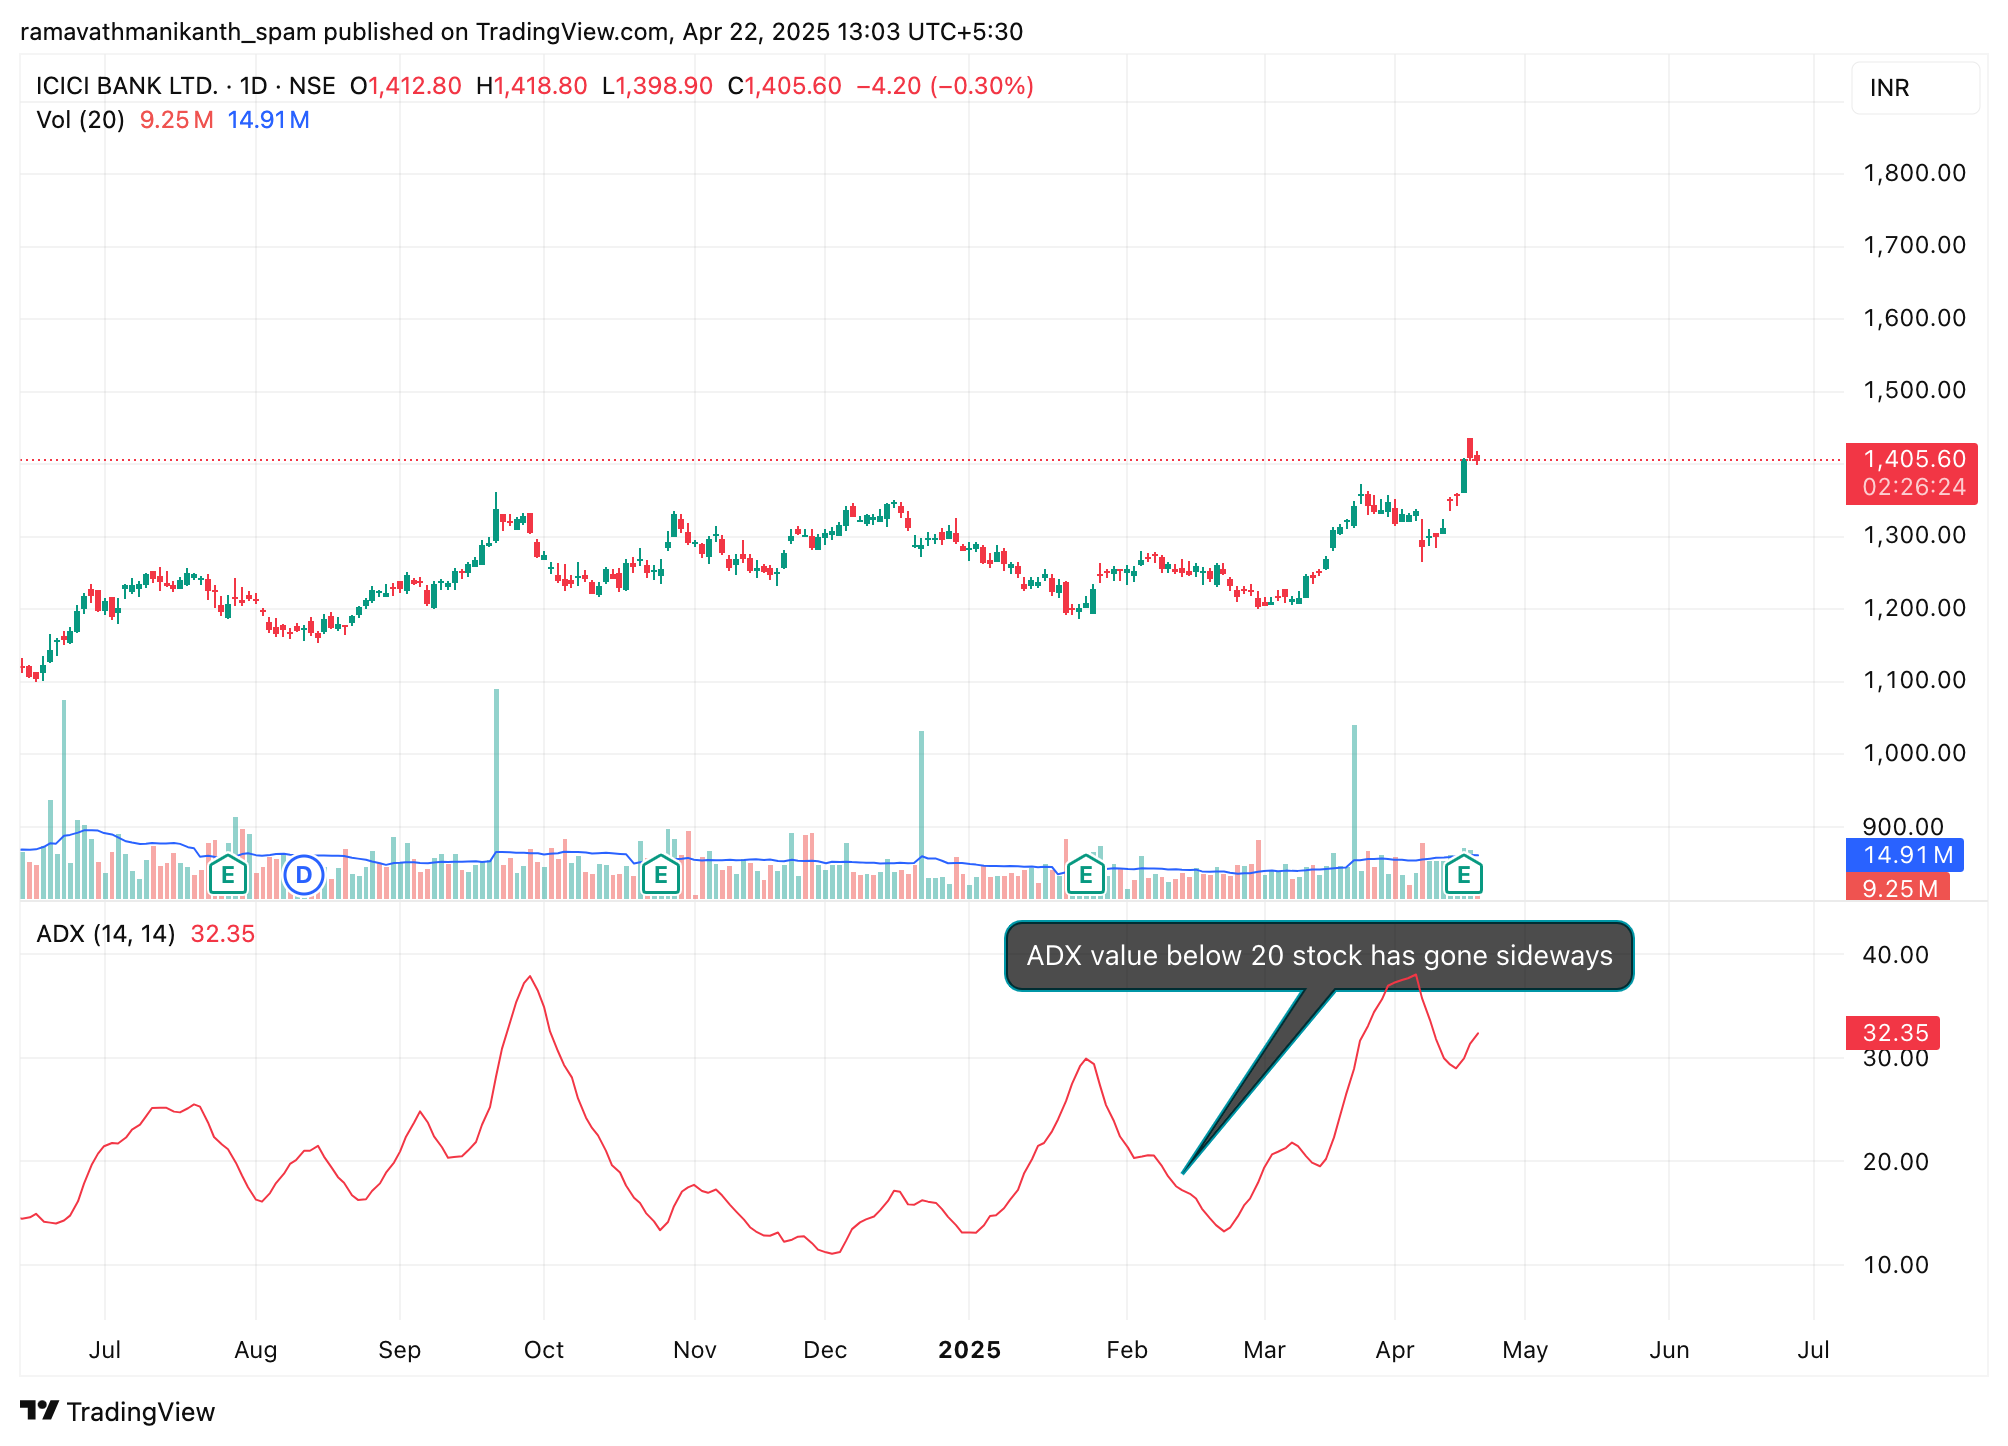
Avoiding Whipsaws
When the ADX is below 20, it signals a weak or no trend, meaning the market is likely moving sideways. Traders use this as a cue to stay out of the market during such periods, helping them avoid false signals and unnecessary losses in choppy, non-directional moves.
Using +DI and –DI Crossovers
ADX becomes even more useful when combined with directional indicators +DI and -DI. These crossovers can act as potential buy or sell signals:
- A buy signal occurs when +DI crosses above -DI and the ADX is rising, showing that an uptrend is gaining strength.
- A sell signal occurs when -DI crosses above +DI and the ADX is rising, indicating a strengthening downtrend.
For more reliable trades, many traders wait for the ADX to be above 25 before acting on these crossovers, as it confirms that the trend has enough momentum behind it.
Advantages and Disadvantages of the ADX Indicator
Advantages of ADX
- Measures trend strength clearly – ADX helps traders understand whether a trend is strong enough to trade, regardless of direction.
- Works across markets – It can be applied to stocks, forex, commodities, and other asset classes, making it versatile.
- Helps avoid sideways markets – Low ADX values signal weak or range-bound conditions, helping traders stay out of choppy trades.
- Supports better decision-making – When combined with indicators like RSI or moving averages, ADX improves trade confirmation and timing.
Disadvantages of ADX
- Lagging indicator – ADX is based on past price data, so it may react late to new trends or sudden market changes.
- No direction indication – It only shows trend strength, not whether the market is going up or down, requiring additional indicators.
- False signals in volatile markets – During news-driven or highly volatile conditions, ADX may give misleading signals.
- Needs confirmation – Relying solely on ADX can be risky; it works best when used alongside other tools.
If you look closely, ADX is less of a “decision-maker” and more of a “filter”—great for telling you when to trade, but not what trade to take.
Limitations of ADX
While ADX is a valuable tool, it’s important to be aware of its limitations:
- It is a lagging indicator, meaning it relies on past price data and may react late to sudden market changes.
- In highly volatile or news-driven markets, ADX can give false signals or whipsaws, leading to poor trade entries or exits.
- For better accuracy, it’s often used along with other indicators like RSI, MACD, or moving averages to confirm trends and avoid misleading signals.
Conclusion
The Average Directional Index (ADX) is a useful indicator for understanding how strong a trend is in any market—stocks, forex, or commodities. It doesn’t tell you the direction of the trend but helps you know whether the trend is worth trading. A rising ADX shows growing momentum, while a falling ADX signals that the trend is losing strength. This makes it a helpful tool for both trend-following and avoiding sideways markets.
However, since ADX is based on past data, it may sometimes react slowly to sudden changes in price. That’s why it works best when used with other indicators like RSI or MACD to confirm trading decisions. While the calculation of ADX can be complex, most trading platforms automatically provide it on the chart. Understanding how to read and apply ADX can help traders make smarter decisions and manage risk better in different market conditions.
Frequently Asked Questions (FAQs)
What is a good ADX score?
A good ADX score is above 25, which means the market has a strong trend. Below 20 usually means the market is sideways or weak.
Is ADX good for day trading?
Yes, ADX can be useful for day trading, especially to avoid choppy markets. But it should be used with other indicators to get better entry and exit points.
How to use the ADX indicator?
Use ADX to check trend strength.
- If ADX is rising, the trend is getting stronger
- Combine ADX with +DI and -DI crossovers for buy/sell signals.
- Many traders look for ADX > 25 to confirm trend trades.
Which is better, RSI or ADX?
Neither is strictly better; it depends on the use case. RSI identifies overbought/oversold conditions and potential reversals, while ADX measures trend strength. Use RSI in ranging markets and ADX in trending markets. Many traders combine both for more accurate signals.
Disclaimer: This content is for educational purposes only and does not constitute financial or investment advice. Investments in securities or other financial instruments are subject to market risk, including partial or total loss of capital. Past performance is not indicative of future results. Always consider your financial situation carefully and consult a licensed financial advisor before making investment or trading decisions.
Engineered for the obsessed. Built for traders.

Purpose-built terminals.
Zero compromise.
Built for speed.
Plot No 1290, 2nd Floor, 17th Cross, 5th Main, Sector-7, HSR Layout, Bangalore 560102
Follow us on
Mintcap Brokers Private Limited
CIN – U66110KA2023PTC178706 | Registered Address: Plot No 1290, Second Floor, 17th Cross, 5th Main, Sector-7, HSR Layout, Bangalore 560102 | Tel: 080 – 49552310 | Email ID: compliance@capmint.com | SEBI registered Stock Broker: INZ000322732 | NSE Cash/F&O Member ID: 90430 | BSE Cash/F&O Member ID: 6903 | MCX Member ID: 57400 | NCDEX Member ID: 1312 | SEBI registered Depository Participant: IN-DP-806-2025 | CDSL DP ID: 12102300 | NSE Clearing Member code: M70108 | AMFI-Registered Mutual Fund Distributor: ARN-289109 (Valid upto 28-Feb-2027) | Category II Execution Only Platform : E6903
Details of Client Bank Account
Compliance Officer: Ms. Shridevi Vungarala | Email ID: compliance@capmint.com | Tel no. + 91 9035330126 | Grievance Redressal Officer (GRO) – Ms. Shikha Gupta | Email ID: Grievance@capmint.com | Tel no: 9035331595.
Procedure to file a complaint on SEBI SCORES: Register on SCORES portal. Mandatory details for filing complaints on SCORES: Name, PAN, Address, Mobile Number, E-mail ID. Benefits: Effective Communication, Speedy redressal of the grievances. You may refer the website https://scores.sebi.gov.in/ for more information. You may also download the SEBI Scores app to log a complaint Android: https://play.google.com > store > apps > sebiscores iOS: https://apps.apple.com > app > sebiscores
Disclaimer
Investment in the securities market are subject to market risks, read all the related documents carefully before investing. Brokerage will not exceed the SEBI prescribed limit.
Mutual fund investments are subject to market risks, read all scheme related documents carefully before investing. Mutual Funds are not exchange-traded products.
Attention Investor:
- Stock Brokers can accept securities as margin from clients only by way of pledge in the depository system w.e.f. September 1, 2020.
- Update your mobile number & email Id with your stock broker/depository participant and receive OTP directly from depository on your email id and/or mobile number to create pledge.
- Pay 20% as upfront margin of the transaction value to trade in cash market segment.
- Investors may please refer to the Exchange’s Frequently Asked Questions (FAQs) issued vide circular reference NSE/INSP/45191 dated July 31, 2020 and NSE/INSP/45534 dated August 31, 2020 and other guidelines issued from time to time in this regard.
- Check your Securities /MF/ Bonds in the consolidated account statement issued by NSDL/CDSL every month.