
Table of Content
- Key Takeaways
- What is the Evening Star Pattern?
- How Do You Define an Evening Star?
- Components of the Evening Star Pattern
- Psychology Behind the Pattern
- How to Trade the Evening Star Candlestick Pattern
- Confirming the Pattern
- Evening Star vs Morning Star
- Advantages of the Evening Star Pattern
- Limitations of the Evening Star Pattern
- Conclusion
- Frequently Asked Questions (FAQs)
Link copied!
Evening Star Pattern
The Evening Star is a bearish reversal candlestick pattern that typically appears at the top of an uptrend. It signals that the bullish momentum may be weakening, and a potential downtrend could begin.
Key Takeaways
- The Evening Star consists of three candles: a strong bullish candle, a small-bodied candle (showing indecision), and a strong bearish candle. It typically forms at the top of an uptrend, indicating a potential reversal.
- The pattern reflects a psychological shift from bullish optimism to bearish control. Sellers start to dominate after a period of buying strength and hesitation, signalling that the uptrend might be losing steam.
- The Evening Star becomes more powerful when confirmed by high volume, bearish RSI divergence, or formation near resistance zones. These tools reduce the chances of false signals.
- Traders often enter short positions after the third candle closes below the midpoint of the first candle. Stop-loss is ideally placed above the second candle’s high, and profit targets can be based on support levels, Fibonacci retracement, or risk-reward ratios.
What is the Evening Star Pattern?
The Evening Star pattern is a three-candlestick bearish reversal pattern that typically forms at the top of an uptrend. It indicates a slowdown in bullish momentum and hints at a possible transition to a downtrend. In contrast to the Morning Star, which signals the dawn of a new bullish phase, the Evening Star represents the “dusk” or beginning of bearish dominance.
This pattern is regarded for its reliability, especially when confirmed by volume, resistance levels, or technical indicators. On daily charts of liquid Indian stocks, a well-formed Evening Star after a sustained rally of five or more sessions tends to precede at least a few days of corrective price action, though the depth and duration of the reversal depend on the broader market environment and where the pattern forms relative to key technical levels.
How Do You Define an Evening Star?
In the realm of candlestick patterns, few are as visually clear in predicting market reversals as the Evening Star. Acting as the bearish counterpart to the Morning Star, the Evening Star signals that an uptrend may be reaching exhaustion, and that sellers might soon take control. Identifying this pattern can provide a useful edge in catching trend reversals before the broader market confirms the shift.
The pattern derives its name from the evening star in astronomy, the first star visible at dusk, signalling the end of daylight. In the same way, the candlestick pattern signals the potential end of a bullish “day” in the market and the approach of a bearish “night.”
Components of the Evening Star Pattern
The Evening Star is made up of three candles, each telling a story about the tug-of-war between buyers and sellers.
Let’s understand each of the 3 candles and their significance in detail now:
1. First Candle: Bullish Momentum in Full Swing
This is a tall green candlestick that reflects strong buying interest. It usually appears after a healthy uptrend and shows that bulls are confidently pushing prices higher. The size of this candle relative to recent price action matters. A first candle with a body that is at least 1.5 times the stock’s average daily range signals genuine bullish conviction, establishing the baseline from which the reversal will unfold. A smaller first candle weakens the pattern’s significance because it suggests the uptrend was already losing momentum before the formation even began.
2. Second Candle: Pause and Indecision
The next candle is small-bodied; it could be a Doji, spinning top, or a short red/green candle. This candle often opens with a gap up, creating a visual space from the previous candle. It suggests that although bulls managed to push the price up at the open, they couldn’t sustain the momentum. Buyers are starting to hesitate, and sellers are beginning to emerge.
On Indian exchanges, the gap-up between the first and second candle is often modest, typically 0.2–0.5% on Nifty 50 stocks, rather than the dramatic gaps shown in textbook illustrations. The pattern remains valid as long as the second candle’s body is visibly smaller than the first and reflects a clear loss of bullish momentum. If the second candle is a Doji (open and close nearly identical), the indecision signal is even stronger, and the variant is sometimes called an “Evening Doji Star,” which is generally considered a more potent bearish signal.
3. Third Candle: Bears Take Control
The final candle is a large red candlestick that opens lower and closes deep into the body of the first candle, ideally below its midpoint. This sharp drop shows a power shift, where sellers come in aggressively, overpowering the buyers and hinting that the uptrend might be over.
The depth of penetration into the first candle’s body is the primary quality indicator. A third candle that closes below the midpoint of the first candle’s body is the minimum threshold. A third candle that closes below the first candle’s open (fully erasing the first day’s gains) represents a stronger variant with more reliable follow-through. Additionally, a third candle that closes near its session low, with little or no lower shadow, suggests that selling pressure persisted right until the close, which tends to carry over into the next session.
Psychology Behind the Pattern
To fully appreciate the Evening Star pattern, it helps to think of it as a story unfolding over three sessions, a story about changing sentiment in the market:
Day 1: Bullish Confidence
The session opens and closes strongly in the green, showing that buyers are in full control. The mood is optimistic, and the uptrend feels intact. Traders are buying, confident that prices will keep rising. This confidence is often strongest after four or more consecutive green candles, when the uptrend has become so consistent that caution feels unnecessary. Ironically, this is precisely when the conditions for a reversal pattern are most ripe.
Day 2: A Telling Pause
The market opens even higher, creating a gap up. But then the price doesn’t move much from there. A small-bodied candle forms, often resembling a Doji or spinning top. This signals hesitation. Bulls are no longer pushing aggressively, and sellers are starting to test the waters. It’s the first visible crack in the trend’s armour.
One behavioural detail worth noting: the second candle’s gap-up open often attracts the last wave of retail buyers who chase the move, only to see the price stall during the session. This trapped buying, where participants enter near the session high and watch the price go nowhere, sets the stage for the selling that follows on day three, as these late buyers become early sellers when their positions move against them the next morning.
Day 3: The Shift to Bearish Sentiment
The next day opens lower and keeps dropping. The red candle that forms closes deep into the body of the bullish Day 1 candle. This reveals that the bears have seized control. What was once bullish excitement gives way to concern and active selling. If the selling accelerates in the final 60–90 minutes of the session, it often indicates institutional distribution rather than routine profit-booking, and the follow-through into subsequent sessions tends to be stronger.
How to Trade the Evening Star Candlestick Pattern
Once you’ve identified the Evening Star pattern on a chart, the next step is to plan your trade carefully. Here’s a clear, step-by-step method to help you execute it effectively.
Entry Points
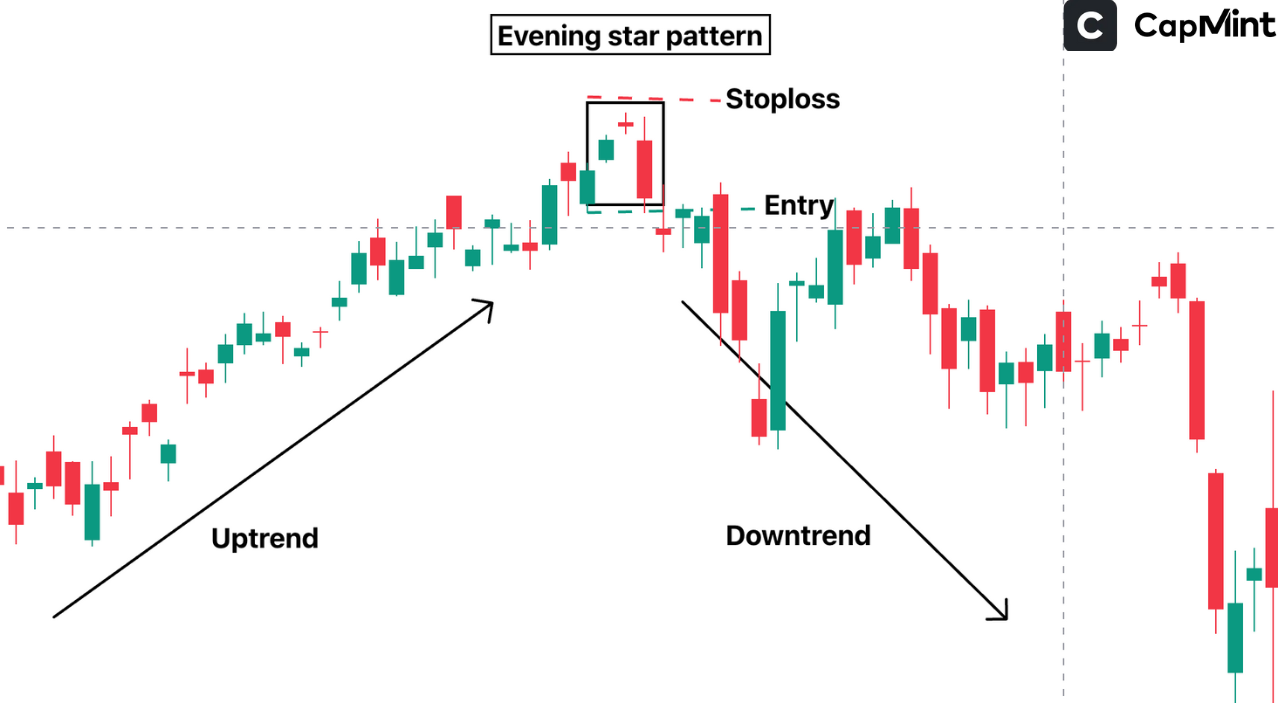
Enter a short position after the third candle closes below the midpoint of the first bullish candle. Conservative traders may wait for additional confirmation through volume spikes or technical indicators.
The most straightforward entry is at the open of the fourth session, after the three-candle pattern has fully formed and the third candle’s close is confirmed. Entering during the third candle’s session carries the risk that the candle’s final close may be less bearish than anticipated, potentially invalidating the pattern. However, waiting for the fourth session does mean entering at a lower price (for short trades), so the stop-loss distance from the second candle’s high may be wider. Calculating the risk-reward ratio before entering helps ensure the setup still offers a favourable payoff even with the later entry.
In strongly bearish follow-throughs, the fourth session can gap down at the open, making the entry significantly worse than the third candle’s close. This is a recurring trade-off with confirmation-based entries on bearish patterns, where downside moves tend to develop faster than upside reversals.
Stop-Loss Placement
Place the stop-loss above the high of the second (indecision) candle. This protects your position in case the pattern fails and the uptrend continues.
The second candle’s high represents the peak of the pattern, the highest point reached during the indecision phase. If the price breaks above this level, the reversal thesis is invalidated. On stocks where the second candle has a long upper shadow, the stop-loss distance can become uncomfortably wide. In such cases, reducing position size to keep the absolute risk within planned limits is a better approach than tightening the stop to an arbitrary level that may get triggered by normal price fluctuation.
Profit Targets
When it comes to booking profits after spotting the Evening Star, there are a few practical approaches:
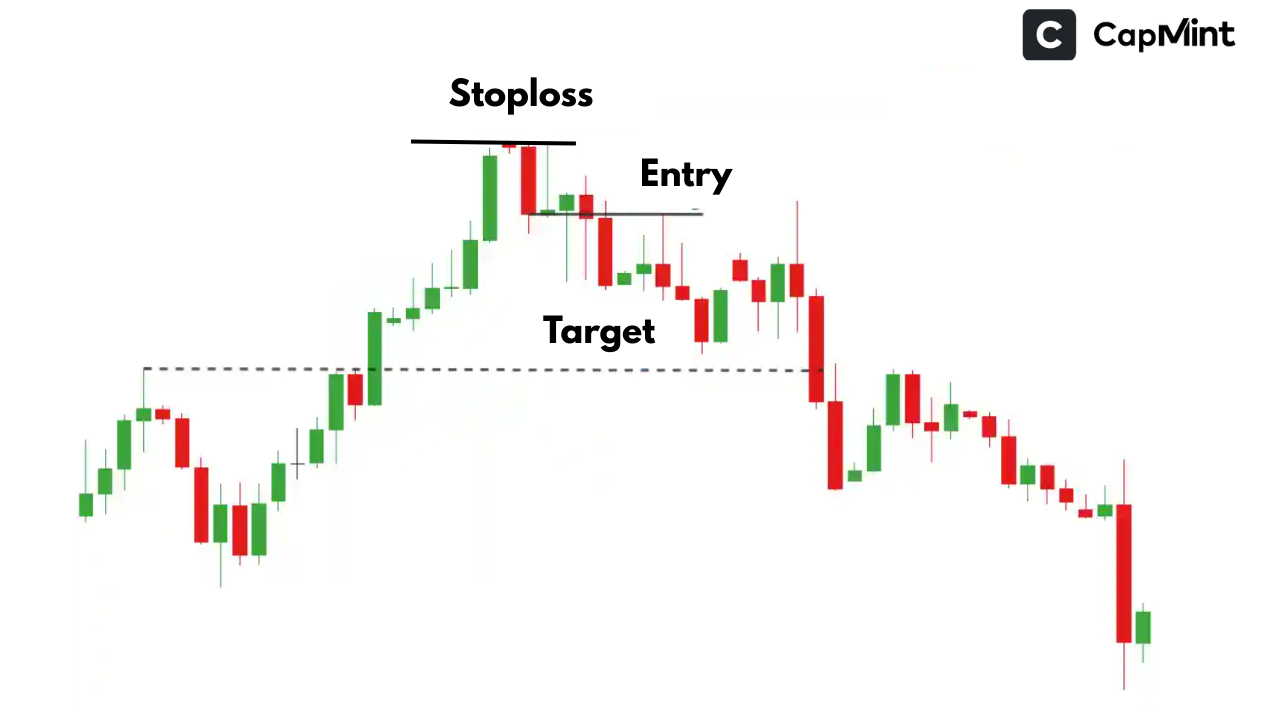
Support levels: Look for key support areas where the price previously bounced, and use them as target zones. The nearest horizontal support level, such as a prior swing low or a consolidation zone from the preceding uptrend, serves as the most natural first target.
Fibonacci retracement: Applying Fibonacci retracement levels to the preceding upswing can map out potential reversal points. The 38.2% and 50% retracement levels are commonly used as initial and secondary targets, respectively.
Risk-reward ratios: Set a predefined ratio like 1:2 or 1:3, meaning if your stop-loss is ₹10 away, aim for ₹20 or ₹30 in profits. Before entering, verify that the nearest support level is far enough from your entry to achieve at least a 1:2 ratio. If the stop is ₹15 above the entry but the nearest support is only ₹10 below, the risk-reward arithmetic doesn’t support the trade, regardless of how textbook the pattern looks.
Confirming the Pattern
To make your Evening Star trades more reliable, combining the pattern with other technical tools that help confirm the reversal is a practical approach. Here’s how each one helps:
Volume Analysis
Look for a spike in volume on the third candle, the strong bearish one. A surge in volume means there’s heavy selling interest, which confirms that the bears aren’t just making a brief appearance; they’re taking control. A useful benchmark is to check whether volume on the third candle is at least 1.5 times the 10-day average volume. Conversely, an Evening Star with below-average volume on the third candle, while visually matching the pattern, suggests the reversal may lack conviction and is more prone to failure.
Ideally, the volume profile across the three candles should show moderate or high volume on the first candle, declining volume on the second (reflecting reduced participation during the indecision phase), and a volume spike on the third. This progression from active buying to hesitation to aggressive selling mirrors exactly what the pattern is meant to signal.
RSI (Relative Strength Index)
If the RSI is in overbought territory, above 70, or if it shows a bearish divergence (price makes a higher high but RSI makes a lower high), it tells you that bullish momentum is fading even though prices are still rising, which lines up precisely with what the Evening Star is signalling. An RSI that is already at 72–80 when the Evening Star forms suggests the stock is statistically stretched to the upside, making a pullback more probable.
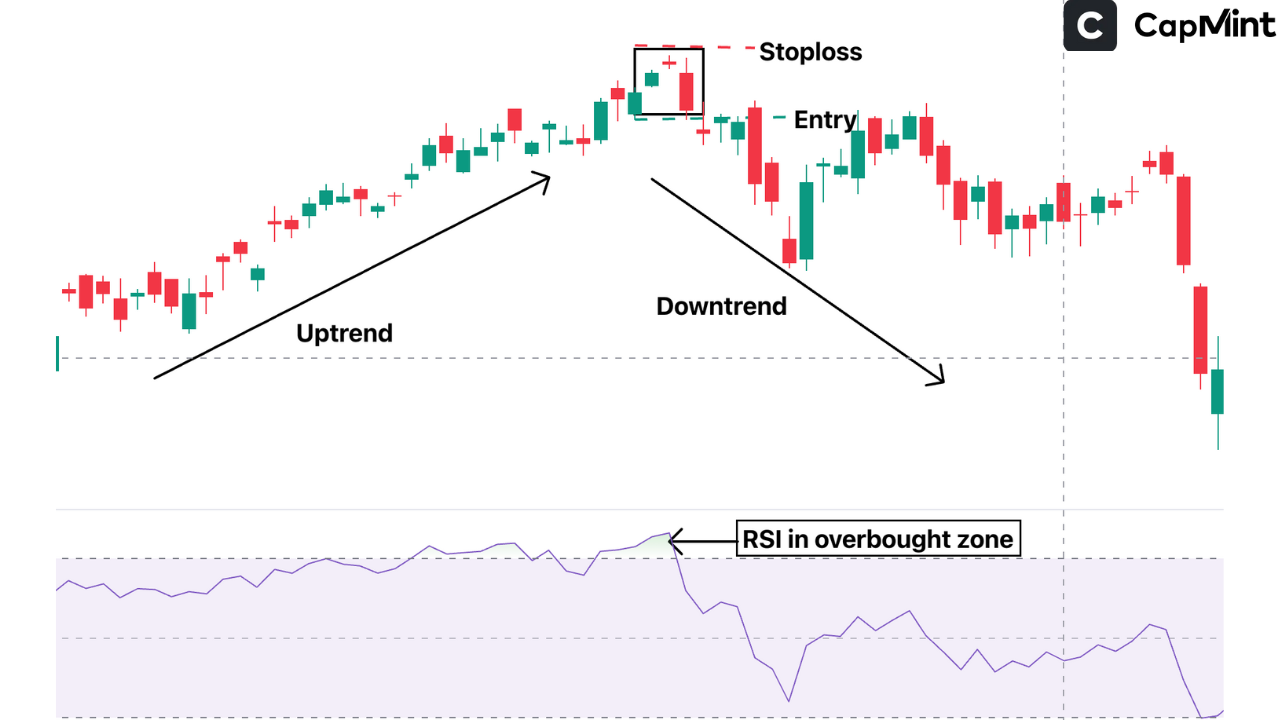
Bearish RSI divergence developing over the week or two preceding the Evening Star is a particularly strong combination. The divergence signals weakening momentum at the broader level, and the Evening Star provides the specific candlestick trigger for entering the trade.
Resistance Zones
If the pattern forms near a well-known resistance level, such as a previous swing high, a round-number price level (₹500, ₹1,000, ₹2,000), or a Fibonacci extension level, it strengthens the bearish case considerably. Resistance is a zone where prices tend to face selling pressure, so seeing an Evening Star at that level suggests the uptrend is failing at a point where historical precedent already indicated it might struggle.
On Nifty 50 stocks, Evening Star patterns that form at or near prior all-time highs or within 1–2% of a well-tested resistance zone carry additional weight because these levels naturally attract profit-booking. The confluence of a candlestick reversal signal at a structural resistance level represents one of the higher-probability short setups available through technical analysis.
Evening Star vs Morning Star
|
Feature |
Evening Star |
Morning Star |
|---|---|---|
|
Appears at |
Top of an uptrend |
Bottom of a downtrend |
|
First Candle |
Long bullish (green) |
Long bearish (red) |
|
Second Candle |
Small body (indecision) |
Small body (indecision) |
|
Third Candle |
Long bearish (red) |
Long bullish (green) |
|
Signal |
Bearish reversal |
Bullish reversal |
|
Stop-Loss Placement |
Above the second candle’s high |
Below the second candle’s low |
Both patterns share the same three-candle structure and require the same type of confirmation. The key structural difference is context: the Evening Star forms after sustained buying and signals a shift to selling, while the Morning Star forms after sustained selling and signals a shift to buying. One practical observation: Evening Star patterns on Indian stocks tend to produce faster initial moves than Morning Stars. This is because selling pressure after a failed rally tends to accelerate quickly as trapped late buyers exit their positions, whereas buying after a decline often builds more gradually as confidence returns incrementally.
Advantages of the Evening Star Pattern
Early Warning of Reversal
This pattern often forms near the top of an uptrend, giving traders an early signal that the upward momentum might be weakening. Spotting this in time can help you exit long positions or prepare to go short before the broader market confirms the reversal. On stocks that go on to decline 8–12% after an Evening Star at resistance, the early entry means capturing a significant portion of the move rather than chasing it after the decline is well underway.
Works Across Markets and Timeframes
Whether you’re trading stocks, forex, or commodities, and whether you’re looking at a daily chart or a weekly one, this pattern can help you spot reversals across different market conditions. On higher timeframes, the pattern tends to produce more sustained reversals. A weekly Evening Star on a Nifty 50 stock, while rare, typically precedes a correction that lasts several weeks rather than a few days.
Visually Easy to Spot
The Evening Star has a very distinct shape made up of three candles, which makes it relatively simple to recognise, even for newer traders. You don’t need complex mathematical overlays; it’s identifiable by scanning through a candlestick chart systematically.
Limitations of the Evening Star Pattern
Can Give False Signals in Sideways Markets
If the market is moving sideways without a clear trend, the Evening Star might appear, but not lead to a meaningful downward move. In consolidating markets, three-candle sequences that visually resemble the Evening Star appear with some regularity, but without a genuine uptrend preceding the pattern, the psychological context that gives it predictive value is absent. Ensuring the stock has been in a sustained uptrend, not just a minor bounce within a range, before treating the pattern as actionable helps filter out these false formations.
Requires Confirmation for Reliability
While the pattern is visually strong, it’s not foolproof without additional confirmation. An Evening Star with below-average volume, no RSI divergence, and no nearby resistance level is a low-quality setup. The best setups combine the candlestick pattern with at least one confirming factor, whether that’s volume, an indicator reading, or a structural level, to reduce the probability of acting on a false signal.
Stop-Loss Can Be Wide
When the second candle has a long upper shadow or the gap between the first and second candles is large, the stop-loss (placed above the second candle’s high) can create a wide risk distance from the entry point. This can make the risk-reward ratio unfavourable unless the nearest support target is far enough below to compensate. In such cases, either reducing position size or waiting for a minor pullback before entering can improve the setup’s risk-reward profile.
Conclusion
The Evening Star is a visually distinct and psychologically meaningful candlestick pattern that provides traders with an early signal of potential trend reversals at market tops. When combined with confirmation tools like volume spikes, RSI divergence, or key resistance zones, the pattern can meaningfully improve trading decisions. Despite its strengths, traders should remain cautious in sideways markets and always apply disciplined risk management.
The highest-quality Evening Star setups tend to share several common characteristics: they form after a sustained multi-session rally, appear at or near a recognised resistance level, show a clear volume expansion on the third candle, and have a third candle that closes below the midpoint of the first candle’s body. When these elements align, the pattern provides a structured entry point for a bearish position with defined risk parameters and a clear invalidation level.
Frequently Asked Questions (FAQs)
What does the Evening Star candlestick pattern indicate?
The Evening Star is a bearish reversal pattern that typically forms at the top of an uptrend, indicating that bullish momentum is weakening and a potential downtrend may begin. It reflects a three-session psychological shift from confident buying to indecision to aggressive selling.
How do you identify a valid Evening Star pattern?
A valid Evening Star consists of three candles: a strong bullish candle, a small-bodied candle (like a Doji or spinning top) that shows indecision, and a strong bearish candle that closes deep into the body of the first candle, ideally below its midpoint. Confirmation with volume or resistance zones strengthens the signal. The pattern should also be preceded by a clear multi-session uptrend to carry genuine reversal significance.
Is the Evening Star chart pattern reliable for trading?
The Evening Star is considered a reliable bearish signal, especially when confirmed with volume spikes, RSI divergence, or formation near key resistance levels. However, its reliability diminishes in sideways markets without a clear preceding uptrend. On daily charts of liquid Indian stocks, a well-confirmed Evening Star at a meaningful resistance level has a reasonable probability of producing at least a short-term corrective move, though the magnitude varies with broader market conditions.
What timeframe works best for the Evening Star pattern?
The Evening Star pattern can be used on any timeframe from intraday to weekly charts. Higher timeframes typically offer more reliable signals with stronger follow-through. A daily chart Evening Star on a Nifty 50 stock carries more weight than the same pattern on a 15-minute chart, where market noise routinely creates three-candle sequences that resemble the pattern without leading to genuine trend changes. For most swing traders, the daily timeframe offers the best balance of signal reliability and trade frequency.
What is the difference between the Morning Star and Evening Star patterns?
The Morning Star is a bullish reversal pattern found at the bottom of a downtrend, while the Evening Star is a bearish reversal pattern that appears at the top of an uptrend. Both patterns consist of three candles and signal a shift in market sentiment, but in opposite directions. They require the same type of confirmation and risk management approach. One practical difference is that Evening Star reversals tend to produce faster initial moves because selling pressure after a failed rally typically accelerates more quickly than buying pressure after a decline.
Disclaimer: This content is for educational purposes only and does not constitute financial or investment advice. Investments in securities or other financial instruments are subject to market risk, including partial or total loss of capital. Past performance is not indicative of future results. Always consider your financial situation carefully and consult a licensed financial advisor before making investment or trading decisions.
Table of Content
- Key Takeaways
- What is the Evening Star Pattern?
- How Do You Define an Evening Star?
- Components of the Evening Star Pattern
- Psychology Behind the Pattern
- How to Trade the Evening Star Candlestick Pattern
- Confirming the Pattern
- Evening Star vs Morning Star
- Advantages of the Evening Star Pattern
- Limitations of the Evening Star Pattern
- Conclusion
- Frequently Asked Questions (FAQs)
Engineered for the obsessed. Built for traders.

Purpose-built terminals.
Zero compromise.
Built for speed.
Plot No 1290, 2nd Floor, 17th Cross, 5th Main, Sector-7, HSR Layout, Bangalore 560102
Follow us on
Mintcap Brokers Private Limited
CIN – U66110KA2023PTC178706 | Registered Address: Plot No 1290, Second Floor, 17th Cross, 5th Main, Sector-7, HSR Layout, Bangalore 560102 | Tel: 080 – 49552310 | Email ID: compliance@capmint.com | SEBI registered Stock Broker: INZ000322732 | NSE Cash/F&O Member ID: 90430 | BSE Cash/F&O Member ID: 6903 | MCX Member ID: 57400 | NCDEX Member ID: 1312 | SEBI registered Depository Participant: IN-DP-806-2025 | CDSL DP ID: 12102300 | NSE Clearing Member code: M70108 | AMFI-Registered Mutual Fund Distributor: ARN-289109 (Valid upto 28-Feb-2027) | Category II Execution Only Platform : E6903
Details of Client Bank Account
Compliance Officer: Ms. Shridevi Vungarala | Email ID: compliance@capmint.com | Tel no. + 91 9035330126 | Grievance Redressal Officer (GRO) – Ms. Shikha Gupta | Email ID: Grievance@capmint.com | Tel no: 9035331595.
Procedure to file a complaint on SEBI SCORES: Register on SCORES portal. Mandatory details for filing complaints on SCORES: Name, PAN, Address, Mobile Number, E-mail ID. Benefits: Effective Communication, Speedy redressal of the grievances. You may refer the website https://scores.sebi.gov.in/ for more information. You may also download the SEBI Scores app to log a complaint Android: https://play.google.com > store > apps > sebiscores iOS: https://apps.apple.com > app > sebiscores
Disclaimer
Investment in the securities market are subject to market risks, read all the related documents carefully before investing. Brokerage will not exceed the SEBI prescribed limit.
Mutual fund investments are subject to market risks, read all scheme related documents carefully before investing. Mutual Funds are not exchange-traded products.
Attention Investor:
- Stock Brokers can accept securities as margin from clients only by way of pledge in the depository system w.e.f. September 1, 2020.
- Update your mobile number & email Id with your stock broker/depository participant and receive OTP directly from depository on your email id and/or mobile number to create pledge.
- Pay 20% as upfront margin of the transaction value to trade in cash market segment.
- Investors may please refer to the Exchange’s Frequently Asked Questions (FAQs) issued vide circular reference NSE/INSP/45191 dated July 31, 2020 and NSE/INSP/45534 dated August 31, 2020 and other guidelines issued from time to time in this regard.
- Check your Securities /MF/ Bonds in the consolidated account statement issued by NSDL/CDSL every month.