
Link copied!
Candlestick Timeframe
A candlestick timeframe refers to the duration or time interval that each individual candlestick on a chart represents. It defines how much market price action is displayed in each candle.
Key Takeaways
- Timeframes show how long each candlestick covers: Longer timeframes give big-picture trends, while shorter ones offer more signals but with more noise. Choose based on how you like to trade.
- Match timeframes to your trading style and schedule: Long-term traders use weekly/monthly charts. Short-term and active traders use hourly or minute charts. Busy people should stick with longer timeframes.
- Your emotions matter too: Fast charts can feel stressful. If you panic easily, avoid short timeframes. If you enjoy quick decisions, shorter charts might suit your style better.
- Use multiple timeframes together: Spot the trend with weekly, confirm it with daily, and time your entry using hourly charts. This helps reduce mistakes and boosts confidence.
What are Candlestick Timeframes?
A candlestick timeframe refers to the amount of time each candle on a chart represents.
Example for Candlestick Timeframes:
- In a 1-minute chart, each candlestick represents 1 minute of trading activity.
- In a 1-hour chart, each candlestick represents 1 hour of trading data.
- In a daily chart, each candlestick represents one full trading day.
The timeframe affects how much detail you see and how often trading signals appear.
Types of Timeframes and Their Use
There are many types of timeframes, and each one of them is used for different strategies and for different analysis timeframes. Let’s try to understand each one of their use case, signals, and who is best for
Monthly Candlesticks
- Best For: Long-term investors and people who like to hold trades for months or even years.
- Signals: These candles don’t show up often, but when they do, they can give strong and reliable clues about big market trends.
- Use Case: Great for spotting major trends and key levels where prices might change direction. If you’re looking at the big picture, monthly candles are your friend.
Weekly Candlesticks
- Best For: Swing traders and long-term investors who want a mix of detail and clarity.
- Signals: These give a nice balance, not too many signals, but not too few either. They’re usually more accurate than shorter timeframes.
- Use Case: Useful for analysing trends that last a few weeks to a few months. They help confirm what you see on monthly charts and add more detail.
Daily Candlesticks
- Best For: Swing traders and short-term investors who want regular updates without too much noise.
- Signals: You’ll see more signals than on the weekly chart, and they’re easier to follow than lower timeframes.
- Use Case: Ideal for setting up trades that last from a few days to a couple of weeks. It’s a great starting point for most traders.
Hourly Candlesticks
- Best For: Traders who want to be more active, like day traders and fast-moving swing traders.
- Signals: These charts give more chances to enter or exit trades, but you have to act more quickly.
- Use Case: Good for finding short-term trade opportunities, especially for spotting quick reversals or breakouts in price.
30-Minute, 15-Minute, 5-Minute, and 1-Minute Candlesticks
- Best For: Intraday traders and scalpers who want to make multiple trades within a single day.
- Signals: Tons of signals show up, but they can be confusing and unpredictable.
- Use Case: Best for quick trades based on fast market moves, like during news events or high-volatility periods. Not recommended for beginners, as they can be overwhelming.
How to Choose the Right Timeframe?
Choosing the right candlestick timeframe depends on how you like to trade, how much time you can spend watching the market, and how you handle stress. Let’s break it down in a way that’s easy to follow:
1. Match It with Your Trading Style
- Long-Term Investing: If you prefer to buy and hold for months or years, use weekly or monthly charts. These charts move slowly, so you don’t have to check them every day. They show the big picture and help you focus on the overall direction of the market.
- Swing Trading: If you want to hold trades for a few days or weeks, go with daily or 4-hour charts. These give you enough information without overwhelming you. You can spot good entry points while still following larger market trends.
- Day Trading: If you want to open and close trades within the same day, use 1-hour, 15-minute, or 5-minute charts. These are fast and give lots of signals, but they also require you to be quick and alert throughout your trading session.
2. Think About Your Daily Schedule
- Busy Schedule: If you have a busy schedule, use longer timeframes like daily or weekly candles. You can check the charts once a day or even once a week. This works well if you have a full-time job or other commitments and can’t stare at screens all day.
- Flexible Schedule: If you have a lot of free time and can sit in front of your screen, shorter timeframes like 15-minute or 5-minute charts will give you more trading opportunities. You can react quickly and make more trades throughout the day.
3. Know Your Emotions
- Easily Stressed or Impatient: If you are someone who is easily stressed or impatient, avoid low timeframes. Fast-moving charts can cause panic or bad decisions. It’s easy to feel overwhelmed when prices change quickly and frequently.
- Enjoy Fast Action: If you like quick decisions and don’t mind the stress, you might enjoy shorter timeframes. Just be ready for quick moves and possible losses if things don’t go your way.
In the end, the best timeframe is the one that fits you, your goals, your lifestyle, and your comfort level. Once you find what works, stick to it and don’t keep jumping around. Consistency is key if you want to improve and grow as a trader.
You can also use multiple timeframes together to confirm the trend, support/trend and entry points. This could give me better conviction while entering a trade.
Multi-Timeframe Strategy
Let’s say you’re planning to trade a stock. Here’s how you can use three different timeframes together:
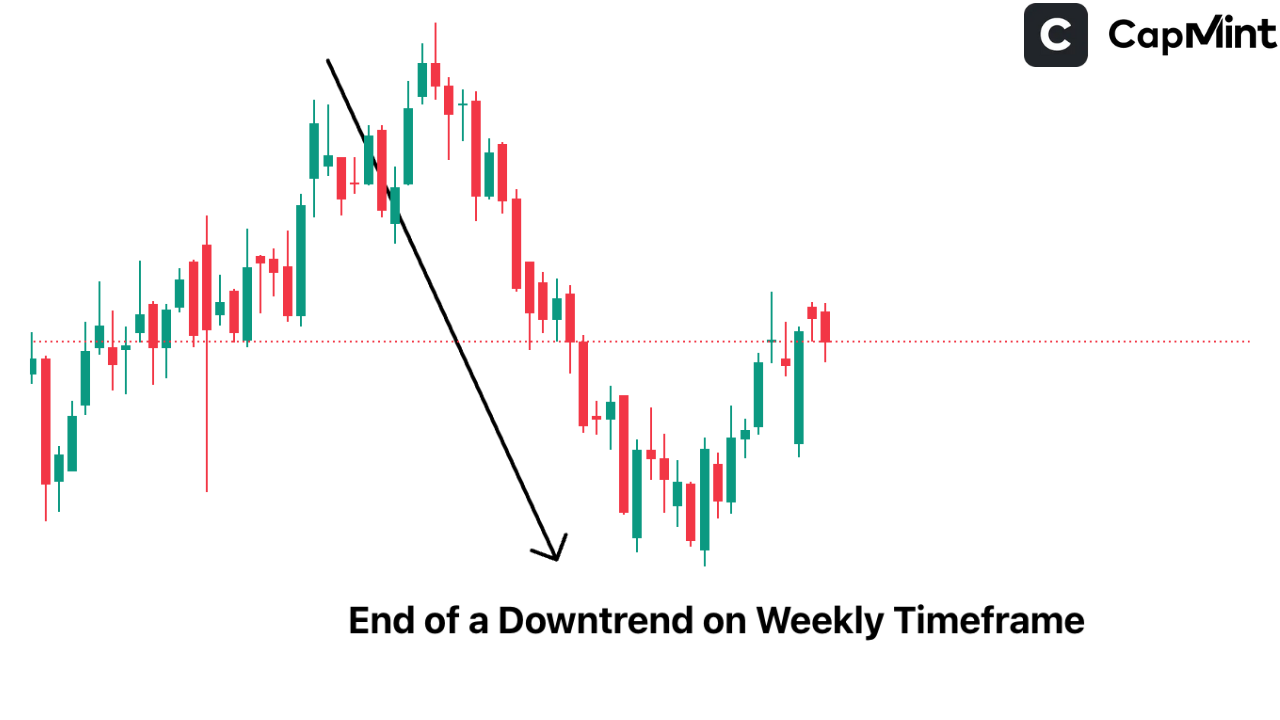
Step 1: Use the Weekly Chart
Look at the weekly chart to figure out the main direction of the market (uptrend or downtrend). This gives you a big-picture view of where prices might be heading in the long run.
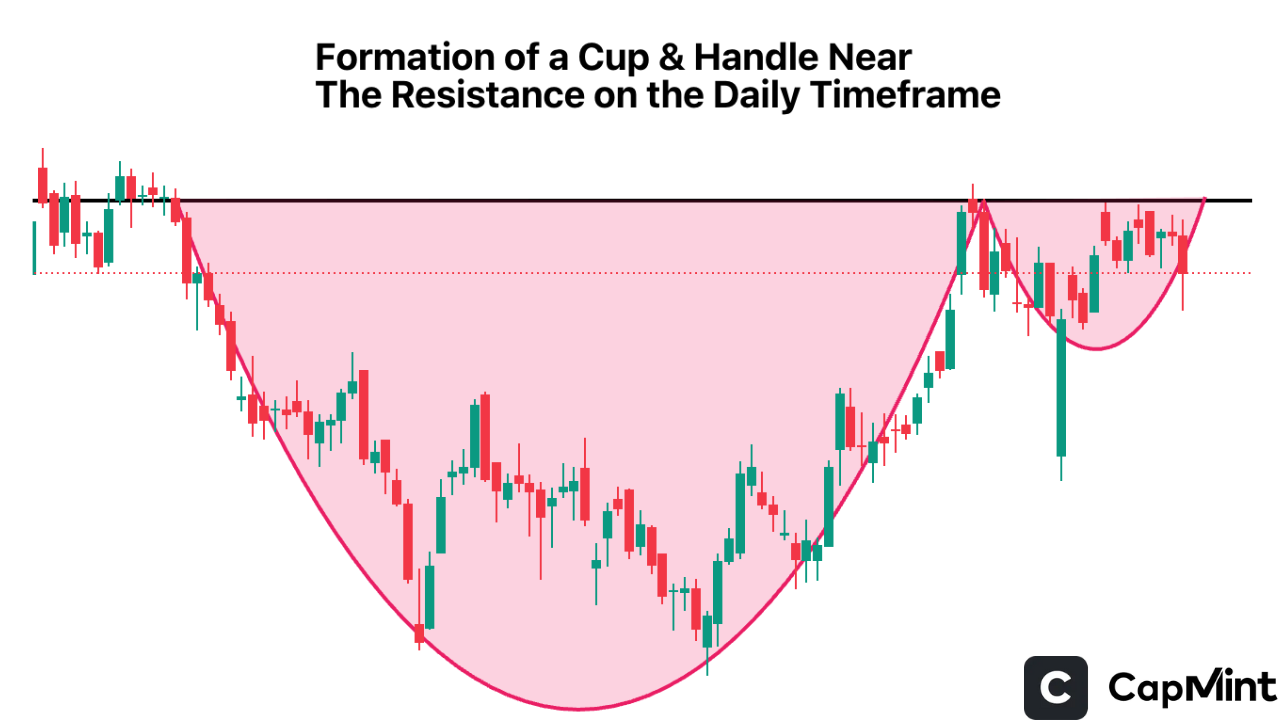
Step 2: Check the Daily Chart
Once you know the trend, zoom into the daily chart. This helps you spot patterns, candlestick signals, or support and resistance levels that line up with the trend you found on the weekly chart.
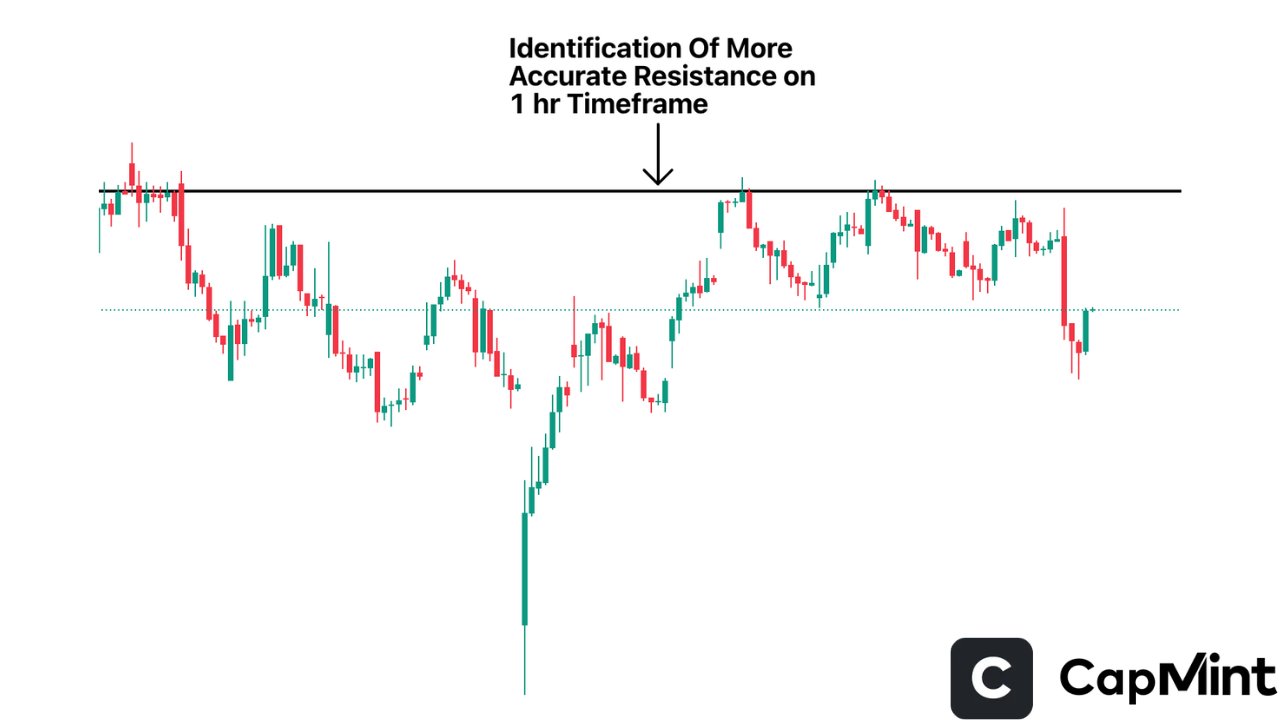
Step 3: Use the Hourly Chart
Finally, check the 1-hour chart to find the best time to enter your trade. Look for a good entry point when the price is pulling back or showing a reversal in your favour.
This step-by-step approach helps you make smarter trades by confirming your ideas across different timeframes. It lowers the chances of falling for false signals and gives you more confidence when entering or exiting a trade.
Conclusion
There’s no single “best” candlestick timeframe; it all depends on your trading style, how much time you can spend analysing charts, and your comfort with risk and speed. What matters most is consistency. Choose a timeframe that matches your personality and goals. Master it, trust your process, and use reliable tools like trendlines or indicators to confirm your moves. Remember, timeframes are just tools; they don’t guarantee success on their own. It’s how you use them, interpret the data, and stay disciplined that makes the biggest difference in your trading journey.
Frequently Asked Questions (FAQs)
Can I trade using just one timeframe?
Yes, but using multiple timeframes gives a clearer view of the market and helps avoid false signals. It improves decision-making and confirms your trading setup.
Which timeframe is best for beginners?
The daily chart is perfect for beginners. It’s easy to follow, less noisy than shorter charts, and gives enough signals to learn and grow confidently.
How often should I check the charts?
It depends on your timeframe. For daily candles, once a day is enough. For 5-minute charts, you’ll need to watch them constantly.
Do timeframes work the same in forex, stocks, and crypto?
Yes, candlestick timeframes work the same across all markets. The main difference is how fast prices move, especially in crypto or during news events.
What’s the biggest mistake with timeframes?
Jumping between too many charts and overtrading. It leads to confusion and bad decisions. Stick with one or two and keep your trading simple and focused
Is a 30-minute time frame good for trading?
Yes, a 30-minute timeframe is good for trading, especially for intraday and short-term traders. It provides a balance between noise and clarity, helping identify trends more reliably than lower timeframes while still offering multiple trading opportunities within a day.
Disclaimer: This content is for educational purposes only and does not constitute financial or investment advice. Investments in securities or other financial instruments are subject to market risk, including partial or total loss of capital. Past performance is not indicative of future results. Always consider your financial situation carefully and consult a licensed financial advisor before making investment or trading decisions.
Engineered for the obsessed. Built for traders.

Purpose-built terminals.
Zero compromise.
Built for speed.
Plot No 1290, 2nd Floor, 17th Cross, 5th Main, Sector-7, HSR Layout, Bangalore 560102
Follow us on
Mintcap Brokers Private Limited
CIN – U66110KA2023PTC178706 | Registered Address: Plot No 1290, Second Floor, 17th Cross, 5th Main, Sector-7, HSR Layout, Bangalore 560102 | Tel: 080 – 49552310 | Email ID: compliance@capmint.com | SEBI registered Stock Broker: INZ000322732 | NSE Cash/F&O Member ID: 90430 | BSE Cash/F&O Member ID: 6903 | MCX Member ID: 57400 | NCDEX Member ID: 1312 | SEBI registered Depository Participant: IN-DP-806-2025 | CDSL DP ID: 12102300 | NSE Clearing Member code: M70108 | AMFI-Registered Mutual Fund Distributor: ARN-289109 (Valid upto 28-Feb-2027) | Category II Execution Only Platform : E6903
Details of Client Bank Account
Compliance Officer: Ms. Shridevi Vungarala | Email ID: compliance@capmint.com | Tel no. + 91 9035330126 | Grievance Redressal Officer (GRO) – Ms. Shikha Gupta | Email ID: Grievance@capmint.com | Tel no: 9035331595.
Procedure to file a complaint on SEBI SCORES: Register on SCORES portal. Mandatory details for filing complaints on SCORES: Name, PAN, Address, Mobile Number, E-mail ID. Benefits: Effective Communication, Speedy redressal of the grievances. You may refer the website https://scores.sebi.gov.in/ for more information. You may also download the SEBI Scores app to log a complaint Android: https://play.google.com > store > apps > sebiscores iOS: https://apps.apple.com > app > sebiscores
Disclaimer
Investment in the securities market are subject to market risks, read all the related documents carefully before investing. Brokerage will not exceed the SEBI prescribed limit.
Mutual fund investments are subject to market risks, read all scheme related documents carefully before investing. Mutual Funds are not exchange-traded products.
Attention Investor:
- Stock Brokers can accept securities as margin from clients only by way of pledge in the depository system w.e.f. September 1, 2020.
- Update your mobile number & email Id with your stock broker/depository participant and receive OTP directly from depository on your email id and/or mobile number to create pledge.
- Pay 20% as upfront margin of the transaction value to trade in cash market segment.
- Investors may please refer to the Exchange’s Frequently Asked Questions (FAQs) issued vide circular reference NSE/INSP/45191 dated July 31, 2020 and NSE/INSP/45534 dated August 31, 2020 and other guidelines issued from time to time in this regard.
- Check your Securities /MF/ Bonds in the consolidated account statement issued by NSDL/CDSL every month.