
Table of Content
- Key Takeaways
- What are Candlestick Patterns?
- How to Read a Candlestick Pattern?
- Types Of Single Candlestick Patterns
- Multiple Candlestick Patterns
- Bullish and Bearish Reversal Patterns
- What is a Chart Pattern?
- What is Technical Analysis?
- How to Trade Candlestick Patterns?
- Conclusion
- Frequently Asked Questions (FAQs)
Link copied!
Candlestick Patterns
Candlestick patterns are formations created by one or more candlesticks that help traders understand market behaviour and predict possible price movements. These patterns are formed using the open, close, high, and low prices over a specific period.
Key Takeaways
- Candlestick patterns are chart formations created using price data (open, close, high, and low) to analyse market trends.
- There are single and multiple candlestick patterns. Single patterns like the doji and hammer show individual price behaviour, while multiple patterns like the morning star and engulfing pattern indicate stronger trend signals.
- Bullish patterns suggest a possible upward movement, while bearish patterns indicate a potential decline in price.
- Candlestick patterns help in understanding market psychology, but they should not be used alone. Traders should combine them with volume, trends, and other indicators for better accuracy.
What are Candlestick Patterns?
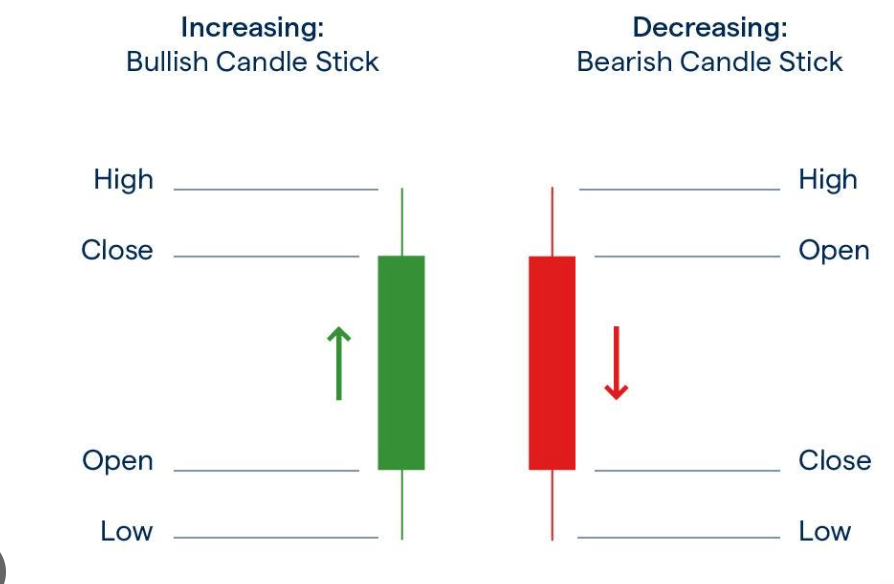
A Japanese rice trader invented candlestick patterns to analyse prices and market psychology by recognising trends in price movements. A candlestick has four key components: open, close, high, and low (OHLC) for a specific period. By plotting these for each period, traders create a financial chart that helps them make trading decisions.
There are two primary colours of candlesticks, which indicate whether the price has gone up or down.
Green/White Candle
The closing price is higher than the opening price, indicating a price increase.
Red/Black Candle
The closing price is lower than the opening price, indicating a price decrease.
How to Read a Candlestick Pattern?
Reading a candlestick pattern is all about understanding what buyers and sellers are doing during a specific time period. Each candlestick shows four key values: open, close, high, and low.
Start by looking at the body of the candle. A long body shows strong buying or selling pressure, while a small body indicates indecision.
Next, observe the wicks or shadows. Long wicks suggest that the price was rejected at certain levels, showing a struggle between buyers and sellers.
Also, pay attention to the colour of the candle. A green candle means the price closed higher (bullish), while a red candle means it closed lower (bearish).
Finally, analyse the pattern in context. A single candle is not enough—look at previous candles and the overall trend to confirm signals.
Types Of Single Candlestick Patterns
These candlesticks come in different patterns, each showing a unique price movement. Now, let’s look at the types of candlesticks.
Doji
A doji is a single candlestick pattern that represents market indecision. It has a very small body and long wicks, showing that both buyers and sellers were in a battle throughout the trading period. By the end, neither side could gain control, and the price closed near its opening level. The colour of the doji doesn’t matter because its body is too small to indicate a clear trend.
Also Read: Gravestone Doji.
Hammer
A hammer candlestick pattern appears at the end of a downtrend. The longer the lower shadow, the stronger the bullish signal. It forms when sellers push the price down, but buyers take control and push it back up, showing strong buying interest and a possible trend reversal.
One key detail to remember is the body-to-wick ratio. Ideally, the lower wick should be at least twice the length of the candlestick body. The colour of the hammer doesn’t matter much because its shape itself signals a potential reversal.
Also Read: Inverted Hammer Candlestick Pattern.
Shooting Star
A shooting star is a key candlestick pattern that signals a potential reversal at the peak of an uptrend. It forms when the price rises sharply during the session but then faces strong selling pressure, pushing it back down before the close. This suggests that buyers tried to drive the price higher but failed to sustain the momentum, allowing sellers to take control.
The most important feature of a shooting star is its long upper wick, which should be at least twice the size of the body. This wick reflects a rejection of higher prices, hinting that the trend could reverse. The colour of the candle is less important than its structure, as the pattern itself indicates weakness in the uptrend.
Multiple Candlestick Patterns
By analysing multiple candlesticks together, traders can identify stronger patterns that signal potential market movements. Now, let’s explore multiple candlestick patterns.
Morning Star
The morning star pattern is a three-candlestick pattern that signals a possible trend reversal from bearish to bullish. It appears after a downtrend and consists of three candles: a long red candle, a small-bodied candle (which can be red or green), and a long green candle. The small candle in the middle shows that selling pressure is slowing down, and the strong green candle confirms that buyers are taking control. This pattern suggests that the price may start moving upward.
Evening Star
The evening star pattern is a three-candlestick pattern that signals a potential reversal from bullish to bearish. It appears after an uptrend and consists of a long green candle, a small-bodied candle (which can be red or green), and a long red candle. The small candle in the middle indicates hesitation in the uptrend, and the strong red candle confirms that sellers are taking control. This pattern suggests that the price may start moving downward.
Three White Soldiers
The three white soldiers pattern is a strong bullish signal that appears after a downtrend. It consists of three consecutive long green candles, each opening within the previous candle’s body and closing higher. This pattern shows strong buying momentum and a possible trend reversal to the upside.
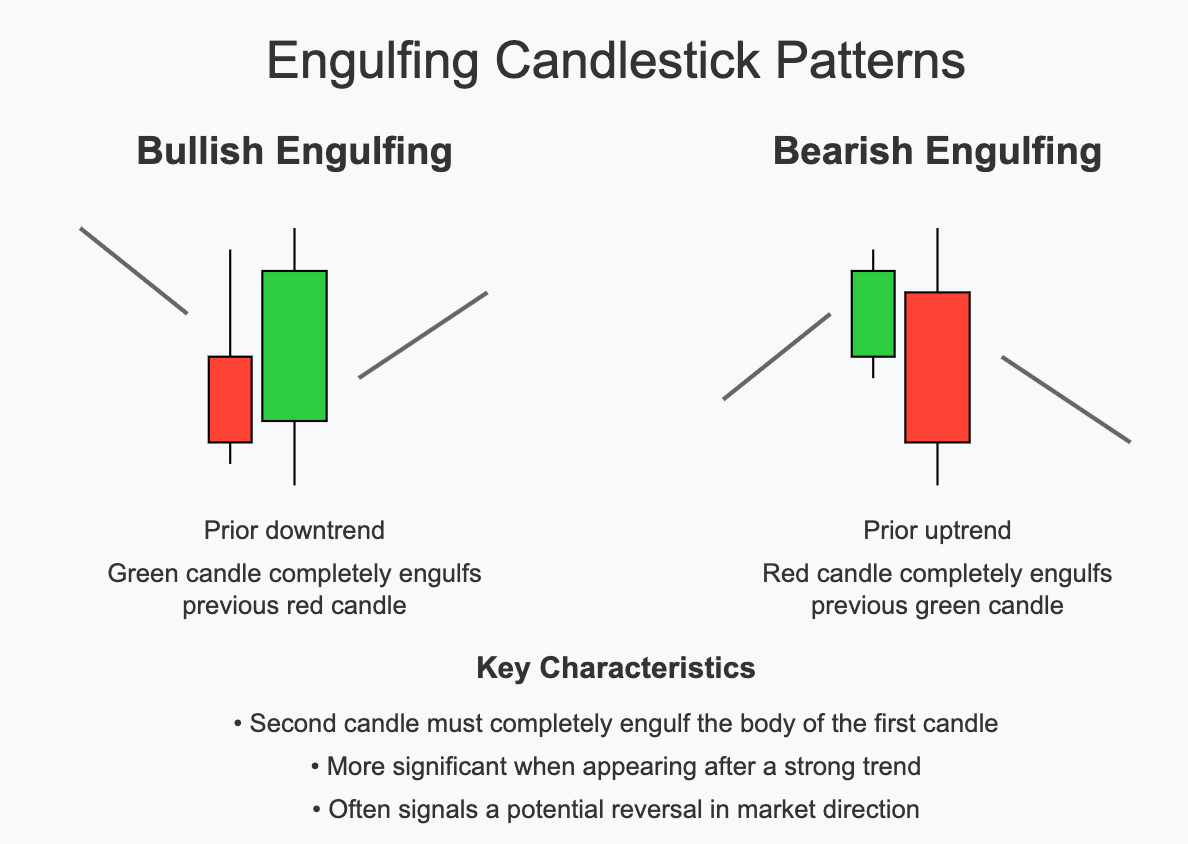
Engulfing Pattern
An engulfing pattern occurs when a candlestick completely covers the previous candlestick, including both its body and wick. There are two types of engulfing patterns:
Bullish engulfing forms after a downtrend, where a large green candle fully engulfs the previous red candle, signalling a potential upward reversal.
Bearish engulfing appears after an uptrend, where a large red candle fully engulfs the previous green candle, indicating a possible downward reversal.
Three Black Crows
The three black crows pattern is a bearish reversal signal that appears after an uptrend. It consists of three consecutive long red candles, each opening within the previous candle’s body and closing lower. This pattern indicates strong selling pressure and a potential downward trend.
Piercing Pattern
The piercing pattern is a two-candlestick bullish reversal signal that appears after a downtrend. It starts with a long red candle, followed by a green candle that opens lower but closes above the midpoint of the first candle. This shows that buyers are regaining control, and the price might move upward.
Bullish and Bearish Reversal Patterns
Candlestick patterns help traders identify potential trend reversals in the market. Bullish reversal patterns like the morning star, bullish engulfing, hammer, piercing pattern, and three white soldiers indicate a possible shift from a downtrend to an uptrend, showing that buyers are gaining control.
On the other hand, bearish reversal patterns such as the evening star, bearish engulfing, shooting star, three black crows, and hanging man signal a potential downturn, suggesting that selling pressure is increasing. Recognising these patterns can help traders make informed decisions about market trends.
What is a Chart Pattern?
A chart pattern is a specific formation created by the price movement of a stock, commodity, or any other financial asset on a chart. Traders use these patterns to identify possible trend continuations, reversals, or breakout opportunities in the market. These patterns are formed over time based on buying and selling activity and help traders understand market sentiment and price behaviour.
Some common chart patterns include head and shoulders, double top, double bottom, triangles, flags, and wedges. While some patterns suggest that the current trend may continue, others indicate a possible reversal in market direction. Traders often combine chart patterns with indicators, volume, and candlestick analysis for better accuracy.
What is Technical Analysis?
Candlestick patterns are an important part of technical analysis because they help traders understand market psychology and the battle between buyers and sellers. Traders often combine candlestick patterns with tools like support and resistance, moving averages, RSI, and volume analysis to confirm trading signals and improve accuracy.
The idea behind technical analysis is that price movements often follow trends and repeated behavioural patterns. By analysing charts and market behaviour, traders try to identify potential entry points, exit levels, and possible trend reversals in the market.
How to Trade Candlestick Patterns?
Trading candlestick patterns involves combining pattern recognition with market context. Start by identifying a clear pattern, such as a reversal or continuation signal, and always check the overall trend before taking a trade.
Next, look for confirmation. For example, a bullish pattern near support or a bearish pattern near resistance is more reliable. You can also use indicators like RSI or volume to strengthen the signal.
Always manage risk by setting a stop-loss, usually below or above the pattern. Finally, avoid relying on a single pattern; use multiple signals to improve accuracy and make better trading decisions.
Conclusion
Candlestick patterns help traders understand how prices move and what might happen next in the market. By looking at the shape and size of candlesticks, traders can see if buyers or sellers are stronger and predict possible trend changes. Some patterns show when prices might go up, while others warn of a possible drop.
However, candlestick patterns should not be used alone. It is important to check other factors like market trends, trading volume, and support or resistance levels before making any decisions. Learning these patterns takes time, but with practice, they can help traders find better opportunities.
No pattern can guarantee success, but when used along with other strategies, candlestick charts can make it easier to understand the market and make smarter trading choices.
Frequently Asked Questions (FAQs)
What is the 5 candle rule?
The 5 candle rule is a trading strategy where traders wait for five consecutive candlesticks to confirm a trend before making a decision. It helps reduce false signals by ensuring the trend is strong and not just a short-term movement.
What are the 42 candlestick patterns?
There are 42 recognised candlestick patterns used in technical analysis. These patterns include single, double, and multiple candlestick formations, helping traders identify trend reversals or continuations. Some common ones are the doji, hammer, engulfing pattern, morning star, and evening star.
What is the 3-hour candle rule?
The 3-hour candle rule is used in intraday trading, where traders analyse a 3-hour candlestick to understand market trends. It helps identify key price movements and possible breakouts, making it useful for short-term trading decisions.
How Do You Read a Candle Pattern?
Reading a candlestick pattern involves understanding the relationship between the open, close, high, and low prices. The candle’s body shows price movement, while the wicks indicate rejection levels. By analysing patterns formed by multiple candles, traders can identify potential trend reversals or continuations.
Which Candlestick Pattern Is Most Reliable?
There is no single most reliable pattern, but commonly trusted ones include engulfing patterns, long-legged doji, and abandoned baby patterns. These are considered reliable because they show strong shifts in market sentiment. However, their effectiveness improves when combined with other indicators.
Does Candlestick Pattern Analysis Really Work?
Candlestick analysis can be effective in identifying short-term price movements and market sentiment. However, it is not foolproof. Its reliability increases when used along with other tools like volume, support and resistance, or trend analysis, rather than being used alone.
Disclaimer: This content is for educational purposes only and does not constitute financial or investment advice. Investments in securities or other financial instruments are subject to market risk, including partial or total loss of capital. Past performance is not indicative of future results. Always consider your financial situation carefully and consult a licensed financial advisor before making investment or trading decisions.
Table of Content
- Key Takeaways
- What are Candlestick Patterns?
- How to Read a Candlestick Pattern?
- Types Of Single Candlestick Patterns
- Multiple Candlestick Patterns
- Bullish and Bearish Reversal Patterns
- What is a Chart Pattern?
- What is Technical Analysis?
- How to Trade Candlestick Patterns?
- Conclusion
- Frequently Asked Questions (FAQs)
Engineered for the obsessed. Built for traders.

Purpose-built terminals.
Zero compromise.
Built for speed.
Plot No 1290, 2nd Floor, 17th Cross, 5th Main, Sector-7, HSR Layout, Bangalore 560102
Follow us on
Mintcap Brokers Private Limited
CIN – U66110KA2023PTC178706 | Registered Address: Plot No 1290, Second Floor, 17th Cross, 5th Main, Sector-7, HSR Layout, Bangalore 560102 | Tel: 080 – 49552310 | Email ID: compliance@capmint.com | SEBI registered Stock Broker: INZ000322732 | NSE Cash/F&O Member ID: 90430 | BSE Cash/F&O Member ID: 6903 | MCX Member ID: 57400 | NCDEX Member ID: 1312 | SEBI registered Depository Participant: IN-DP-806-2025 | CDSL DP ID: 12102300 | NSE Clearing Member code: M70108 | AMFI-Registered Mutual Fund Distributor: ARN-289109 (Valid upto 28-Feb-2027) | Category II Execution Only Platform : E6903
Details of Client Bank Account
Compliance Officer: Ms. Shridevi Vungarala | Email ID: compliance@capmint.com | Tel no. + 91 9035330126 | Grievance Redressal Officer (GRO) – Ms. Shikha Gupta | Email ID: Grievance@capmint.com | Tel no: 9035331595.
Procedure to file a complaint on SEBI SCORES: Register on SCORES portal. Mandatory details for filing complaints on SCORES: Name, PAN, Address, Mobile Number, E-mail ID. Benefits: Effective Communication, Speedy redressal of the grievances. You may refer the website https://scores.sebi.gov.in/ for more information. You may also download the SEBI Scores app to log a complaint Android: https://play.google.com > store > apps > sebiscores iOS: https://apps.apple.com > app > sebiscores
Disclaimer
Investment in the securities market are subject to market risks, read all the related documents carefully before investing. Brokerage will not exceed the SEBI prescribed limit.
Mutual fund investments are subject to market risks, read all scheme related documents carefully before investing. Mutual Funds are not exchange-traded products.
Attention Investor:
- Stock Brokers can accept securities as margin from clients only by way of pledge in the depository system w.e.f. September 1, 2020.
- Update your mobile number & email Id with your stock broker/depository participant and receive OTP directly from depository on your email id and/or mobile number to create pledge.
- Pay 20% as upfront margin of the transaction value to trade in cash market segment.
- Investors may please refer to the Exchange’s Frequently Asked Questions (FAQs) issued vide circular reference NSE/INSP/45191 dated July 31, 2020 and NSE/INSP/45534 dated August 31, 2020 and other guidelines issued from time to time in this regard.
- Check your Securities /MF/ Bonds in the consolidated account statement issued by NSDL/CDSL every month.