
Table of Content
- Key Takeaways
- What is a Morning Star Pattern?
- Components of the Morning Star Candlestick Pattern
- Psychology Behind the Morning Star Pattern
- How to Trade the Morning Star Pattern
- Confirming the Pattern
- Morning Star vs Evening Star
- Advantages of the Morning Star Pattern
- Limitations of the Morning Star Pattern
- Conclusion
- Frequently Asked Questions (FAQs)
Link copied!
Morning Star Pattern
The Morning Star pattern is a bullish reversal candlestick pattern that typically appears at the bottom of a downtrend. It signals that the downtrend may be coming to an end and a new uptrend could begin.
Key Takeaways
- Three-Candle Reversal Signal: The Morning Star is a three-candle bullish reversal pattern that appears at the bottom of a downtrend. It shows a transition from bearish to bullish sentiment.
- Psychological Shift in Market Sentiment: The pattern reflects waning selling pressure, hesitation, and then strong buyer resurgence, indicating a potential trend reversal.
- Entry and Risk Management Strategy: Enter after the third candle closes, preferably above the midpoint of the first candle, with a stop-loss below the low of the second candle. Use resistance levels or risk-reward ratios for profit targets.
- Works Best With Confirmation: Confirm the pattern using volume spikes, RSI divergence, or the presence of support zones to reduce false signals in choppy markets.
What is a Morning Star Pattern?
The Morning Star is a three-candlestick pattern that signals a potential reversal from a downtrend to an uptrend. It appears at the bottom of a bearish trend and serves as a visual sign that selling pressure may be weakening, and a bullish rally could be on the horizon.
It is named after the planet Venus, often referred to as the “morning star” because it appears before sunrise; this pattern metaphorically signals the “dawn” of a new bullish move in the market.
Among the various three-candle reversal patterns, the Morning Star is one of the more recognisable and frequently discussed. On daily charts of liquid Indian stocks, a well-formed Morning Star after a sustained multi-day decline tends to produce a meaningful bounce in the sessions that follow, though the strength and duration of that bounce depend heavily on the broader market context and whether the pattern forms at a technically significant level.
Components of the Morning Star Candlestick Pattern
The Morning Star chart pattern is made up of three distinct candles:
1. First Candle: Strong Bearish Candle
A long red candlestick indicating a strong selling pressure and continuation of the downtrend. The size of this candle matters. A first candle with a body that covers at least 1.5–2 times the stock’s average daily range signals genuine selling conviction, as opposed to a modest red candle that could simply be part of routine price fluctuation. The larger this candle relative to recent price action, the more established the bearish control is before the pattern begins to form.
2. Second Candle: Small-Bodied Candle (Indecision)
A small candlestick (can be bullish, bearish, or even a Doji) that represents market indecision. This candle ideally opens with a gap down from the first, showing hesitation among sellers.
The second candle is the pivot point of the entire pattern. Its small body reflects a session where neither buyers nor sellers could gain decisive control. On Indian exchanges, particularly on Nifty 50 stocks, the gap-down component between the first and second candle is often subtle, sometimes just 0.2–0.5%, rather than the dramatic gaps shown in textbook illustrations. The pattern remains valid as long as the second candle’s body is noticeably smaller than the first and reflects a clear loss of bearish momentum. If the second candle is a Doji (open and close nearly identical), the indecision signal is even stronger, and the variant is sometimes referred to as a “Morning Doji Star.”
3. Third Candle: Strong Bullish Candle
A long green candlestick that closes well into the body of the first candle. It confirms the reversal and suggests buyers are regaining control.
The depth of penetration into the first candle’s body is a key quality indicator. A third candle that closes above the midpoint of the first candle’s body is the minimum threshold for the pattern to be considered valid. A third candle that closes above the first candle’s open (fully recovering the first day’s decline) is considerably stronger and suggests more decisive buyer participation. In practice, this full-recovery variant is less common but produces more reliable follow-through.
Psychology Behind the Morning Star Pattern
The psychology behind the Morning Star candle pattern reflects a gradual shift in market sentiment from bearishness to bullishness. On the first day, sellers are clearly in control, driving prices downward and reinforcing the existing downtrend. This creates a strong bearish candle and reinforces fear among market participants.
However, on the second day, the market opens lower but shows hesitation from both buyers and sellers, resulting in a small-bodied candle or even a Doji. This period of indecision indicates that bearish momentum is weakening and that some traders are beginning to question the continuation of the downtrend. The small body of the second candle often reflects a session where early sellers tried to push prices lower but were met with buying interest for the first time in the decline, resulting in a standoff.
By the third day, confidence begins to shift in favour of the bulls. Buyers step in with strong momentum, creating a long bullish candle that closes well into the body of the first candle. This decisive move signifies a revival in buying interest and signals a potential trend reversal.
Overall, the Morning Star encapsulates the psychological journey from fear and uncertainty to optimism and renewed buying interest. The pattern is most convincing when the downtrend preceding it has been sustained for at least five to seven sessions, because a reversal after a prolonged decline represents a more significant shift in sentiment than one after a brief two-day dip. When the pattern appears after only a minor pullback within a larger uptrend, it’s more of a continuation signal than a true reversal, and the distinction affects both the expected magnitude and reliability of the subsequent move.
How to Trade the Morning Star Pattern
Before jumping into trades, it’s important to have a clear plan for how you’ll enter, manage, and exit your position once a Morning Star pattern appears.
Here’s a step-by-step approach to trading it effectively:
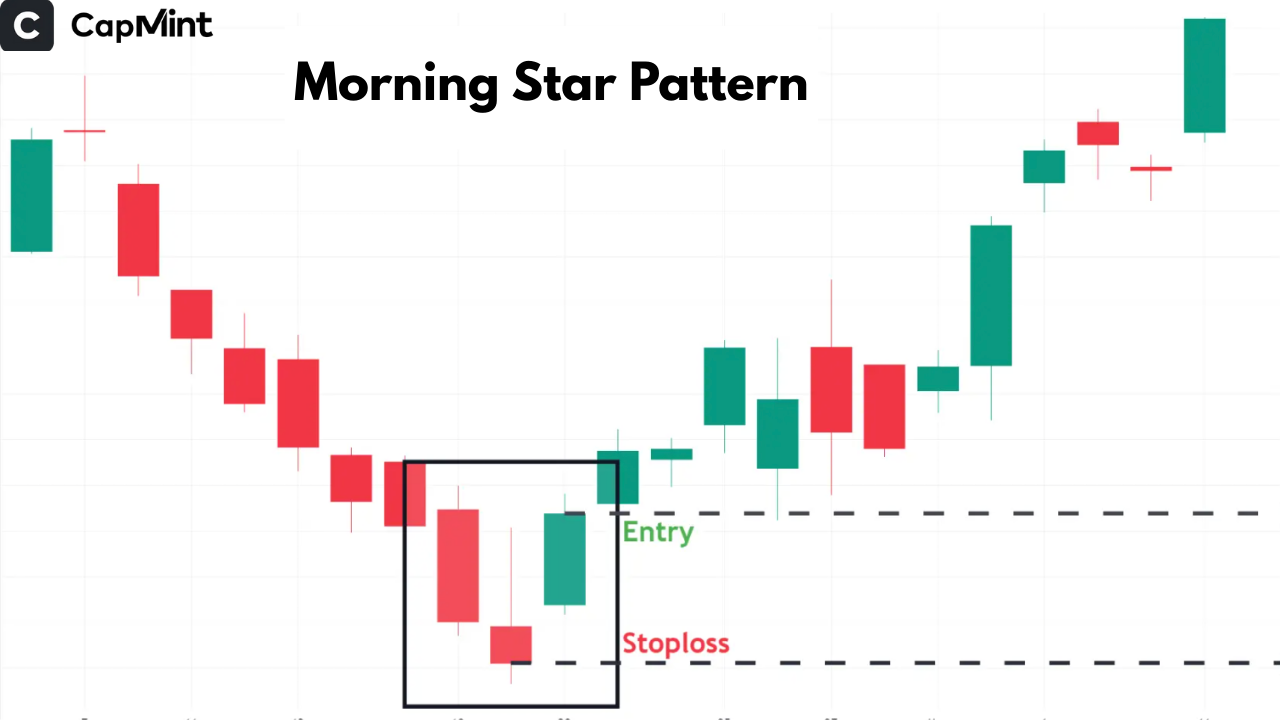
Entry Points
Enter a trade after the third candle closes above the midpoint of the first candle, preferably with high volume confirmation. Conservative traders may wait for additional confirmation through volume spikes or technical indicators.
A practical approach for timing the entry: entering at the open of the fourth candle (the session after the pattern completes) is the most straightforward method. This ensures the full three-candle pattern has formed and the third candle’s close is confirmed. Entering during the third candle’s session, before it closes, carries the risk that the candle’s final close may be weaker than anticipated, invalidating the pattern. However, waiting for the fourth candle does mean entering at a slightly higher price, so the trade-off between confirmation and entry price is worth considering based on the stock’s typical volatility.
Stop-Loss Placement
Place the stop-loss below the low of the second candle (the indecision candle) to limit downside risk.
The second candle’s low represents the pattern’s point of maximum bearish exhaustion. If the price breaks below this level after the pattern forms, the reversal thesis is invalidated, and exiting promptly limits the damage. On stocks with particularly tight second-candle ranges, the stop may be very close to the entry, creating a favourable risk-reward ratio. On stocks where the second candle has a long lower shadow, the stop-loss distance can be wider, which may require reducing position size to keep the absolute risk manageable. Calculating the stop-loss distance in rupee or percentage terms before entering helps ensure the trade fits within your risk parameters.
Profit Targets
Use prior resistance levels, Fibonacci retracement levels, or risk-reward ratios (e.g., 1:2 or 1:3) to set profit targets.
The nearest horizontal resistance level, such as a previous swing high or a zone where the stock consolidated before its decline, serves as the most natural first target. If the trade moves in your favour and clears this level, trailing the stop-loss to break-even and letting the position develop can capture a larger portion of the new trend. A common approach is to book partial profits at the first resistance and trail the remainder with a stop just below the most recent swing low.
Confirming the Pattern
To increase confidence in trading the Morning Star pattern, it’s practical to use it alongside other technical tools. Think of it as getting a second opinion before making a decision.
Volume
If you see a significant surge in volume on the third (bullish) candle, that’s a strong sign that buying interest is genuine and broad-based. A useful benchmark is to check whether the third candle’s volume is at least 1.5 times the 10-day average volume. Low volume on the third candle, even if the candle itself is visually strong, suggests the reversal may lack institutional participation and is more prone to failure.
Additionally, declining volume across the first and second candles, followed by a volume spike on the third, creates the strongest confirmation setup. This pattern of diminishing selling pressure followed by a burst of buying interest aligns precisely with what the Morning Star is meant to signal.
RSI (Relative Strength Index)
If the RSI shows a bullish divergence (price making a lower low while RSI makes a higher low) or is bouncing from an oversold level below 30, it adds more weight to the reversal signal. An RSI that is already at 25–30 when the Morning Star forms suggests that the stock is statistically stretched to the downside, making a reversal more probable than if RSI were at 40–45, where oversold conditions haven’t fully developed.
Support Zone
Check if the pattern is forming around a well-established support zone, such as a prior swing low, a horizontal level tested multiple times, or a key moving average like the 200-day SMA. A Morning Star at a level where the stock has previously found buying interest represents a confluence of signals and creates a high-probability trade setup. On Nifty 50 stocks, Morning Star patterns at the 200-day moving average have historically been among the more reliable reversal signals, because institutional buyers often use that level as a reference for adding positions.
These confirmations help filter out false signals and give greater confidence to act decisively.
Morning Star vs Evening Star
The Morning Star and Evening Star are mirror-image patterns, one signalling a bullish reversal and the other a bearish reversal.
| Feature | Morning Star | Evening Star |
|---|---|---|
| Appears at | Bottom of a downtrend | Top of an uptrend |
| First Candle | Long bearish (red) | Long bullish (green) |
| Second Candle | Small body (indecision) | Small body (indecision) |
| Third Candle | Long bullish (green) | Long bearish (red) |
| Signal | Bullish reversal | Bearish reversal |
The key structural difference is context. The Morning Star forms after sustained selling and signals a shift to buying. The Evening Star forms after sustained buying and signals a shift to selling. Both require the same type of confirmation (volume, supporting indicators, proximity to key levels), and both are most reliable when they appear after a well-established trend rather than during a choppy, directionless phase.
Advantages of the Morning Star Pattern
Easy to spot on charts
One of the most practical aspects of the Morning Star pattern is how visually recognisable it is. With just three candles and a clear structure, it’s accessible even to those relatively new to technical analysis. The pattern doesn’t require mathematical calculations or overlays; it’s identifiable by simply scrolling through a daily chart.
Provides early entry signals for trend reversals
The Morning Star alerts traders early on that a downtrend might be ending. Spotting this pattern allows you to position yourself ahead of broader confirmation, potentially entering a new uptrend closer to its beginning. On stocks that go on to rally 10–15% after a Morning Star at a key support level, the early entry can mean the difference between capturing most of the move and chasing it after it’s already extended.
Works well across different timeframes and markets
The Morning Star can be applied to any timeframe, whether you’re trading intraday, swing, or long-term positions. It also appears across various asset classes, from stocks and forex to commodities. On higher timeframes like daily and weekly charts, the pattern tends to produce more reliable signals with stronger follow-through compared to intraday charts where market noise generates more false formations.
Limitations of the Morning Star Pattern
May produce false signals in sideways or choppy markets
The Morning Star pattern is most effective in clear trending markets. In consolidating or range-bound environments, it can lead to false breakouts and premature entries. A stock trading in a ₹480–520 range for several weeks might form multiple patterns that resemble Morning Stars near the bottom of the range, but without a genuine trend preceding the pattern, these formations lack the psychological context that gives the pattern its predictive value. Ensuring the stock has been in a genuine downtrend (not just a minor dip within a range) before treating the pattern as actionable helps avoid this trap.
Requires confirmation through volume or indicators
Relying solely on the visual pattern without supporting indicators can be risky. For better reliability, traders need to validate the pattern with tools like volume spikes, RSI, or support zones to reduce the chance of entering on a weak setup. A Morning Star with below-average volume on the third candle, no supporting indicator confirmation, and no nearby support level is a low-quality setup that produces false signals more often than it works.
Gap requirements may not always be met
Textbook Morning Star patterns include gaps between the first and second candles, and between the second and third. On Indian stocks, where overnight gaps are smaller than in some other markets, strict adherence to the gap requirement would filter out many otherwise valid formations. The practical approach is to focus on the body sizes and the overall structure rather than insisting on visible gaps, especially on large-cap stocks where overnight price continuity is more common than gapping.
Conclusion
The Morning Star candlestick pattern is a practical and visually intuitive signal of a potential trend reversal. While it offers early entry opportunities for bullish trades, its effectiveness increases significantly when paired with confirmation tools like volume, RSI, and support levels. Traders should be cautious in sideways markets and always apply risk management to avoid false breakouts. The highest-quality Morning Star setups tend to share a few common characteristics: they form after a sustained multi-session decline, appear at or near a recognised support level, show a clear volume expansion on the third candle, and have a third candle that closes above the midpoint of the first candle’s body. When these elements align, the pattern provides a structured and high-probability entry point for a bullish position.
Frequently Asked Questions (FAQs)
Is the Morning Star pattern reliable?
The Morning Star is among the more reliable three-candle reversal patterns, especially when confirmed by other indicators like volume, RSI, or support zones. However, its reliability diminishes in sideways or choppy markets where indecision candles appear frequently without leading to genuine reversals. On daily charts of liquid stocks, a well-confirmed Morning Star at a key support level has a reasonable probability of producing a meaningful bounce, though the magnitude and duration of the subsequent move vary widely depending on market context.
Can the Morning Star appear on any timeframe?
Yes. It can be used on intraday, daily, weekly, or even monthly charts. The higher the timeframe, the stronger the signal tends to be and the more sustained the subsequent reversal is likely to be. A Morning Star on a weekly chart of a Nifty 50 stock carries significantly more weight than the same pattern on a 15-minute chart, where market noise routinely creates three-candle sequences that resemble the pattern without leading to genuine trend changes.
How is the Morning Star pattern different from the Evening Star?
The Morning Star signals a bullish reversal at the bottom of a downtrend, while the Evening Star indicates a bearish reversal at the top of an uptrend. Structurally, they are mirror images: the Morning Star begins with a bearish candle and ends with a bullish candle, while the Evening Star begins with a bullish candle and ends with a bearish candle. Both require the same type of confirmation and risk management approach.
Do all three candles need to gap for a valid pattern?
No. While gaps between candles add strength to the pattern, they are not mandatory. The essence lies in the formation: strong bearish candle, followed by indecision, followed by strong bullish candle. On Indian exchanges, where overnight gaps tend to be smaller than in US markets, insisting on visible gaps would filter out many valid setups. Focus on the relative body sizes and the third candle’s depth of penetration into the first candle’s body as the primary quality indicators.
Can beginners use the Morning Star pattern effectively?
Yes. The Morning Star is one of the more beginner-friendly candlestick patterns due to its clear three-candle structure and straightforward interpretation. Starting by identifying the pattern on historical charts and observing how it played out before trading it live helps build familiarity with how it behaves across different stocks and market conditions. Pairing it with a simple confirmation tool like volume or RSI, and always using a stop-loss below the second candle’s low, provides a structured framework that beginners can apply consistently.
Disclaimer: This content is for educational purposes only and does not constitute financial or investment advice. Investments in securities or other financial instruments are subject to market risk, including partial or total loss of capital. Past performance is not indicative of future results. Always consider your financial situation carefully and consult a licensed financial advisor before making investment or trading decisions.
Table of Content
- Key Takeaways
- What is a Morning Star Pattern?
- Components of the Morning Star Candlestick Pattern
- Psychology Behind the Morning Star Pattern
- How to Trade the Morning Star Pattern
- Confirming the Pattern
- Morning Star vs Evening Star
- Advantages of the Morning Star Pattern
- Limitations of the Morning Star Pattern
- Conclusion
- Frequently Asked Questions (FAQs)
Engineered for the obsessed. Built for traders.

Purpose-built terminals.
Zero compromise.
Built for speed.
Plot No 1290, 2nd Floor, 17th Cross, 5th Main, Sector-7, HSR Layout, Bangalore 560102
Follow us on
Mintcap Brokers Private Limited
CIN – U66110KA2023PTC178706 | Registered Address: Plot No 1290, Second Floor, 17th Cross, 5th Main, Sector-7, HSR Layout, Bangalore 560102 | Tel: 080 – 49552310 | Email ID: compliance@capmint.com | SEBI registered Stock Broker: INZ000322732 | NSE Cash/F&O Member ID: 90430 | BSE Cash/F&O Member ID: 6903 | MCX Member ID: 57400 | NCDEX Member ID: 1312 | SEBI registered Depository Participant: IN-DP-806-2025 | CDSL DP ID: 12102300 | NSE Clearing Member code: M70108 | AMFI-Registered Mutual Fund Distributor: ARN-289109 (Valid upto 28-Feb-2027) | Category II Execution Only Platform : E6903
Details of Client Bank Account
Compliance Officer: Ms. Shridevi Vungarala | Email ID: compliance@capmint.com | Tel no. + 91 9035330126 | Grievance Redressal Officer (GRO) – Ms. Shikha Gupta | Email ID: Grievance@capmint.com | Tel no: 9035331595.
Procedure to file a complaint on SEBI SCORES: Register on SCORES portal. Mandatory details for filing complaints on SCORES: Name, PAN, Address, Mobile Number, E-mail ID. Benefits: Effective Communication, Speedy redressal of the grievances. You may refer the website https://scores.sebi.gov.in/ for more information. You may also download the SEBI Scores app to log a complaint Android: https://play.google.com > store > apps > sebiscores iOS: https://apps.apple.com > app > sebiscores
Disclaimer
Investment in the securities market are subject to market risks, read all the related documents carefully before investing. Brokerage will not exceed the SEBI prescribed limit.
Mutual fund investments are subject to market risks, read all scheme related documents carefully before investing. Mutual Funds are not exchange-traded products.
Attention Investor:
- Stock Brokers can accept securities as margin from clients only by way of pledge in the depository system w.e.f. September 1, 2020.
- Update your mobile number & email Id with your stock broker/depository participant and receive OTP directly from depository on your email id and/or mobile number to create pledge.
- Pay 20% as upfront margin of the transaction value to trade in cash market segment.
- Investors may please refer to the Exchange’s Frequently Asked Questions (FAQs) issued vide circular reference NSE/INSP/45191 dated July 31, 2020 and NSE/INSP/45534 dated August 31, 2020 and other guidelines issued from time to time in this regard.
- Check your Securities /MF/ Bonds in the consolidated account statement issued by NSDL/CDSL every month.