
Link copied!
Bollinger Bands
Bollinger Bands are technical analysis indicators consisting of a middle band (a simple moving average) and two outer bands (standard deviations above and below the moving average). They measure price volatility and identify potential overbought or oversold conditions.
Key Takeaways
- Bollinger Bands show price volatility: The bands expand and contract based on how much the price is moving, helping traders understand market conditions.
- They help spot overbought and oversold levels: When the price touches the upper band, it may be overbought; when it hits the lower band, it might be oversold.
- Use them with other tools for better signals: Combining Bollinger Bands with indicators like RSI or chart patterns makes the signals more reliable.
- Watch for the ‘squeeze’ pattern: A squeeze (when bands get tight) usually comes before a big price move. It’s a sign to stay alert for a breakout.
What Are Bollinger Bands?
Bollinger Bands are a technical analysis tool used by traders to understand price movements in the market. They help you see when a stock might be overbought or oversold, and more broadly, whether the market is in a volatile or calm phase.
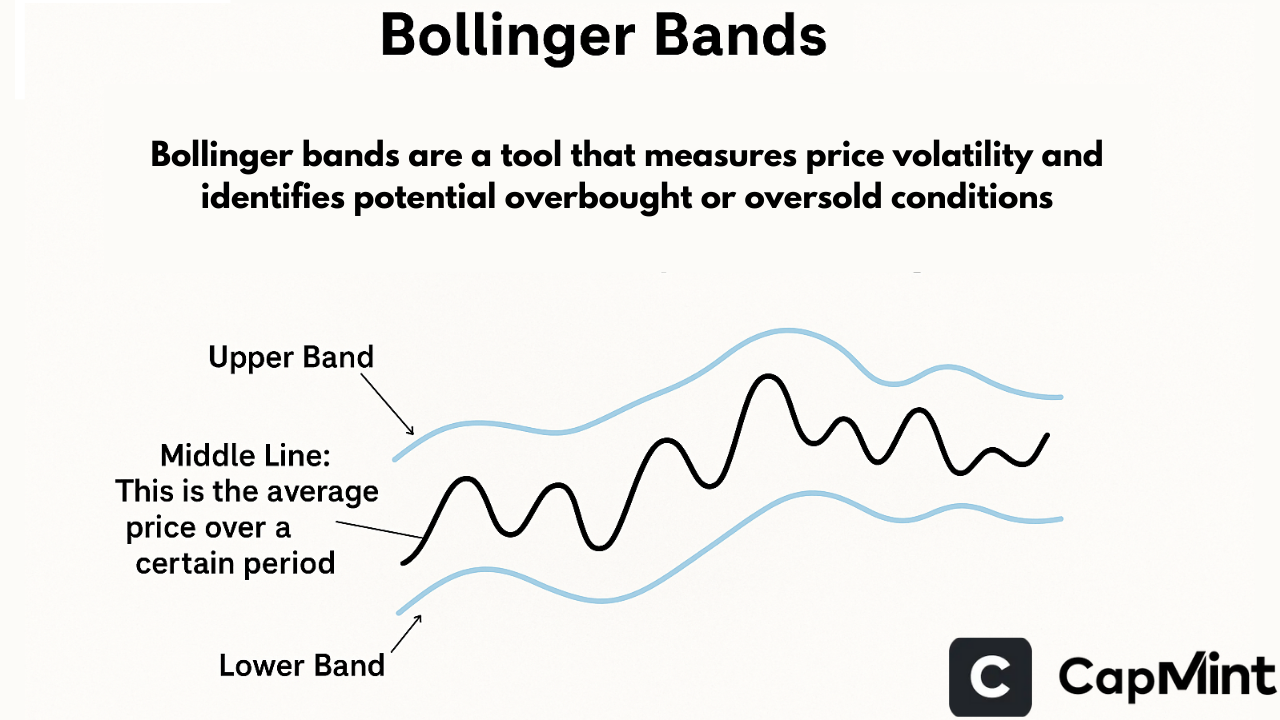
A Bollinger Band has three parts:
Upper Band
Located two standard deviations above the middle band. It represents the upper boundary of “normal” price behaviour based on recent volatility.
Middle Band
This is typically the 20-period simple moving average (SMA). It represents the average price over the past 20 sessions and serves as the central reference point for the entire indicator.
Lower Band
Located two standard deviations below the middle band. It represents the lower boundary of expected price movement.
The upper and lower bands adjust dynamically based on market volatility. When the price moves sharply, the bands widen. When the price is more stable, the bands tighten. This adaptive quality is what makes Bollinger Bands more useful than fixed-percentage envelopes around a moving average, because the bands automatically calibrate to the stock’s current behaviour rather than using a static boundary that may be too wide in calm markets and too narrow in volatile ones.
On Indian exchanges, the default 20-period, 2-standard-deviation setting works well for daily charts of most Nifty 50 and Bank Nifty stocks. For intraday charts (15-minute or hourly), some traders adjust to a shorter period (10-period) to make the bands more responsive to intraday price action, though this also increases the frequency of signals that may not follow through.
How to Use Bollinger Bands to Trade
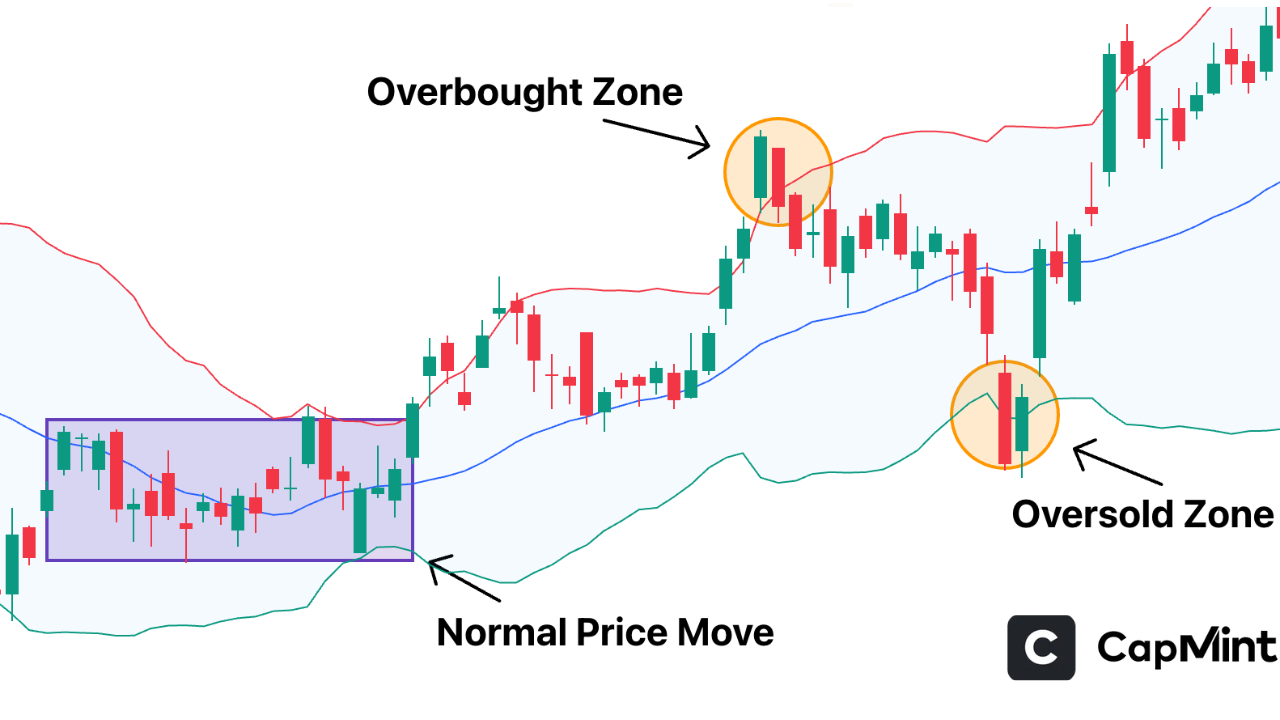
Using the Bollinger Bands indicator lets you detect when stocks may be overbought or oversold:
Price near the upper band
It indicates the stock price is experiencing a rapid increase, which suggests it might be overbought and could pull back soon. However, in strongly trending markets, the price can “walk the upper band” for days or even weeks, staying near or above it without reversing. Treating an upper band touch as an automatic sell signal during a strong uptrend is one of the most common misapplications of this indicator.
Price near the lower band
Suggests a sharp decline in stock price; hence, it may be oversold and could bounce upward. The same caveat applies in reverse: during strong downtrends, the price can hug the lower band persistently. A stock falling to the lower band during a confirmed downtrend is not necessarily a buying opportunity; it may simply be continuing its decline with elevated momentum.
Price movement between the bands
This is typical price behaviour, suggesting that prices are moving within an acceptable range based on recent volatility.
Additionally, Bollinger Bands allow for monitoring expansion and contraction:
- Volatile or fast-moving price action will widen the bands.
- Calm or quiet price action will cause the bands to tighten together.
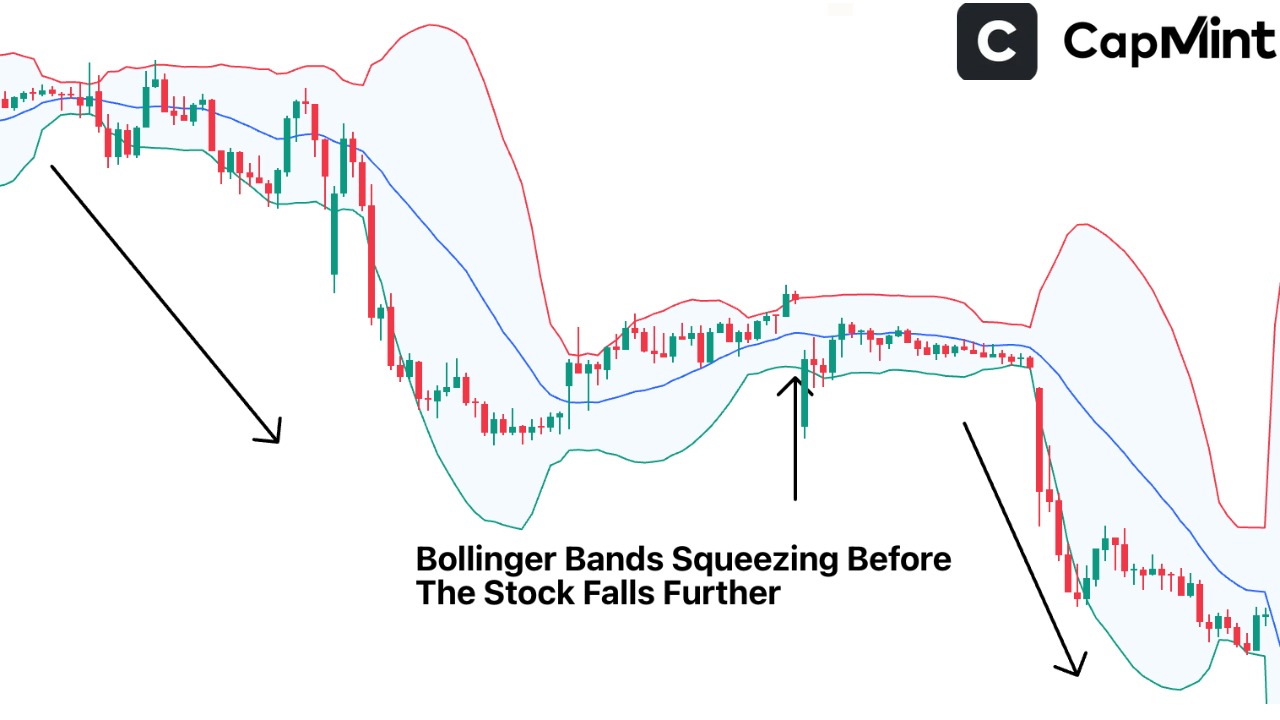
Traders usually watch for something referred to as a “squeeze,” which occurs when the bands come very close to each other. That’s often a signal that a significant price shift is approaching, although it doesn’t specify which direction. On Nifty 50 stocks, a squeeze on the daily chart, where the bandwidth contracts to its narrowest point in 20–30 sessions, frequently precedes a breakout that produces a 3–5% directional move within the following one to two weeks. The squeeze itself is neutral; the breakout direction is determined by the broader trend and the catalyst that triggers the move.
Overbought and Oversold Context
A stock is considered overbought if its price is touching or crossing the upper band. This indicates that the price has increased quickly relative to recent history. A stock is considered oversold if its price is touching or crossing the lower band, implying that the price has decreased quickly and may be due for a recovery.
These readings are most useful in range-bound stock markets where the price oscillates between the bands. In trending markets, the bands serve better as directional guides (the price staying above the middle band confirms an uptrend) rather than overbought/oversold signals.
Why Use Bollinger Bands?
Here are the reasons why many traders use the Bollinger Bands trading strategy:
Identify Potential Reversal Zones
If the stock price is nearing the upper band in a range-bound market, it may be approaching a short-term ceiling. If the price is close to the lower band, it may be near a short-term floor. This helps in timing entries and exits around these zones, particularly when other indicators confirm the signal.
Prepare for Significant Moves
When the bands get very close together (the squeeze), it usually means a period of low volatility is about to end. This gives you advance notice to be alert for a breakout. The squeeze doesn’t guarantee a big move, but historically, periods of very low volatility on liquid Indian stocks are followed by above-average directional moves with reasonable consistency.
Time Trades More Effectively
Instead of buying or selling based on intuition alone, you can use the bands to find better entry and exit points. For example, buying when the price touches the lower band during a confirmed uptrend (a pullback to the lower boundary within the trend) often provides a more favourable entry than buying in the middle of the range.
Understand Market Volatility at a Glance
Wide bands mean the market is very active and price swings are large; tight bands mean the market is calm and moves are compressed. This helps you adjust position sizes and expectations accordingly. In a wide-band environment, stop-losses need to be wider to accommodate the larger swings, and profit targets can be more ambitious. In a tight-band environment, tighter stops and smaller targets are more appropriate.
In short, Bollinger Bands provide a visual framework for reading volatility and price extremes, which helps reduce the tendency to make reactive, emotion-driven decisions.
Also, read about volatility indicators.
Bollinger Bands Trading Strategy
Bollinger Bands are one of the most widely used tools for tracking volatility, but to use them effectively, traders need to understand how to interpret their signals and combine them with other indicators. Let’s look at some practical ways to use them in your trading strategy.
Don’t Use Them Alone
Bollinger Bands give useful information about volatility and price position, but they become significantly more reliable when combined with other indicators. Pairing them with the RSI (Relative Strength Index) is one of the most common and practical combinations. If the price touches the lower Bollinger Band while RSI is simultaneously below 30 (oversold), the confluence of both signals pointing to oversold conditions makes a bounce more probable than either signal alone.
Similarly, combining Bollinger Bands with volume analysis adds another dimension. A price touch at the lower band on high volume often indicates capitulation selling, which tends to mark short-term bottoms more reliably than low-volume touches where the selling is lacklustre and may continue.
Look for the Squeeze
When the bands come close together, it usually means the market has been quiet for a sustained period. This often happens before a significant price move. Traders look for a breakout in either direction after a squeeze. The squeeze doesn’t tell you the direction, but it does tell you to be prepared.
A practical way to identify a squeeze is to watch the Bollinger Band Width (the percentage difference between the upper and lower bands relative to the middle band). When this width reaches its lowest point in the past 20–30 sessions, a squeeze is in effect. On Nifty 50 stocks, squeezes that last for more than a week tend to produce larger subsequent breakouts than those that resolve within two or three days. One approach for trading the squeeze is to wait for the first candle that closes outside either band after the squeeze, and then enter in that direction with a stop-loss on the other side of the middle band.
Watch for Reversals
If the price moves outside the upper or lower band and then quickly comes back inside, it might be a sign that the trend is losing strength. This outside-to-inside move, sometimes called a “band rejection,” is particularly useful at potential turning points. A stock that pierces the upper band on an intraday basis but closes back below it by the session end is showing that buyers pushed hard but couldn’t hold the level, which is more bearish than a close above the upper band where momentum is sustaining.
On Indian large-cap stocks, a close outside the Bollinger Bands on the daily chart is relatively uncommon, occurring perhaps once or twice a month on any given stock. When it does happen, the subsequent price action, whether the price stays outside or snaps back inside, provides useful information about the strength of the underlying move.
Combine with Chart Patterns and Candlestick Patterns
Bollinger Bands work well alongside common chart patterns. If a double bottom forms near the lower band, or even better, if the second low of the double bottom falls outside the lower band while the first low was inside, it creates a stronger bullish signal because the second test shows the price stretched beyond its normal volatility range and was still rejected. If a double top forms near the upper band, the same logic applies in reverse.
Candlestick patterns near the bands also carry additional weight. A bullish hammer or Morning Star forming at the lower Bollinger Band represents a confluence of a volatility-based support level and a candlestick reversal signal.
Similarly, a bearish engulfing or Evening Star at the upper band combines a volatility ceiling with a candlestick reversal.
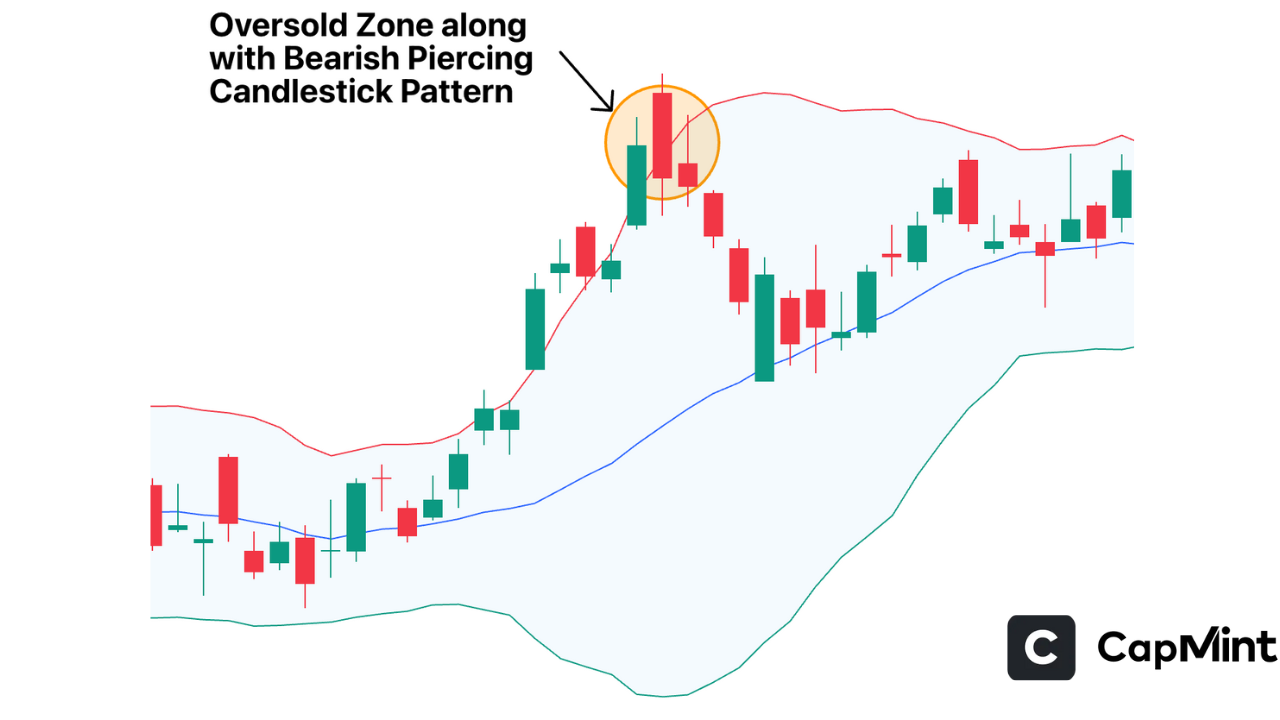
These combinations tend to produce more reliable signals than either the band touch or the candlestick pattern alone.
Mean Reversion Strategy
One of the most intuitive Bollinger Band strategies is mean reversion, based on the principle that the price tends to return to the middle band (the 20-period SMA) over time. In a range-bound market, buying near the lower band with a target at the middle band, or selling near the upper band with a target at the middle band, can produce consistent results.
This strategy works best when the bands are relatively flat (not expanding or contracting sharply), and the stock is trading without a strong directional trend. On Indian mid-cap stocks during consolidation phases, the price often oscillates between the bands with the middle band acting as a natural magnet, making mean reversion a practical approach during these periods. The key risk is misidentifying a trending market as range-bound: if the bands are expanding and the price is walking along one band, mean reversion trades will consistently produce losses.
Trend-Following with Bollinger Bands
In trending markets, the middle band serves as dynamic support (in uptrends) or dynamic resistance (in downtrends). During a sustained uptrend, pullbacks to the middle band, the 20-day SMA, often represent buying opportunities, while a close below the middle band may signal that the trend is weakening.
A practical trend-following rule used by many traders: as long as the price remains above the middle band and the bands are expanding, the uptrend is considered intact. Once the price closes below the middle band, the immediate bullish bias is suspended, and traders wait for either a reclaim of the middle band or a test of the lower band before taking new positions.
Practice and Observe
Like any trading tool, Bollinger Bands work best when you understand how they behave in different market conditions. Observing how the price reacts near the bands in trending versus range-bound environments on stocks you regularly trade builds pattern recognition over time. The distinction between a trending market (where band touches represent continuation, not reversal) and a range-bound market (where band touches represent mean-reversion opportunities) is the single most important contextual skill for using Bollinger Bands effectively.
Bollinger Bands vs Other Volatility Indicators
Bollinger Bands vs Keltner Channels
Both are envelope-based indicators, but they differ in construction. Bollinger Bands use standard deviations, which make them more responsive to sudden volatility spikes, while Keltner Channels use Average True Range (ATR), which smooths out the envelope. Some traders use both together: when Bollinger Bands contract inside the Keltner Channels, it signals a particularly tight squeeze, and the subsequent breakout outside the Keltner Channels confirms the move.
Bollinger Bands vs ATR (Average True Range)
ATR measures volatility as a standalone number (in rupees or points), while Bollinger Bands visualise volatility directly on the price chart as expanding or contracting bands. ATR is more commonly used for position sizing and stop-loss calculation, while Bollinger Bands are used for identifying overbought/oversold conditions and potential breakouts. Using both together, with Bollinger Bands for visual pattern recognition and ATR for precise stop-loss placement, covers different aspects of volatility analysis.
Conclusion
Bollinger Bands are a practical and versatile tool that helps traders understand price volatility, spot potential turning points, and prepare for significant price moves. But like any indicator, they are not perfect on their own and work best when combined with complementary tools such as RSI, volume analysis, or candlestick patterns. The most important distinction to develop when using Bollinger Bands is recognising whether the current market is trending or range-bound, as this single determination changes how every band touch should be interpreted. In range-bound conditions, the bands function as mean-reversion boundaries. In trending conditions, they function as momentum guides. Applying the wrong interpretation to the wrong market phase is the primary source of false signals from this indicator. With consistent practice and contextual awareness, Bollinger Bands can become a reliable component of a broader trading strategy.
Frequently Asked Questions (FAQs)
Are Bollinger Bands only useful for short-term trading?
No. Bollinger Bands can be used across all timeframes, from intraday charts to long-term weekly or monthly charts. On weekly charts of Indian large-cap stocks, Bollinger Band squeezes can signal multi-week or multi-month breakouts that are relevant for positional and investment-oriented traders. The tool adapts to whatever timeframe it’s applied to because the standard deviation calculation automatically adjusts to the volatility characteristics of that timeframe.
What does it mean when the price moves outside the Bollinger Bands?
When the price moves outside the bands, it means the current move has exceeded the statistical range of “normal” price behaviour based on recent history. It often indicates a strong momentum-driven move. But it doesn’t always mean the price will reverse immediately. In a strong trend, the price can stay outside the band for several sessions. The more useful signal is what happens after the price moves outside: a quick snap back inside often signals exhaustion, while sustained closes outside the band suggest the trend has significant momentum behind it. Waiting for confirmation before acting on an outside-band move reduces the risk of premature entries.
Can Bollinger Bands predict the direction of a breakout?
Not on their own. Bollinger Bands can show that a breakout is likely (especially after a squeeze), but they don’t indicate which direction the breakout will take. For directional clues, traders combine the squeeze with other tools: the slope of the middle band (rising or falling), RSI momentum, or the position of the price relative to the middle band before the squeeze resolves. If the price is above the middle band during a squeeze, the breakout is slightly more likely to be upward, and vice versa, though this is a tendency rather than a rule.
How accurate are Bollinger Bands?
Bollinger Bands are useful for identifying volatility conditions and price extremes, but their accuracy depends entirely on context and how they’re applied. In range-bound markets, band touches produce relatively reliable mean-reversion signals. In trending markets, the same band touches can generate repeated false reversal signals. Combining them with indicators like RSI or MACD, and distinguishing between trending and range-bound environments before interpreting the bands, significantly improves signal quality.
What settings should I use for Bollinger Bands?
The default settings of a 20-period moving average and ±2 standard deviations work well for most situations and are the most widely used. Because these defaults are so common, the levels they produce are watched by the largest number of market participants, which reinforces their relevance as support and resistance zones. Adjusting to a shorter period (10) with ±1.5 standard deviations makes the bands tighter and more responsive, which some intraday traders prefer. Widening to a 50-period average with ±2.5 standard deviations produces broader bands suitable for longer-term analysis. In most cases, sticking with the default settings avoids the risk of over-optimising to past data and keeps your analysis aligned with what the majority of traders are watching.
Now that you understand Bollinger Bands, take your analysis further by exploring Donchian Channels, the Hanging Man pattern, and the Stochastic Oscillator.
Disclaimer: This content is for educational purposes only and does not constitute financial or investment advice. Investments in securities or other financial instruments are subject to market risk, including partial or total loss of capital. Past performance is not indicative of future results. Always consider your financial situation carefully and consult a licensed financial advisor before making investment or trading decisions.
Engineered for the obsessed. Built for traders.

Purpose-built terminals.
Zero compromise.
Built for speed.
Plot No 1290, 2nd Floor, 17th Cross, 5th Main, Sector-7, HSR Layout, Bangalore 560102
Follow us on
Mintcap Brokers Private Limited
CIN – U66110KA2023PTC178706 | Registered Address: Plot No 1290, Second Floor, 17th Cross, 5th Main, Sector-7, HSR Layout, Bangalore 560102 | Tel: 080 – 49552310 | Email ID: compliance@capmint.com | SEBI registered Stock Broker: INZ000322732 | NSE Cash/F&O Member ID: 90430 | BSE Cash/F&O Member ID: 6903 | MCX Member ID: 57400 | NCDEX Member ID: 1312 | SEBI registered Depository Participant: IN-DP-806-2025 | CDSL DP ID: 12102300 | NSE Clearing Member code: M70108 | AMFI-Registered Mutual Fund Distributor: ARN-289109 (Valid upto 28-Feb-2027) | Category II Execution Only Platform : E6903
Details of Client Bank Account
Compliance Officer: Ms. Shridevi Vungarala | Email ID: compliance@capmint.com | Tel no. + 91 9035330126 | Grievance Redressal Officer (GRO) – Ms. Shikha Gupta | Email ID: Grievance@capmint.com | Tel no: 9035331595.
Procedure to file a complaint on SEBI SCORES: Register on SCORES portal. Mandatory details for filing complaints on SCORES: Name, PAN, Address, Mobile Number, E-mail ID. Benefits: Effective Communication, Speedy redressal of the grievances. You may refer the website https://scores.sebi.gov.in/ for more information. You may also download the SEBI Scores app to log a complaint Android: https://play.google.com > store > apps > sebiscores iOS: https://apps.apple.com > app > sebiscores
Disclaimer
Investment in the securities market are subject to market risks, read all the related documents carefully before investing. Brokerage will not exceed the SEBI prescribed limit.
Mutual fund investments are subject to market risks, read all scheme related documents carefully before investing. Mutual Funds are not exchange-traded products.
Attention Investor:
- Stock Brokers can accept securities as margin from clients only by way of pledge in the depository system w.e.f. September 1, 2020.
- Update your mobile number & email Id with your stock broker/depository participant and receive OTP directly from depository on your email id and/or mobile number to create pledge.
- Pay 20% as upfront margin of the transaction value to trade in cash market segment.
- Investors may please refer to the Exchange’s Frequently Asked Questions (FAQs) issued vide circular reference NSE/INSP/45191 dated July 31, 2020 and NSE/INSP/45534 dated August 31, 2020 and other guidelines issued from time to time in this regard.
- Check your Securities /MF/ Bonds in the consolidated account statement issued by NSDL/CDSL every month.