
Table of Content
- Key Takeaways
- What Is a Simple Moving Average?
- Key Characteristics of SMA
- How To Calculate a Simple Moving Average?
- Applications of the SMA in Financial Markets
- Trading Strategies Involving SMAs
- Advantages of SMA
- Limitations of SMA
- Comparison of SMA with Other Moving Averages
- Conclusion
- Frequently Asked Questions (FAQs)
Link copied!
Simple Moving Average (SMA)
A Simple Moving Average (SMA) is a technical analysis tool that calculates the average price of a security over a set number of periods. It smooths out price fluctuations and shows the overall direction of the market trend.
Key Takeaways
- Simple moving averages (SMAs) help traders understand market trends by calculating the average price of an asset over a specific time period.
- SMAs are slow to react to quick market changes because they use past prices, making them a lagging indicator.
- Traders use strategies like the golden cross and death cross, which compare short-term and long-term SMAs, to identify bullish or bearish trends.
- To reduce the limitations of SMAs, traders combine them with other indicators like RSI or use faster-moving averages like EMAs.
What Is a Simple Moving Average?
A Simple Moving Average (SMA) is a technical indicator that smooths out price data to highlight the overall direction of an asset’s trend. SMAs help traders and analysts identify the direction of a trend by filtering out short-term price fluctuations, providing a clearer view of the market’s movement.
Traders often use two moving averages of different timeframes to use their crossovers to depict the trend in the market.SMAs are straightforward indicators, but they lag because they do not respond to quick price fluctuations. Simple moving averages are less effective in volatile markets.
Key Characteristics of SMA
To understand the usefulness of the Simple Moving Average, it’s important to look at its core characteristics that define how it works and why traders rely on it:
Equal Weighting:
Every data point within the selected period is given the same weight, meaning all prices are treated equally in the calculation.
Trend Indicator:
SMA helps traders identify whether the market is in an uptrend, a downtrend, or moving sideways by showing the overall direction of prices.
Versatility:
It can be applied to various timeframes (daily, weekly, intraday) and across different asset classes, making it a widely used tool in technical analysis.
Smooths Price Movements:
By averaging prices, SMA reduces noise from short-term volatility, allowing traders to focus on the broader market trend.
Lagging Indicator:
Since SMA is based on past prices, it reacts slowly to sudden market changes, often confirming trends later than leading indicators.
How To Calculate a Simple Moving Average?
Calculating simple moving averages requires the closing price of the asset, and they are averaged out according to the time frame. Here is what the general SMA formula will look like:
Simple Moving Average or SMA = (P1 + P2 + P3 + … + Pn) / n
Where:
- P1, P2, P3, …, Pn = Prices over the last n periods
- n = Number of periods (e.g., 5, 10, or 20 days)
Example Calculation of SMA
Let’s consider Adani Green Energy’s last five closing prices (January 23, 2025)
Last five closing prices = 1,030.25, 1,031.70, 1,045.70, 1,066.75, 1,078.20.
- Add the prices: 1,030.25 + 1,031.70 + 1,045.70 + 1,066.75 + 1,078.20 = 5,252.60
- Divide the total by the number of periods (5): 5,252.60 ÷ 5 = 1,050.52
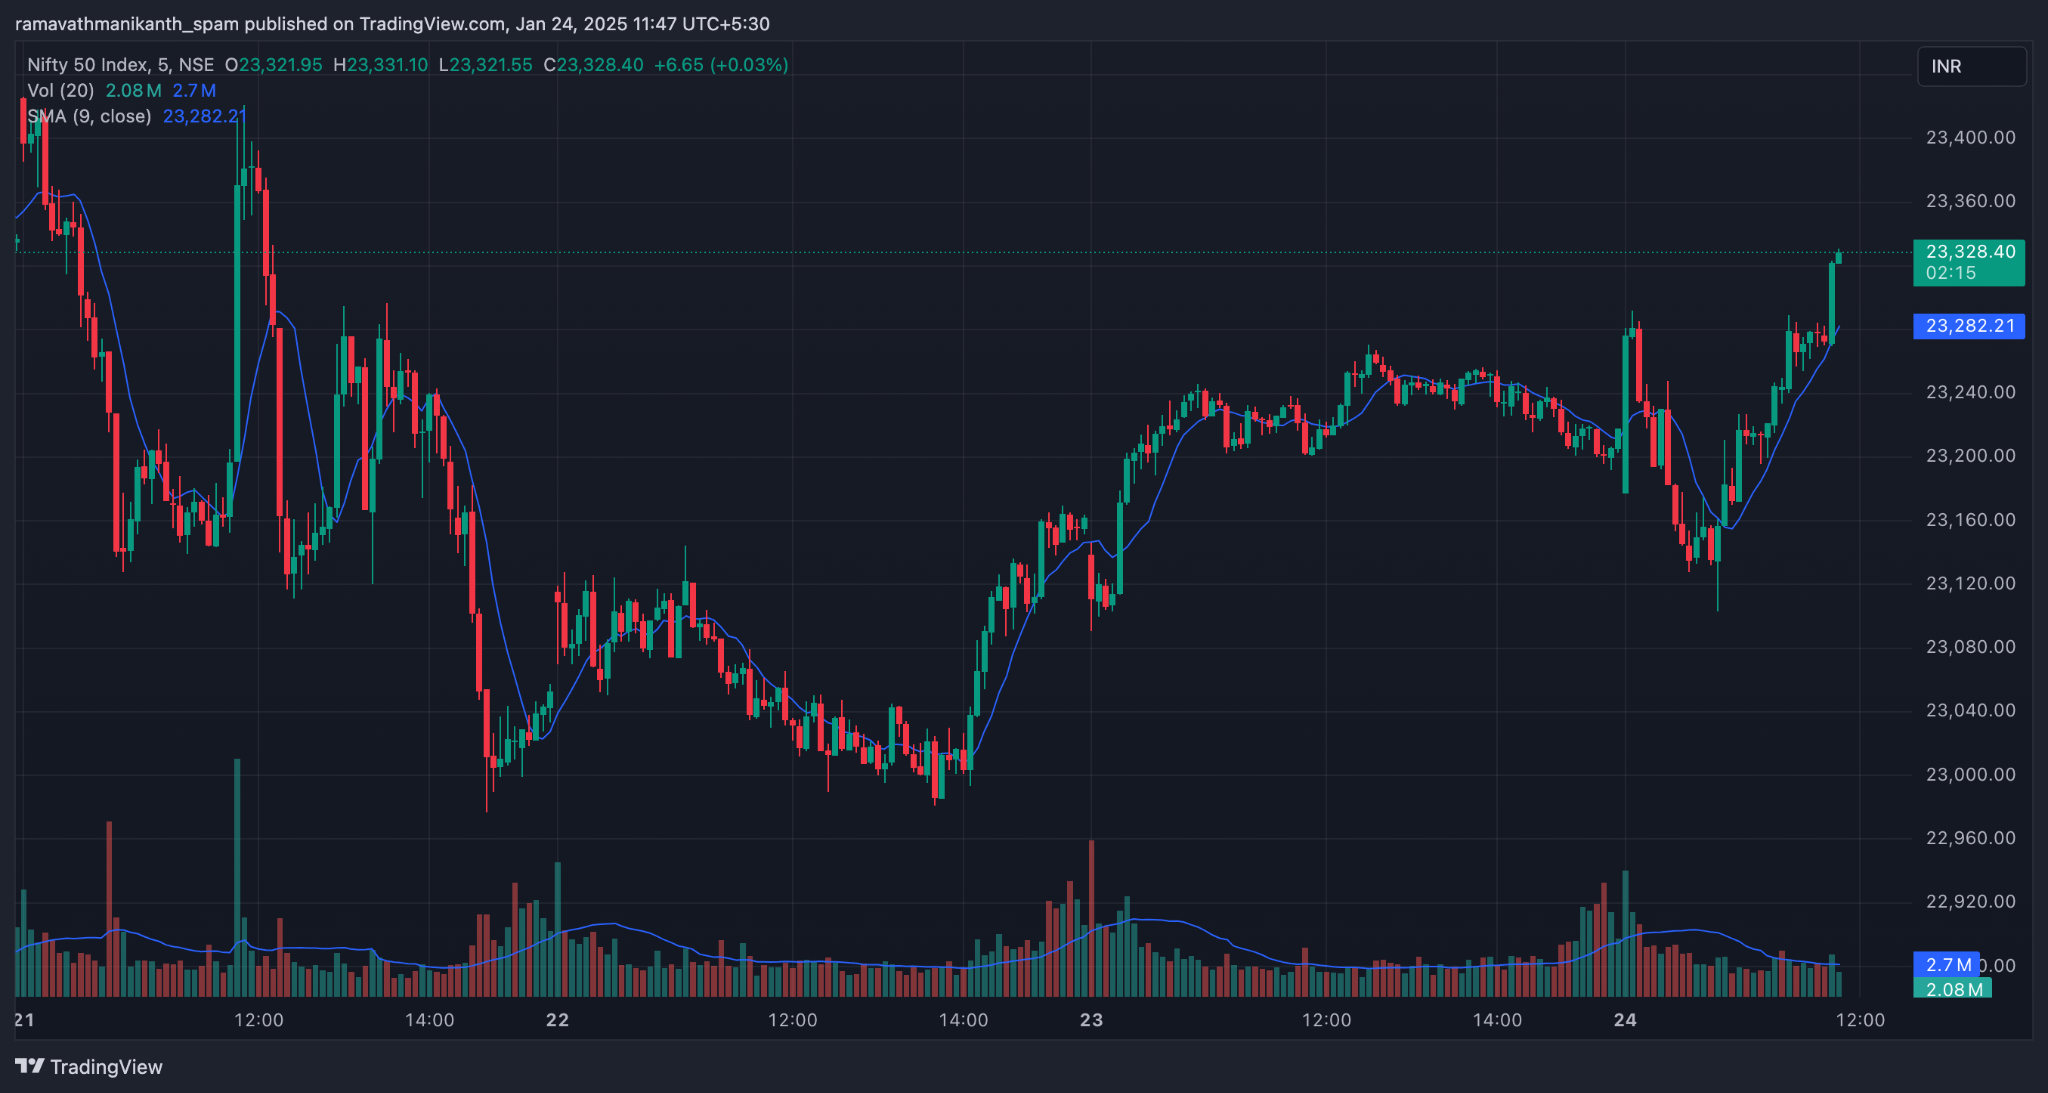
Each day’s average of the last five closing prices is calculated and plotted on a graph. If the SMA is increasing, it shows bullishness in the market, and if the SMA is declining, it shows bearishness.
Here is the image of the Simple Moving Average graph on the chart; the blue line on the candlesticks is a simple moving average indicator.
Applications of the SMA in Financial Markets
The Simple Moving Average (SMA) is a widely used tool in financial markets, valued for its simplicity and ability to smooth price data. Its applications go beyond just showing price averages, helping traders and investors make informed decisions. Some of the major uses include:
Trend Analysis:
SMA helps in identifying the overall market direction, whether an asset is trending upward, downward, or moving sideways.
Identifying Trading Signals:
SMA crossovers are commonly used to generate buy or sell signals. For instance, when a short-term SMA crosses above a long-term SMA, it is often considered a bullish indicator, and the reverse suggests a bearish signal.
Support and Resistance Levels:
SMAs can act as dynamic support or resistance, offering traders useful guidance for entry and exit points in the market.
Market Sentiment Indicator:
A rising SMA usually reflects bullish sentiment, while a declining SMA signals bearish market sentiment.
Risk Management:
Traders often use SMAs to confirm the strength of a trend before making a move, helping to reduce the chances of false signals and poor trade execution.
Trading Strategies Involving SMAs
SMAs help traders spot key signals by analysing how short-term and long-term averages interact. Popular simple moving average strategies based on this are the Golden Cross and the Death Cross.
Golden Cross
A Golden Cross occurs when the 50-day SMA crosses above the 200-day SMA. This crossover signals a shift from a downtrend to an uptrend and indicates bullishness in the market, often reflecting increased buying pressure on the underlying asset.
Death Cross
A Death Cross occurs when the 50-day SMA moves below the 200-day SMA. This crossover signals a shift from an uptrend to a downtrend and indicates bearish sentiment in the market, often reflecting increased selling pressure on the asset.
Both Golden and Death crossovers are effective in trending markets but are unreliable in sideways or choppy markets. To confirm trends, it is important for the traders to use SMAs alongside other indicators like RSI (Relative Strength Index) or MACD (Moving Average Convergence Divergence).
Selecting an Appropriate Time Frame
Choosing the right time frame is crucial when applying SMAs. A short-term SMA (such as a 10-day average) reacts quickly to price changes and is more suitable for active traders, but it can also be more volatile. A long-term SMA (such as a 100-day or 200-day average) reacts slowly, offering a smoother trend line that helps long-term investors filter out short-term noise.
Combining with Other Indicators
SMAs are often more effective when used alongside other technical indicators. For example, pairing SMA signals with the Relative Strength Index (RSI) or Moving Average Convergence Divergence (MACD) can help traders confirm trends and reduce false signals.
Dynamic Support and Resistance
In addition to crossovers, SMAs can act as dynamic support or resistance levels. Prices often bounce near the SMA, giving traders potential entry or exit points.
Advantages of SMA
The Simple Moving Average remains popular among traders and investors because of its ease of use and effectiveness in highlighting market trends. Some of the major advantages include:
Simplicity
The Simple Moving Average is easy to understand and apply, making it one of the most widely used tools in technical analysis, especially for beginners.
Trend Identification
SMA helps traders and investors quickly identify the overall market trend, whether bullish, bearish, or sideways, by smoothing out short-term price fluctuations.
Noise Reduction
By averaging price data, SMA filters out random market volatility, allowing traders to focus on the bigger picture.
Versatility
It can be applied across different timeframes (intraday, daily, weekly, and monthly) and works for various asset classes such as stocks, commodities, forex, and indices.
Support and Resistance Tool
SMAs often act as dynamic support and resistance levels, helping traders plan effective entry and exit points.
Widely Recognised
Since SMA is a common and well-accepted tool in financial markets, signals like the Golden Cross and Death Cross are closely watched by a large number of traders, increasing their reliability.
Limitations of SMA
While SMAs are useful, they have some inherent limitations that traders must be aware of:
Lagging Indicator:
SMAs are calculated using past closing prices, which means they react slowly to sudden market movements. This lag makes them less effective in capturing immediate price fluctuations.
Equal Weighting of Data:
Every price point in the selected period is given equal weight, which can dilute the significance of recent price changes and make SMAs less responsive compared to tools like the Exponential Moving Average (EMA).
Less Effective in Volatile Markets:
During high volatility, SMAs may give frequent false signals, making it difficult for traders to rely solely on them for decision-making.
Sensitivity to Outliers:
A sharp price movement (spike or dip) can distort the SMA line, giving a misleading impression of the overall trend.
Need for Confirmation with Other Indicators:
Relying solely on SMA can be risky. To overcome its drawbacks, traders often combine SMAs with other indicators such as RSI (Relative Strength Index), MACD (Moving Average Convergence Divergence), or EMA, which provide more timely and accurate insights.
Comparison of SMA with Other Moving Averages
Understanding how the Simple Moving Average (SMA) differs from other moving averages can help traders choose the most suitable tool for their strategy. Two commonly compared alternatives are the Exponential Moving Average (EMA) and the Weighted Moving Average (WMA)
|
Feature |
Simple Moving Average (SMA) |
Exponential Moving Average (EMA) |
Weighted Moving Average (WMA) |
|---|---|---|---|
|
Weighting |
Equal weight to all data points |
More weight to recent prices |
Linearly increasing weight to recent prices |
|
Responsiveness |
Slower to react to recent price changes |
Faster response to recent price changes |
Moderate response, faster than SMA but slower than EMA |
|
Lag |
Higher lag |
Lower lag |
Lower lag than SMA, slightly higher than EMA |
|
Best Use |
Long-term trend analysis, smoothing data |
Short-term trading signals, capturing recent trends |
Trend detection with emphasis on recent price movements |
|
Volatility Handling |
Less sensitive, more stable |
More sensitive, reacts quickly to volatility |
Sensitive to recent price changes, good for trend reversals |
|
Complexity |
Simple and easy to calculate |
Slightly more complex |
More complex than SMA, but simpler than the EMA formula-wise |
Conclusion
Simple moving averages (SMAs) are helpful in understanding market trends and the overall direction of an asset. They smooth out price changes, making it easier to see long-term movements. However, SMAs are slow to react to sudden price changes, which can make them less effective in fast or unpredictable markets.
To overcome this, traders often use other tools like exponential moving averages (EMAs) or combine SMAs with indicators like RSI or MACD. Even with some limitations, SMAs are simple and reliable tools that help traders make better decisions about market trends.
Frequently Asked Questions (FAQs)
What is the simple moving average formula?
The SMA is calculated by adding up the prices of an asset over a specific number of periods and dividing the total by the number of periods. The formula is:
SMA = (P₁ + P₂ + P₃ + … + Pₙ) / n
Here, P represents the price for each period, and n is the total number of periods. This gives the average price over the selected period and helps identify the overall trend in the market.
Is SMA a good indicator?
Yes, the Simple Moving Average (SMA) is a useful indicator for identifying trends and smoothing price movements. It works well in trending markets but may give delayed signals due to its lagging nature. Traders often combine SMA with other indicators to improve accuracy and reduce false signals.
Which is better, SMA or EMA?
Both are useful, but EMA reacts faster to price changes, making it better for short-term trends. SMA is better for a simple view of long-term trends.
How to use SMA as an indicator?
SMA shows the average price over time to identify trends. If it goes up, it means the market is bullish, and if it goes down, it means the market is bearish.
Disclaimer: This content is for educational purposes only and does not constitute financial or investment advice. Investments in securities or other financial instruments are subject to market risk, including partial or total loss of capital. Past performance is not indicative of future results. Always consider your financial situation carefully and consult a licensed financial advisor before making investment or trading decisions.
Table of Content
- Key Takeaways
- What Is a Simple Moving Average?
- Key Characteristics of SMA
- How To Calculate a Simple Moving Average?
- Applications of the SMA in Financial Markets
- Trading Strategies Involving SMAs
- Advantages of SMA
- Limitations of SMA
- Comparison of SMA with Other Moving Averages
- Conclusion
- Frequently Asked Questions (FAQs)
Engineered for the obsessed. Built for traders.

Purpose-built terminals.
Zero compromise.
Built for speed.
Plot No 1290, 2nd Floor, 17th Cross, 5th Main, Sector-7, HSR Layout, Bangalore 560102
Follow us on
Mintcap Brokers Private Limited
CIN – U66110KA2023PTC178706 | Registered Address: Plot No 1290, Second Floor, 17th Cross, 5th Main, Sector-7, HSR Layout, Bangalore 560102 | Tel: 080 – 49552310 | Email ID: compliance@capmint.com | SEBI registered Stock Broker: INZ000322732 | NSE Cash/F&O Member ID: 90430 | BSE Cash/F&O Member ID: 6903 | MCX Member ID: 57400 | NCDEX Member ID: 1312 | SEBI registered Depository Participant: IN-DP-806-2025 | CDSL DP ID: 12102300 | NSE Clearing Member code: M70108 | AMFI-Registered Mutual Fund Distributor: ARN-289109 (Valid upto 28-Feb-2027) | Category II Execution Only Platform : E6903
Details of Client Bank Account
Compliance Officer: Ms. Shridevi Vungarala | Email ID: compliance@capmint.com | Tel no. + 91 9035330126 | Grievance Redressal Officer (GRO) – Ms. Shikha Gupta | Email ID: Grievance@capmint.com | Tel no: 9035331595.
Procedure to file a complaint on SEBI SCORES: Register on SCORES portal. Mandatory details for filing complaints on SCORES: Name, PAN, Address, Mobile Number, E-mail ID. Benefits: Effective Communication, Speedy redressal of the grievances. You may refer the website https://scores.sebi.gov.in/ for more information. You may also download the SEBI Scores app to log a complaint Android: https://play.google.com > store > apps > sebiscores iOS: https://apps.apple.com > app > sebiscores
Disclaimer
Investment in the securities market are subject to market risks, read all the related documents carefully before investing. Brokerage will not exceed the SEBI prescribed limit.
Mutual fund investments are subject to market risks, read all scheme related documents carefully before investing. Mutual Funds are not exchange-traded products.
Attention Investor:
- Stock Brokers can accept securities as margin from clients only by way of pledge in the depository system w.e.f. September 1, 2020.
- Update your mobile number & email Id with your stock broker/depository participant and receive OTP directly from depository on your email id and/or mobile number to create pledge.
- Pay 20% as upfront margin of the transaction value to trade in cash market segment.
- Investors may please refer to the Exchange’s Frequently Asked Questions (FAQs) issued vide circular reference NSE/INSP/45191 dated July 31, 2020 and NSE/INSP/45534 dated August 31, 2020 and other guidelines issued from time to time in this regard.
- Check your Securities /MF/ Bonds in the consolidated account statement issued by NSDL/CDSL every month.