
Table of Content
- Key Takeaways
- What is Fibonacci Retracement?
- How to Use Fibonacci Retracement Levels
- Fibonacci Retracement in Real Trading
- Fibonacci Confluence
- Common Fibonacci Trading Setups
- Which Fibonacci Level Is Most Likely to Hold?
- Limitations of Fibonacci Retracement
- Why Fibonacci Retracement Works
- Conclusion
- Frequently Asked Questions (FAQs)
Link copied!
Fibonacci Retracement
Fibonacci retracement is a widely used technical analysis tool that traders use to identify potential support and resistance levels. Based on the famous Fibonacci sequence, this tool helps forecast the likely levels where a stock might reverse its trend.
Key Takeaways
- Fibonacci Retracement Identifies Key Support and Resistance Levels: Fibonacci retracement levels like 38.2%, 50%, and 61.8% are used to pinpoint potential reversal zones in trending markets, helping traders make informed entry and exit decisions.
- Drawing Retracement Levels Is Subjective but Powerful: The effectiveness of Fibonacci retracement depends on selecting the correct swing highs and lows, which can vary between traders, yet the method remains widely used for its clarity and structure.
- Best Used With Other Indicators: To improve accuracy and reduce false signals, traders often combine Fibonacci retracement with other tools such as RSI, MACD, trendlines, and candlestick patterns.
- It Reflects Market Psychology: The power of Fibonacci retracement lies in its widespread use; because many traders watch these levels, they often act as psychological price barriers, making them more reliable over time.
What is Fibonacci Retracement?
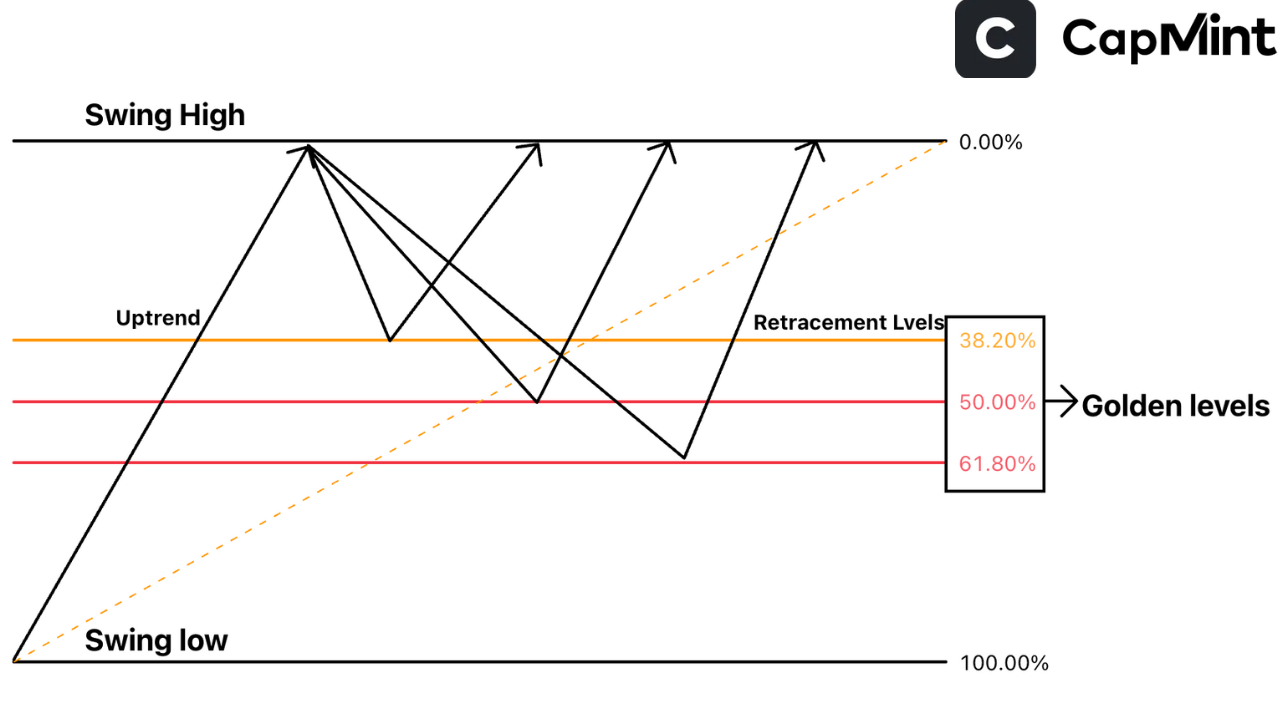
The Fibonacci retracement strategy is a method of technical analysis for determining support and resistance levels. The tool uses horizontal lines to indicate areas of support or resistance at the key Fibonacci levels before the price continues in its original direction.

These key levels include 23.6%, 38.2%, 50%, 61.8%, and 78.6%, derived from the Fibonacci sequence, of which traders mostly follow 38.2%, 50%, and 61.8%. These percentages indicate how much of a prior move the price has retraced. For example, after a significant price increase, traders anticipate the asset to retrace to one of these levels before continuing upward.
The 61.8% level, often called the “golden ratio,” receives the most attention because it appears repeatedly in natural patterns and has become deeply embedded in trading culture. On Indian markets, Nifty 50 pullbacks during broader uptrends frequently find support near the 50% or 61.8% retracement of the preceding swing, making these levels a practical starting point for analysing corrections. That said, the price doesn’t always respect these levels precisely. It may reverse a few points above or below the calculated level, which is why treating them as zones (a band of ₹10–20 on a stock or 20–30 points on Nifty) rather than exact lines produces more realistic expectations.
How to Use Fibonacci Retracement Levels
Fibonacci retracement levels are plotted by selecting the high and low points on a chart. The levels are drawn between a significant price high and low, and the retracement levels are marked based on Fibonacci ratios.
In an uptrend
Draw from the swing low to the swing high. The retracement levels then appear below the high, marking potential support zones where the pullback might stall.
In a downtrend
Draw from the swing high to the swing low. The retracement levels appear above the low, marking potential resistance zones where a bounce might fade.
If a stock rises from ₹100 to ₹150, and starts pulling back, traders might expect it to find support at the 38.2% level (₹130.9), the 50% level (₹125), or the 61.8% level (₹119.1). These levels become zones where price action is expected to pause or reverse, thus helping traders plan entries and exits more effectively.
The critical step in this process is selecting the correct swing high and swing low. This is where most of the subjectivity enters. A swing high should be a clearly defined peak where the price reversed downward, and a swing low should be a clearly defined trough where the price reversed upward. Using minor intraday fluctuations as anchor points rather than genuine swing pivots produces unreliable levels. On daily charts, the swing points should be visible without zooming in, and they should represent genuine turning points in the trend rather than minor noise within a larger move.
Most charting platforms on Indian brokers have a built-in Fibonacci retracement tool that automatically calculates and plots all the levels once you select the two anchor points.
Fibonacci Retracement in Real Trading
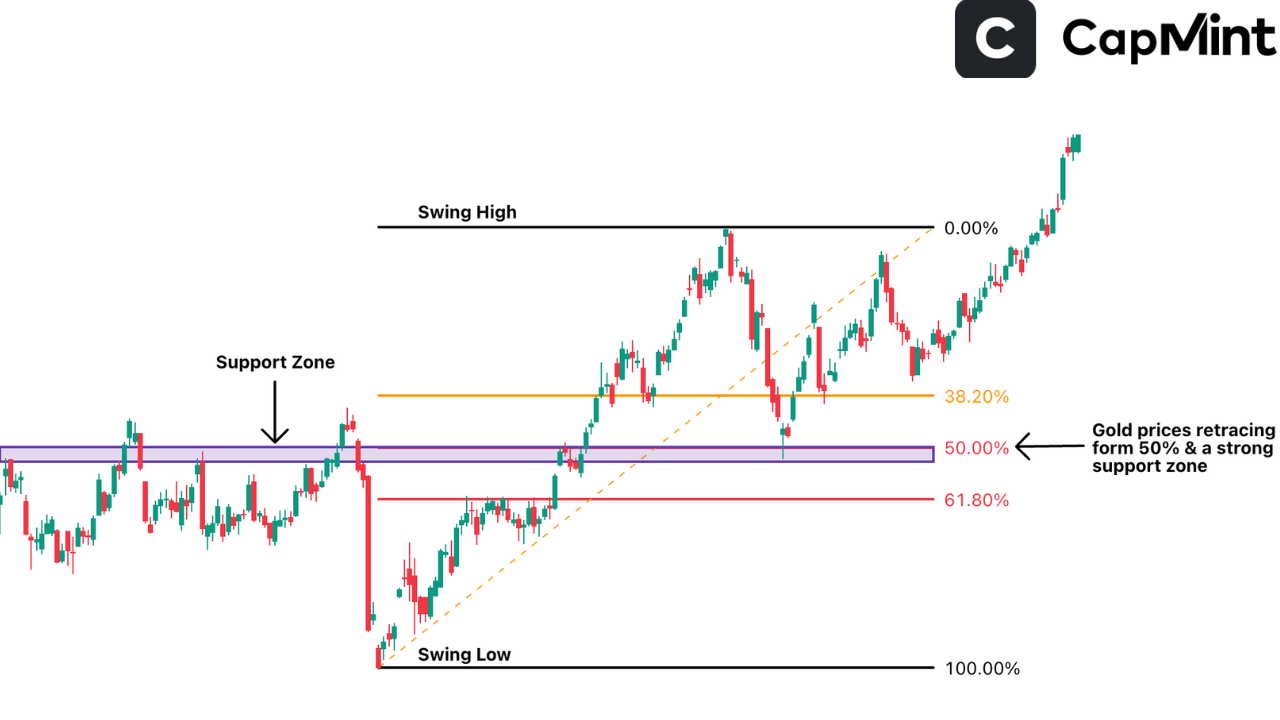
Fibonacci retracement levels work best in trending markets. For example, during an uptrend, a stock might pull back to the 50% level and resume its upward move, creating an opportunity to buy on a dip.
In practice, the way experienced traders use Fibonacci levels is not by placing a buy order blindly at, say, the 61.8% level. Instead, they watch for price action confirmation at or near the level before entering. If a stock pulls back to the 50% retracement and forms a bullish candlestick pattern like a hammer or a Morning Star at that level, the confluence of the Fibonacci support and the candlestick signal creates a higher-probability setup than either signal alone.
To improve accuracy, many traders combine the Fibonacci retracement indicator with other tools like trendlines, candlestick patterns, volume indicators, and horizontal support zones. It’s also common to pair Fibonacci levels with momentum indicators like RSI or MACD to build more reliable trade setups. A particularly useful combination is checking whether the RSI is in oversold territory (below 30–35) at the same time the price reaches a key Fibonacci retracement level. When both conditions align, the probability of a bounce increases meaningfully.
Fibonacci Confluence
One of the more practical applications is identifying “Fibonacci confluence” zones, where a retracement level from one swing aligns closely with a retracement level from a different swing, or where a Fibonacci level coincides with a horizontal support/resistance level, a moving average, or a trendline. When multiple technical references point to the same price zone, that area tends to act as a stronger barrier.
On Nifty 50, for instance, when a 50% retracement level from a recent swing coincides with the 200-day moving average within a 20–30 point range, that zone often produces a noticeable reaction in price.
Fibonacci Extensions
While retracement levels help identify where a pullback might end, Fibonacci extensions (127.2%, 161.8%, 261.8%) help project where the next leg of the trend might reach after the pullback completes. These are used for setting profit targets. If a stock retraces to the 50% level and resumes its uptrend, traders might target the 127.2% or 161.8% extension of the retracement move as their exit point. Extensions are less discussed than retracements, but are equally practical for trade management once a position has been entered.
While powerful, Fibonacci retracement should not be used in isolation. Always wait for price action confirmation before entering a trade. Additionally, it’s important to understand that Fibonacci retracement does not provide exact entry or exit points. It highlights potential reversal zones, making proper risk management and the use of stop-losses critical to a sound trading strategy.
Common Fibonacci Trading Setups
Pullback Entry in an Uptrend
This is the most straightforward application. A stock is in a clear uptrend, pulls back, and approaches a key Fibonacci level (typically 38.2%, 50%, or 61.8%). The trader waits for price action confirmation at the level and enters a long position with a stop-loss below the next Fibonacci level or below the swing low.
For example, if a Nifty 50 stock rallies from ₹800 to ₹1,000 and then pulls back to ₹923 (the 38.2% retracement), a trader might look for a bullish candle at that level, enter long, and place a stop-loss below ₹900 (the 50% level) or below ₹876 (the 61.8% level), depending on risk tolerance. The profit target could be the prior high at ₹1,000 or a Fibonacci extension above it.
Bounce Fade in a Downtrend
The inverse setup. A stock is in a downtrend, bounces, and approaches a Fibonacci resistance level. The trader waits for rejection at the level and enters a short position. This setup is common during bear market rallies, where stocks retrace 38.2–50% of their decline before resuming the downtrend.
Multiple Timeframe Fibonacci
Drawing Fibonacci retracement on a weekly chart and then switching to a daily chart to refine the entry can improve precision. A weekly 50% retracement level might define the broad zone of interest, while a daily chart candlestick pattern at that level provides the specific entry trigger. This multi-timeframe approach reduces the noise that single-timeframe analysis sometimes produces.
Which Fibonacci Level Is Most Likely to Hold?
There is no universal answer, as the level that holds depends on the strength of the underlying trend and the broader market context. However, some general tendencies are worth noting:
38.2% retracement
Shallow pullbacks that retrace only to the 38.2% level typically occur in strong trends where buyers (or sellers, in a downtrend) are eager to re-enter. If a stock finds support at 38.2% and resumes the trend, it often signals that the underlying momentum is robust.
50% retracement
This is the most commonly watched level and often acts as the dividing line between a healthy pullback and a deeper correction. Many institutional traders use the 50% level as a reference for adding to positions during corrections in stocks they already hold.
61.8% retracement
Pullbacks that extend to the 61.8% level represent a deeper correction, and while they can still lead to trend resumption, the probability of the prior trend continuing starts to diminish. If the price breaks below the 61.8% level convincingly, many traders treat it as a signal that the original trend may have ended rather than just paused.
78.6% retracement
A pullback this deep essentially retraces most of the original move. At this point, the distinction between a pullback within a trend and a full reversal becomes blurred. The 78.6% level is used less frequently but can serve as a last-resort support/resistance level before the entire move is unwound.
Limitations of Fibonacci Retracement
Even though Fibonacci retracement is widely used and visually simple, it’s not foolproof. Like any technical tool, it has its own set of limitations that traders should keep in mind before relying solely on it.
Subjectivity in Drawing Levels
The accuracy of Fibonacci retracement depends heavily on selecting the correct swing high and low. Different traders may draw different levels based on varying interpretations, which can result in inconsistent signals. Two traders analysing the same stock can arrive at different retracement levels if one uses a slightly different swing low than the other. On stocks with multiple swing points within a larger trend, the choice of which swing to anchor the Fibonacci from can produce meaningfully different levels. A practical approach is to use the most prominent and widely visible swing points on the chart, since these are the ones most market participants are likely to reference, making the resulting levels more relevant.
False Signals in Sideways Markets
Fibonacci levels are most effective in trending markets. In a sideways or choppy market, prices may whipsaw through multiple Fibonacci levels without establishing clear support or resistance, leading to false signals. If a stock has been range-bound for several weeks, drawing Fibonacci retracement within that range produces levels that lack the directional context the tool relies on. Using Fibonacci only when there is a clear and identifiable trend to measure retracements against is a basic but important discipline.
No Guarantee of Reversal
While the retracement levels mark potential reversal zones, the price may not always respect them. The asset could break through all Fibonacci levels and continue moving in the same direction. This is particularly common during strong momentum-driven moves or when a fundamental catalyst, such as an earnings surprise or sector-wide news, overrides technical levels. Fibonacci levels suggest where a reversal is more likely, not where it will definitely occur. The distinction between probability and certainty is critical for managing expectations and risk.
Needs Confluence with Other Indicators
On its own, Fibonacci retracement lacks context. A 50% retracement level without any other supporting signal is just a number on the chart. Traders should always confirm with other technical tools, such as RSI, MACD, trendlines, or candlestick patterns, to improve reliability and reduce the chances of acting on weak setups. The most dependable Fibonacci trades are those where the retracement level coincides with at least one additional independent technical reference.
Because of these limitations, proper risk management, including stop-loss placement and position sizing, remains essential to successful trading with Fibonacci retracements. A stop-loss placed just below the next Fibonacci level (e.g., below the 61.8% level if entering near the 50% level) provides a structured and logical exit point if the retracement continues beyond the expected zone.
Why Fibonacci Retracement Works
Fibonacci retracement works due to a combination of mathematical logic and market psychology. The key Fibonacci ratios like 38.2%, 50%, and 61.8% are derived from the Fibonacci sequence, a naturally occurring pattern observed in nature, architecture, and art. When applied to financial markets, these ratios tend to reflect areas where many traders anticipate potential reversals or consolidation zones.
One reason for its effectiveness is collective trader behaviour. As countless traders and algorithms reference these retracement levels, they develop into widely watched price zones. This makes them more likely to act as barriers or magnets for price, creating self-fulfilling dynamics. When thousands of traders place buy orders near the 61.8% retracement of a Nifty swing, that concentrated order flow creates genuine support, regardless of whether the 61.8% ratio has any intrinsic predictive power. The belief itself produces the effect.
Additionally, Fibonacci levels offer a consistent and logical framework for analysing retracements and extensions within price trends. They are applicable across multiple timeframes, making them adaptable for all types of traders, from scalpers and intraday traders to long-term investors. This universality means that Fibonacci levels drawn on a weekly chart by a mutual fund manager and those drawn on a 15-minute chart by a day trader can both be influencing price at the same time, creating layers of support or resistance.
While Fibonacci retracement isn’t a guarantee of future price action, its effectiveness lies in the recurring patterns of market psychology and its structured, universally recognised levels. When combined with other technical tools, it becomes a practical component of a broader analytical framework.
Conclusion
Fibonacci retracement is a time-tested tool that provides structure to price analysis and helps traders spot potential reversal zones in trending markets. While it’s not foolproof and should never be used in isolation, its combination of mathematical logic and crowd psychology makes it a practical component of any technical trader’s toolkit. The tool’s greatest value lies not in predicting exact turning points, but in narrowing down the range of prices where a reversal is most likely, allowing traders to focus their attention and manage their risk around specific, well-defined zones. When applied correctly and with proper risk management, Fibonacci retracement can meaningfully improve trade timing and strategy.
Frequently Asked Questions (FAQs)
How do I draw Fibonacci retracement levels on a chart?
You select the most recent significant swing high and swing low on the chart. In an uptrend, you draw from low to high; in a downtrend, from high to low. Most charting platforms like TradingView, Zerodha Kite, or Angel One have a built-in Fibonacci retracement tool that plots all the levels automatically once you select the two anchor points. The key to getting useful levels is choosing genuinely significant swing points that are visible on the chart without zooming in, rather than minor intraday fluctuations.
Which Fibonacci levels are most important for trading?
The most commonly used levels are 38.2%, 50%, and 61.8%. These are considered the most likely zones where price may pause, reverse, or consolidate before continuing its trend. Among these, the 50% and 61.8% levels tend to receive the most attention from institutional and algorithmic traders. The 23.6% level is considered too shallow for most trading purposes, while the 78.6% level represents such a deep retracement that the original trend’s validity is already in question.
Can I use Fibonacci retracement for short-term trading?
Yes, Fibonacci retracement is effective across multiple timeframes, whether you’re a scalper, day trader, or swing trader. For intraday trading on Indian markets, Fibonacci levels drawn on 15-minute or hourly charts of Nifty or Bank Nifty can highlight short-term support and resistance zones within the session. The key is to align the tool with the timeframe you’re trading and confirm with other indicators. On very short timeframes (1-minute or 3-minute charts), the levels become noisier and less reliable, as minor price fluctuations can produce swing points that don’t represent genuine shifts in supply and demand.
Is Fibonacci retracement reliable on its own?
Not entirely. While it’s a helpful guide, it’s best used with confirmation from other tools like RSI, MACD, candlestick patterns, or volume analysis. It highlights potential reversal zones, not guaranteed turning points. The difference between a Fibonacci level that holds and one that breaks often comes down to whether additional confirming factors are present. A 50% retracement level where a bullish hammer candle forms on rising volume near a prior horizontal support is a significantly more reliable setup than the same 50% level in isolation with no other supporting evidence.
How do I set a stop-loss when trading with Fibonacci levels?
A common approach is to place the stop-loss just below the next Fibonacci level beyond your entry point. For example, if you enter a long trade near the 50% retracement, a stop-loss just below the 61.8% level provides a logical exit if the pullback deepens beyond your expected reversal zone. If you enter near the 61.8% level, the stop-loss would go below the 78.6% level or below the swing low itself. The exact placement should account for the stock’s typical daily range to avoid getting stopped out by normal volatility. Adding a buffer of 0.5–1% beyond the Fibonacci level, rather than placing the stop exactly on it, helps accommodate the imprecision that is inherent in all technical levels.
Disclaimer: This content is for educational purposes only and does not constitute financial or investment advice. Investments in securities or other financial instruments are subject to market risk, including partial or total loss of capital. Past performance is not indicative of future results. Always consider your financial situation carefully and consult a licensed financial advisor before making investment or trading decisions.
Table of Content
- Key Takeaways
- What is Fibonacci Retracement?
- How to Use Fibonacci Retracement Levels
- Fibonacci Retracement in Real Trading
- Fibonacci Confluence
- Common Fibonacci Trading Setups
- Which Fibonacci Level Is Most Likely to Hold?
- Limitations of Fibonacci Retracement
- Why Fibonacci Retracement Works
- Conclusion
- Frequently Asked Questions (FAQs)
Engineered for the obsessed. Built for traders.

Purpose-built terminals.
Zero compromise.
Built for speed.
Plot No 1290, 2nd Floor, 17th Cross, 5th Main, Sector-7, HSR Layout, Bangalore 560102
Follow us on
Mintcap Brokers Private Limited
CIN – U66110KA2023PTC178706 | Registered Address: Plot No 1290, Second Floor, 17th Cross, 5th Main, Sector-7, HSR Layout, Bangalore 560102 | Tel: 080 – 49552310 | Email ID: compliance@capmint.com | SEBI registered Stock Broker: INZ000322732 | NSE Cash/F&O Member ID: 90430 | BSE Cash/F&O Member ID: 6903 | MCX Member ID: 57400 | NCDEX Member ID: 1312 | SEBI registered Depository Participant: IN-DP-806-2025 | CDSL DP ID: 12102300 | NSE Clearing Member code: M70108 | AMFI-Registered Mutual Fund Distributor: ARN-289109 (Valid upto 28-Feb-2027) | Category II Execution Only Platform : E6903
Details of Client Bank Account
Compliance Officer: Ms. Shridevi Vungarala | Email ID: compliance@capmint.com | Tel no. + 91 9035330126 | Grievance Redressal Officer (GRO) – Ms. Shikha Gupta | Email ID: Grievance@capmint.com | Tel no: 9035331595.
Procedure to file a complaint on SEBI SCORES: Register on SCORES portal. Mandatory details for filing complaints on SCORES: Name, PAN, Address, Mobile Number, E-mail ID. Benefits: Effective Communication, Speedy redressal of the grievances. You may refer the website https://scores.sebi.gov.in/ for more information. You may also download the SEBI Scores app to log a complaint Android: https://play.google.com > store > apps > sebiscores iOS: https://apps.apple.com > app > sebiscores
Disclaimer
Investment in the securities market are subject to market risks, read all the related documents carefully before investing. Brokerage will not exceed the SEBI prescribed limit.
Mutual fund investments are subject to market risks, read all scheme related documents carefully before investing. Mutual Funds are not exchange-traded products.
Attention Investor:
- Stock Brokers can accept securities as margin from clients only by way of pledge in the depository system w.e.f. September 1, 2020.
- Update your mobile number & email Id with your stock broker/depository participant and receive OTP directly from depository on your email id and/or mobile number to create pledge.
- Pay 20% as upfront margin of the transaction value to trade in cash market segment.
- Investors may please refer to the Exchange’s Frequently Asked Questions (FAQs) issued vide circular reference NSE/INSP/45191 dated July 31, 2020 and NSE/INSP/45534 dated August 31, 2020 and other guidelines issued from time to time in this regard.
- Check your Securities /MF/ Bonds in the consolidated account statement issued by NSDL/CDSL every month.