
Link copied!
Candlesticks
Candlesticks are a type of chart used in trading that show the price movement of a stock or asset over a specific time period, such as 1 minute, 1 hour, or 1 day. Each candlestick displays the opening, closing, highest, and lowest prices, helping traders understand price action and market sentiment.
Key Takeaways
- Candlesticks are a type of chart used in trading that shows the opening, closing, highest, and lowest prices of a stock or asset during a specific time, like 1 minute, 1 hour, or 1 day.
- The shape and colour of each candlestick tell you if buyers or sellers were stronger. A green candle means the price went up, and a red candle means the price went down. This makes it easy to understand market movements quickly.
- By learning to read candlesticks, you can spot new trends early, understand the market’s mood, and make smarter trading decisions, whether you are trading for a few minutes or investing for the long term.
What Are Candlesticks?
Candlesticks are a popular charting method used in trading to visually represent the price movement of a stock or any other financial asset over a specific period. This time frame can vary depending on the trader’s preference; it could be as short as one minute or as long as one day, week, or even a month. Each candlestick gives a snapshot of how the price behaved during that time frame, making it easier to understand market trends and investor sentiment at a glance.
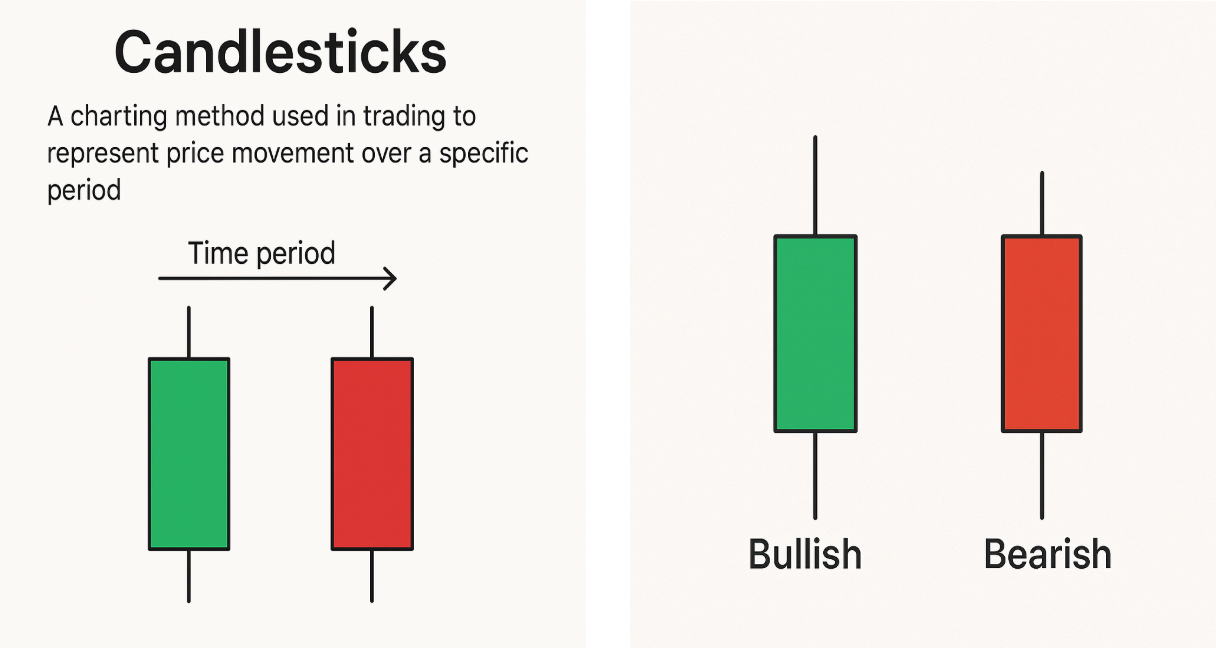
If the closing price is higher than the opening price, the candle is usually shown in green (bullish), indicating upward movement. If the closing price is lower, it’s shown in red (bearish), indicating a decline. This visual format helps traders quickly interpret price action and make informed decisions.
Reading A Candlestick Pattern
Understand the four key price points that form every candlestick.
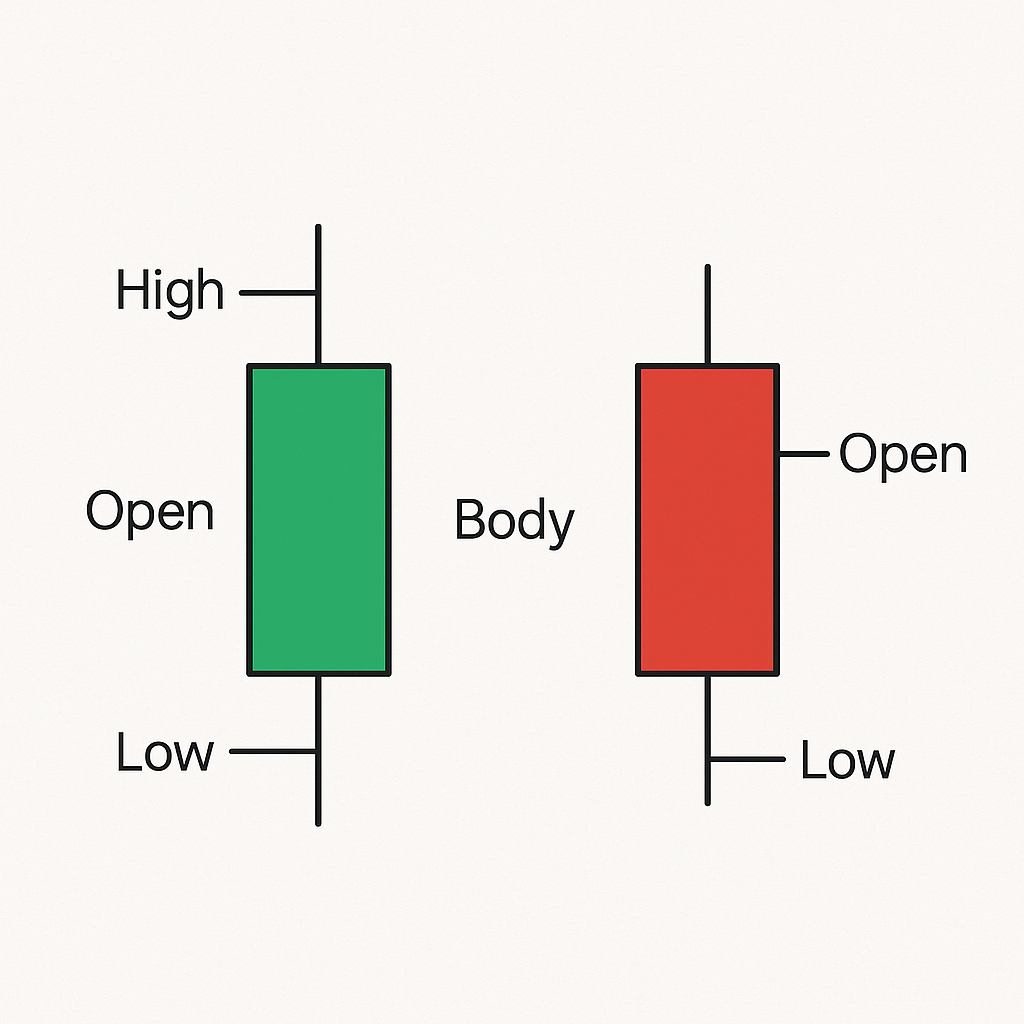
O – Open
The price at which the asset first traded when the period started.
H – High
The highest price the asset reached during the period.
L – Low
The lowest price the asset dropped to during the period.
C – Close
The price at which the asset last traded when the period ended.
Example: If the price opens at ₹100, goes to ₹110, falls to ₹95, and closes at ₹105, it shows buying strength despite intraday volatility.
Advantages Of Candlesticks
Now that you know how to read candlesticks, let’s look at why they are so powerful for traders.
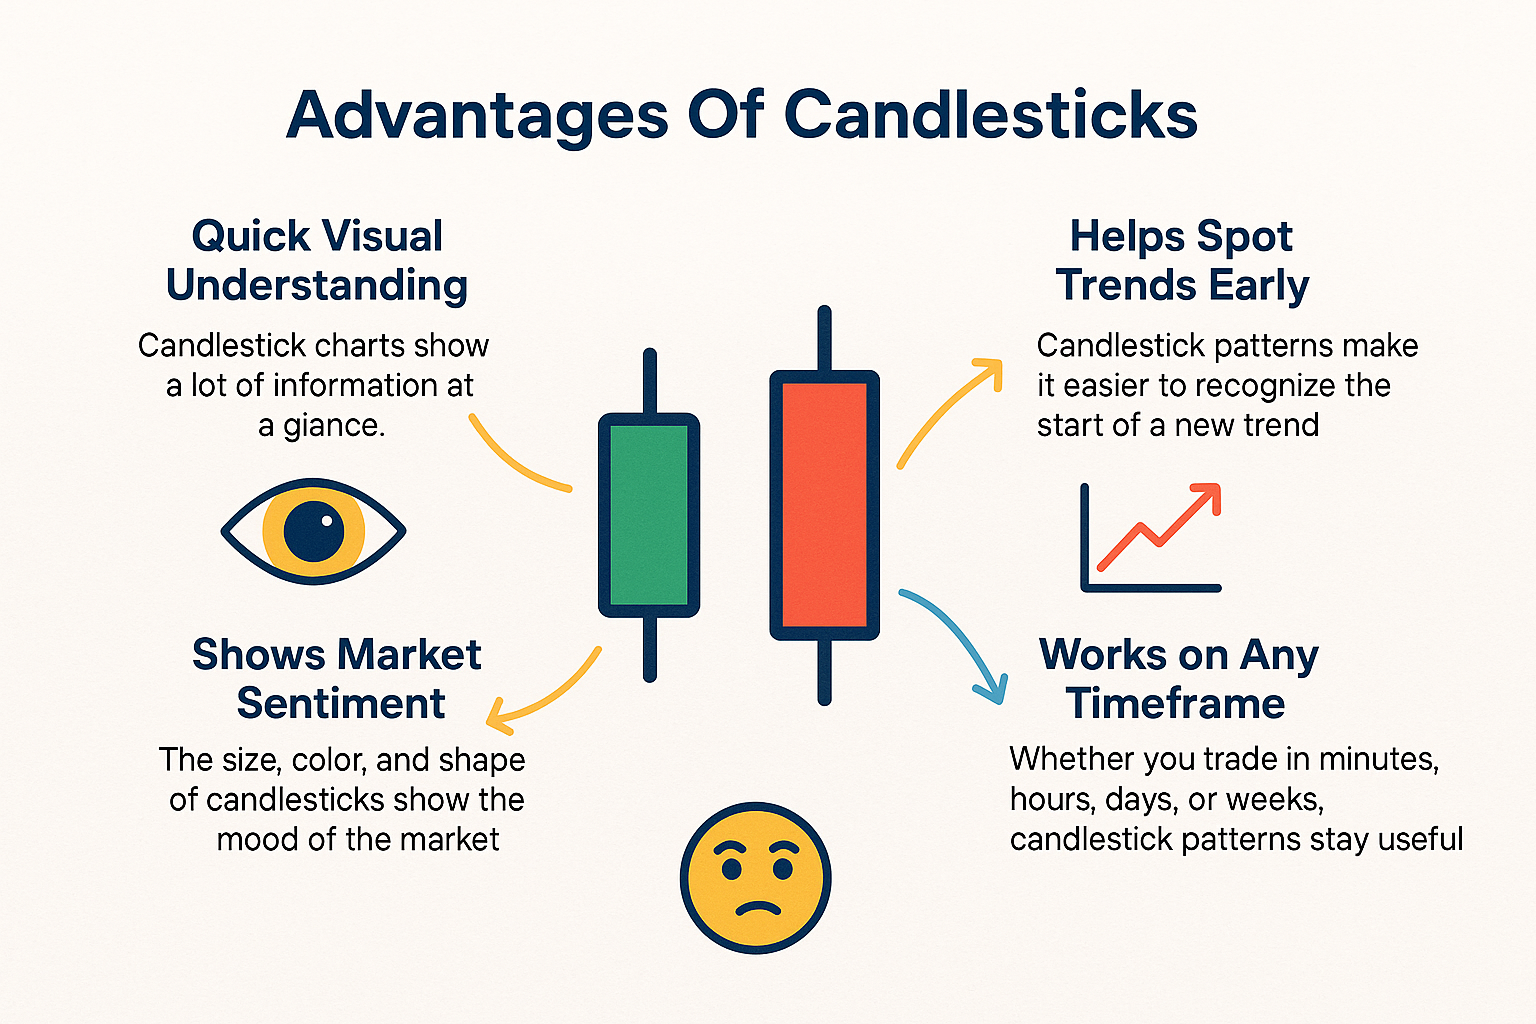
Quick Visual Understanding
Candlestick charts show a lot of information at a glance. You can quickly see whether buyers or sellers are stronger and how the price moved during the period, without reading numbers. This saves time compared to bar charts or line charts. The colour and size of candles immediately hint at whether the market was strong or weak.
Helps Spot Trends Early
Candlestick patterns make it easier to recognise the start of a new trend or a reversal. Traders can catch uptrends, downtrends, or sideways markets early and plan better entries. Patterns like bullish engulfing or hammer give early signals. Identifying trends faster can mean better profits and lower risks.
Shows Market Sentiment
The size, colour, and shape of candlesticks show the mood of the market, whether people are feeling greedy, fearful, uncertain, or confident. This helps in making smarter trading decisions. Large green candles often show strong buying interest, while small candles with long wicks can show confusion or hesitation.
Works on Any Timeframe
Whether you trade in minutes, hours, days, or weeks, candlestick patterns stay useful. The same basic reading applies across all timeframes, making them flexible for different types of traders. This makes candlestick analysis helpful for day traders, swing traders, and long-term investors alike.
Example: A bullish engulfing pattern after a downtrend can signal the start of a new upward move.
Limitations of Candlestick
While candlesticks are useful, they also have some limitations:
Not Always Accurate
Candlestick patterns can give false signals, especially in volatile or sideways markets.
Example: A hammer in a sideways market may fail to reverse the trend.
Needs Confirmation
A single candlestick is not enough. Traders should confirm signals using indicators like volume, RSI, or support and resistance levels.
Context Matters
The same pattern can have different meanings depending on where it appears in the trend.
Short-Term Focus
Candlesticks mainly reflect short-term price movements and may not always indicate long-term trends.
Conclusion
Candlestick charts are a simple yet powerful tool for traders. They help you quickly understand price movements, trends, and market emotions. By learning how to read them, you can make smarter trading decisions. No matter your style or timeframe, candlesticks give useful insights across all types of markets.
Frequently Asked Questions (FAQs)
What is the 5 candle rule?
The 5 candle rule is a trading strategy where traders wait for five consecutive candlesticks to confirm a trend before making a decision. It helps reduce false signals by ensuring the trend is strong and not just a short-term movement.
What are the 42 candlestick patterns?
There are 42 recognised candlestick patterns used in technical analysis. These patterns include single, double, and multiple candlestick formations, helping traders identify trend reversals or continuations. Some common ones are the doji, hammer, engulfing pattern, morning star, and evening star.
What is the 3-hour candle rule?
The 3-hour candle rule is used in intraday trading, where traders analyse a 3-hour candlestick to understand market trends. It helps identify key price movements and possible breakouts, making it useful for short-term trading decisions.
How does a candle work in trading?
A candlestick shows the open, high, low, and close prices of an asset within a specific time period. The body represents the open and close, while the wicks show the highest and lowest prices reached.
Example: A stock opening at ₹100 and closing at ₹105 forms a green candle showing buying strength.
How do you read candlesticks for beginners?
Beginners can read candlesticks by focusing on colour, body size, and wicks. Green candles indicate buying pressure, red candles indicate selling, and wick size shows rejection or indecision.
Example: A long green candle shows strong buying, while small candles with long wicks show indecision.
Which candlestick is best for trading?
There is no single best candlestick. Patterns like engulfing, hammer, and doji are widely used as they help identify trend reversals or continuation based on market context.
Which candle is best for intraday trading?
Strong momentum candles, like breakout or engulfing candles, are preferred for intraday trading, as they indicate clear price movement and potential short-term opportunities.
Disclaimer: This content is for educational purposes only and does not constitute financial or investment advice. Investments in securities or other financial instruments are subject to market risk, including partial or total loss of capital. Past performance is not indicative of future results. Always consider your financial situation carefully and consult a licensed financial advisor before making investment or trading decisions.
Engineered for the obsessed. Built for traders.

Purpose-built terminals.
Zero compromise.
Built for speed.
Plot No 1290, 2nd Floor, 17th Cross, 5th Main, Sector-7, HSR Layout, Bangalore 560102
Follow us on
Mintcap Brokers Private Limited
CIN – U66110KA2023PTC178706 | Registered Address: Plot No 1290, Second Floor, 17th Cross, 5th Main, Sector-7, HSR Layout, Bangalore 560102 | Tel: 080 – 49552310 | Email ID: compliance@capmint.com | SEBI registered Stock Broker: INZ000322732 | NSE Cash/F&O Member ID: 90430 | BSE Cash/F&O Member ID: 6903 | MCX Member ID: 57400 | NCDEX Member ID: 1312 | SEBI registered Depository Participant: IN-DP-806-2025 | CDSL DP ID: 12102300 | NSE Clearing Member code: M70108 | AMFI-Registered Mutual Fund Distributor: ARN-289109 (Valid upto 28-Feb-2027) | Category II Execution Only Platform : E6903
Details of Client Bank Account
Compliance Officer: Ms. Shridevi Vungarala | Email ID: compliance@capmint.com | Tel no. + 91 9035330126 | Grievance Redressal Officer (GRO) – Ms. Shikha Gupta | Email ID: Grievance@capmint.com | Tel no: 9035331595.
Procedure to file a complaint on SEBI SCORES: Register on SCORES portal. Mandatory details for filing complaints on SCORES: Name, PAN, Address, Mobile Number, E-mail ID. Benefits: Effective Communication, Speedy redressal of the grievances. You may refer the website https://scores.sebi.gov.in/ for more information. You may also download the SEBI Scores app to log a complaint Android: https://play.google.com > store > apps > sebiscores iOS: https://apps.apple.com > app > sebiscores
Disclaimer
Investment in the securities market are subject to market risks, read all the related documents carefully before investing. Brokerage will not exceed the SEBI prescribed limit.
Mutual fund investments are subject to market risks, read all scheme related documents carefully before investing. Mutual Funds are not exchange-traded products.
Attention Investor:
- Stock Brokers can accept securities as margin from clients only by way of pledge in the depository system w.e.f. September 1, 2020.
- Update your mobile number & email Id with your stock broker/depository participant and receive OTP directly from depository on your email id and/or mobile number to create pledge.
- Pay 20% as upfront margin of the transaction value to trade in cash market segment.
- Investors may please refer to the Exchange’s Frequently Asked Questions (FAQs) issued vide circular reference NSE/INSP/45191 dated July 31, 2020 and NSE/INSP/45534 dated August 31, 2020 and other guidelines issued from time to time in this regard.
- Check your Securities /MF/ Bonds in the consolidated account statement issued by NSDL/CDSL every month.