
Link copied!
Gravestone Doji
A Gravestone Doji is a bearish reversal candlestick pattern used in technical analysis. It forms when the open, low, and close prices are nearly identical, with a long upper shadow and little to no lower shadow.
Key Takeaways
- The Gravestone Doji suggests a potential trend reversal in an uptrend, indicating that buyers lost control as sellers pushed prices down.
- The pattern is strongest near resistance levels. In downtrends or consolidation, it needs confirmation through additional indicators for better accuracy.
- Wait for a bearish confirmation candle. Use RSI or moving averages, and place a stop-loss just above the Doji’s high for protection.
- A Gravestone Doji isn’t always reliable. Low trading volume weakens its impact, and it may indicate a pullback instead of a reversal.
What is a Gravestone Doji?
The Gravestone Doji is one of the Doji candlestick patterns and it is a significant candlestick pattern in technical analysis. It often signals a potential bearish reversal. It forms when an asset’s opening, low, and closing prices are nearly the same, resulting in a candle with a long upper shadow and little to no lower shadow. This pattern suggests that buyers initially drove prices higher, but sellers ultimately regained control, forcing the price back to its opening level by the session’s close.
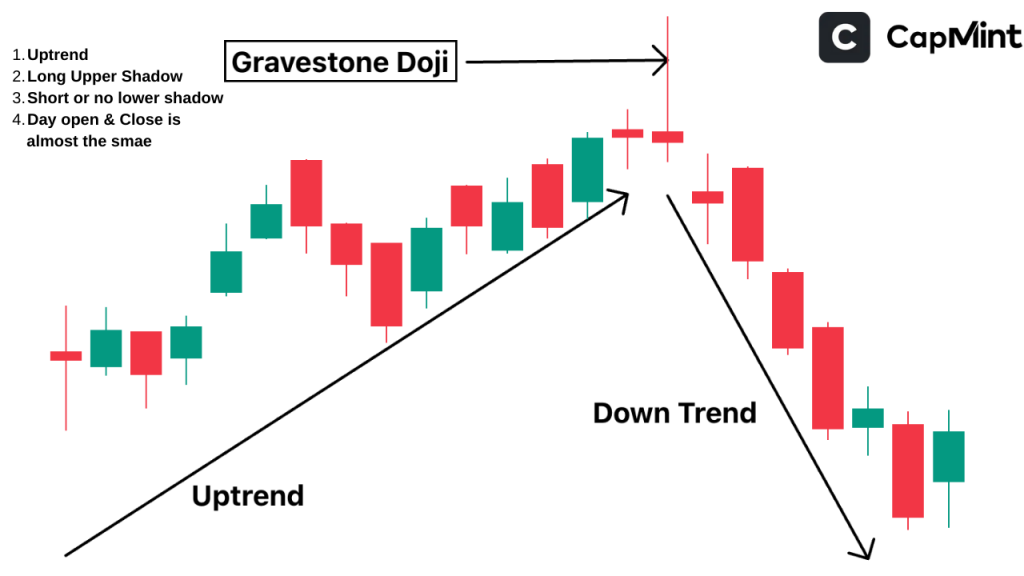
The visual structure of this pattern is distinctive and relatively easy to spot on a chart. It resembles an inverted “T,” with the long upper wick representing the intraday high that was entirely given back by close. On daily charts of actively traded Indian stocks, a textbook Gravestone Doji where the close is exactly at the low is uncommon. More often, there is a small lower shadow of a few paise or a fraction of a per cent, and the pattern still carries the same interpretive weight as long as the close is near the session’s low.
Formation and Characteristics of Gravestone Doji
A Gravestone Doji is characterised by:
Long Upper Shadow
Represents buying pressure that failed to sustain. The longer the upper shadow relative to the stock’s average daily range, the more significant the rejection. An upper shadow that extends 2–3 times the stock’s typical daily range signals a particularly aggressive intraday reversal.
No Lower Shadow
The price closed at or near the session’s low, reflecting strong selling pressure. In practice, a tiny lower shadow of a few points is acceptable. What matters is that the body is near the bottom of the candle’s total range.
Formation in a Uptrend
Typically appears after a strong bullish move, suggesting that buying momentum is weakening.
Significance of Gravestone Doji in Technical Analysis
The Gravestone Doji indicates a crucial pattern for traders looking to anticipate market shifts. Its presence can provide early warning signs of a potential downturn. Let’s break down why this pattern matters:
Bearish Reversal Signal
When a Gravestone Doji candlestick pattern appears while the stock is in an uptrend, it suggests that the bullish momentum is fading. Buyers push the price higher during the early session, but their efforts are completely erased by strong selling pressure from sellers in the later session of trading. This shift in control from buyers to sellers increases the likelihood of a downward move. The signal is particularly compelling when the selling accelerates in the final 60–90 minutes of the trading day, as this often indicates institutional distribution rather than routine profit-booking.
Market Indecision
This pattern is a textbook example of a market standoff. Buyers try to take prices higher, but their inability to maintain those levels shows hesitation. Meanwhile, sellers regain dominance, pushing the price back down. This dynamic creates uncertainty, making it a pivotal moment for traders to assess potential market direction.
Resistance Level Test
The Gravestone Doji often appears near resistance zones, key price levels where the asset has struggled to move higher in the past. When the pattern forms at resistance, it reinforces the idea that buyers are losing strength, making it more likely that the price will reverse downward. This makes it a useful tool for traders looking to confirm sell signals. A Gravestone Doji at a level that has been tested and rejected two or three times previously carries considerably more weight than one at a first-touch resistance.
Traders should also note that it is not an absolute rule that a Gravestone Doji will only form at a resistance; it could also form near an all-time high if a company is trading at a stretched valuation. In such cases, the absence of historical resistance above makes it harder to set targets, but the pattern still reflects the same underlying dynamic of buyer exhaustion.
Interpreting Gravestone Doji in Different Market Contexts
A Gravestone Doji may appear in an uptrend, downtrend, or during consolidation, but its significance varies depending on the market context.
Appearing in an uptrend
When it appears in an uptrend, it carries the most weight as a potential reversal signal. The pattern suggests that buyers initially drove prices higher, but selling pressure took over and pushed prices back down, indicating a loss of bullish momentum. If a bearish candle follows the Gravestone Doji, it strengthens the case for a trend reversal.
Appearing in a downtrend
When a Gravestone Doji forms in a downtrend, its impact is usually limited. Since the market is already moving downward, the pattern may only confirm the existing bearish sentiment rather than introduce a fresh reversal. Traders should be cautious when interpreting the pattern in this scenario and look for additional confirmations. One exception worth noting: if the Gravestone Doji forms during a brief relief rally within a larger downtrend, it can serve as a useful signal that the counter-trend bounce is exhausting itself and the primary downtrend is likely to resume.
Appearing during consolidation
If a Gravestone Doji appears during consolidation, it generally holds little significance. Consolidation phases are characterised by indecisiveness, and a single candlestick pattern like the Gravestone Doji is not enough to predict a breakout or breakdown. Traders should wait for a stronger signal before making trading decisions.
In range-bound markets, Gravestone Dojis tend to appear repeatedly near the upper boundary of the range, and while each individual occurrence is unreliable, a cluster of them near the same price level does reinforce that zone as a ceiling.
How to Trade the Gravestone Doji Pattern
Trading the Gravestone Doji effectively requires a well-structured approach. First and foremost, confirmation is key. The pattern alone does not guarantee a trend reversal, so traders should wait for a bearish candlestick to follow the Doji. If the price continues to drop after the Doji forms, it strengthens the likelihood of a downtrend, making it a more reliable trading signal.
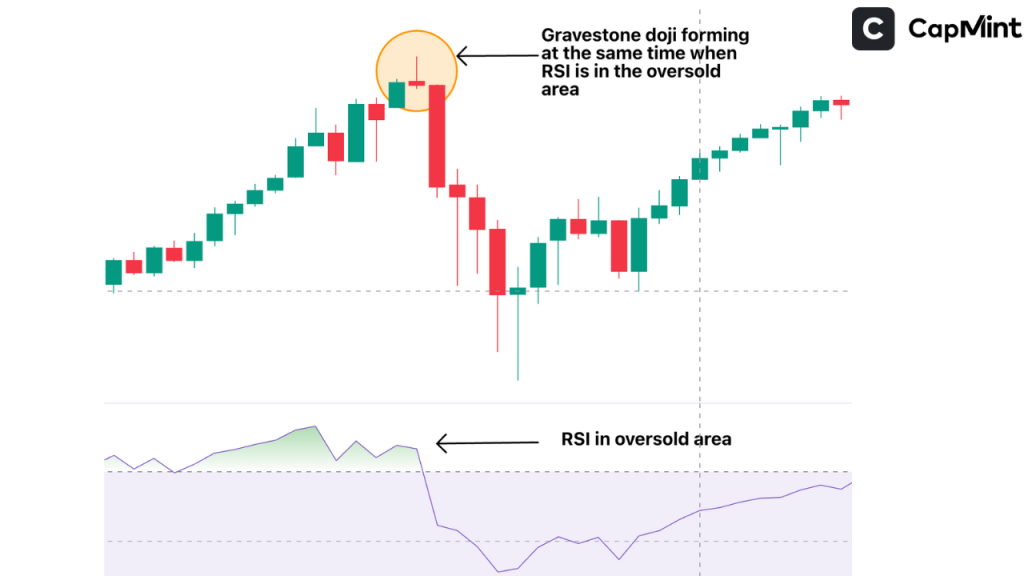
Another important factor is using additional technical indicators. Relying solely on the Gravestone Doji can be risky, so pairing it with indicators like the Relative Strength Index (RSI) to check overbought conditions, moving averages to assess trend direction, or examining whether the price is hitting resistance levels can improve accuracy.
An RSI reading above 70 combined with a Gravestone Doji at resistance creates a notably stronger setup than either signal in isolation. These tools help traders validate whether the market is indeed ready for a reversal.
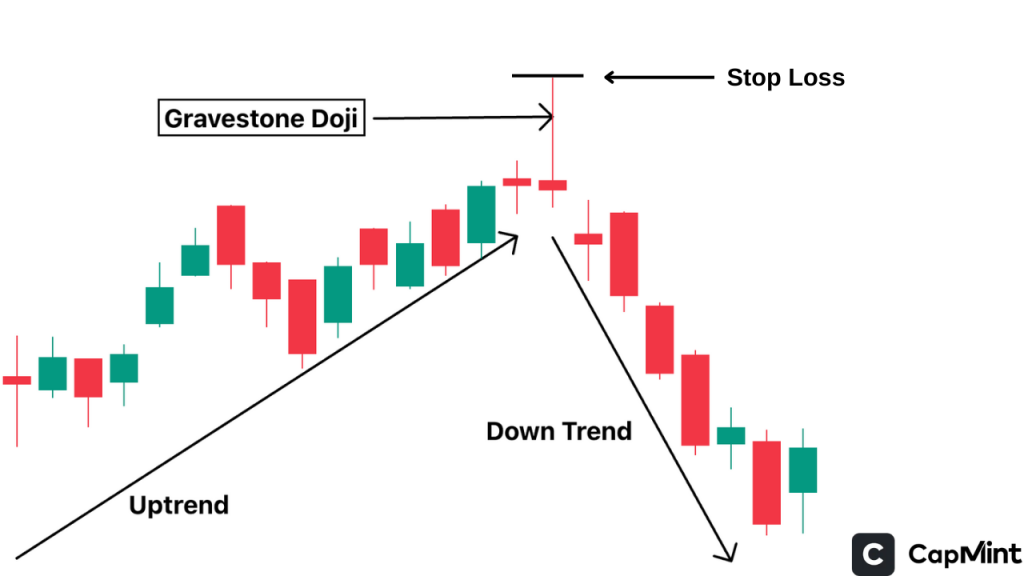
Stop-loss placement is essential when trading this pattern. A well-placed stop-loss protects traders from unexpected market moves. The safest strategy is to place the stop-loss just above the high of the Gravestone Doji. This ensures that if the price unexpectedly moves higher instead of reversing, losses are minimised.
One practical consideration: if the upper shadow of the Gravestone Doji is exceptionally long, the stop-loss distance can become uncomfortably wide. In such cases, reducing position size to keep the absolute risk manageable is a better approach than tightening the stop to an arbitrary level that might get triggered by normal volatility.
Additionally, traders should consider market conditions before acting. If the Gravestone Doji forms in an uptrend near a strong resistance level, the chances of a reversal are higher. However, if it appears in a downtrend, it may simply reinforce existing bearish sentiment rather than signal a new trend. Similarly, during market consolidation, the pattern holds little weight unless it appears alongside other strong indicators.
For profit targets, the nearest horizontal support level serves as a reasonable first target. If the position moves favourably, trailing the stop-loss to break-even after the price has moved a distance equal to the initial risk helps protect capital while allowing the trade room to develop.
By incorporating these strategies — waiting for confirmation, using additional indicators, setting a stop-loss, and analysing the broader market — traders can make more informed decisions when encountering a Gravestone Doji, increasing their chances of executing profitable trades.
Limitations of the Gravestone Doji Pattern
While the Gravestone Doji is a valuable indicator, traders should be aware of its limitations:
False Signals
Just because a Gravestone Doji appears does not guarantee a trend reversal. Market conditions, broader sentiment, or even random price fluctuations can lead to false signals or the formation of a Gravestone Doji. This is why confirmation with a follow-up bearish candle is essential. A common false signal scenario occurs when a stock forms a Gravestone Doji on a Friday with thin afternoon volume, only to gap up on Monday as fresh institutional buying resumes. Patterns formed on low-participation sessions deserve extra scepticism.
Low Volume
A Gravestone Doji that forms with low trading volume is much less reliable than one with high volume. When institutional traders are active, the pattern holds more significance. Low volume can indicate indecision rather than a strong shift in momentum. A useful threshold is to check whether the session’s volume is at least equal to or above the 10-day average. Below that, the rejection reflected in the upper shadow may simply be the result of thin order books rather than genuine selling conviction.
Context is Key
The significance of the Gravestone Doji depends on where it appears. In an uptrend near resistance, it suggests a potential reversal. In a downtrend, it may simply confirm ongoing bearish momentum rather than indicating a new shift in trend. During consolidation, it often lacks predictive power.
Not Always a Reversal Signal
While often considered a bearish indicator, a Gravestone Doji may sometimes signal only a brief pullback rather than a full trend reversal. On strongly trending stocks, particularly those with sustained institutional buying, a Gravestone Doji can produce a one or two-day dip before the uptrend resumes. Relying solely on this pattern without additional technical confirmation can lead to premature short entries that get stopped out quickly.
Conclusion
The Gravestone Doji is a valuable bearish reversal pattern, especially in uptrends near resistance. However, it should never be used in isolation. Traders must seek confirmation through follow-up bearish candles and technical indicators like RSI and moving averages. While it can provide early warning signs of trend shifts, false signals and low-volume formations reduce its reliability. The most dependable Gravestone Doji setups tend to share a few common characteristics: they form after a sustained multi-day advance, appear at or near a recognisable resistance level, and are accompanied by above-average volume. By incorporating risk management strategies such as stop-loss placement and broader market analysis, traders can improve decision-making and enhance trading outcomes with this pattern.
Frequently Asked Questions (FAQs)
What is a Gravestone Doji?
A Gravestone Doji is a bearish reversal candlestick pattern characterised by a long upper shadow and little to no lower shadow, with the open, low, and close prices near the same level.
How is a Gravestone Doji formed?
It forms when buyers push the price higher after the opening, but sellers regain control, driving the price back down to close near the opening price. The entire intraday gain is effectively erased by the session’s end, which is what gives the pattern its bearish implication.
What does a Gravestone Doji indicate?
This pattern suggests a potential bearish reversal, indicating that the uptrend may be losing momentum and a downtrend could follow. It is most significant when it appears after a clear upward move and near a known resistance zone.
Can a Gravestone Doji appear in a downtrend?
Yes, while it typically signals a reversal at the top of an uptrend, it can appear in other contexts. In a downtrend, it may indicate that a relief rally has failed, reinforcing bearish momentum. At the bottom of a sustained downtrend, its interpretation becomes ambiguous, and traders should rely more heavily on confirmation signals and volume analysis before acting.
How reliable is the Gravestone Doji as a trading signal?
The Gravestone Doji is more reliable when it occurs after an uptrend and is confirmed by subsequent bearish candles and other technical indicators. On higher timeframes like daily or weekly charts, the pattern tends to produce more dependable signals than on intraday charts, where market noise frequently creates Doji formations with little directional follow-through.
Disclaimer: This content is for educational purposes only and does not constitute financial or investment advice. Investments in securities or other financial instruments are subject to market risk, including partial or total loss of capital. Past performance is not indicative of future results. Always consider your financial situation carefully and consult a licensed financial advisor before making investment or trading decisions.
Engineered for the obsessed. Built for traders.

Purpose-built terminals.
Zero compromise.
Built for speed.
Plot No 1290, 2nd Floor, 17th Cross, 5th Main, Sector-7, HSR Layout, Bangalore 560102
Follow us on
Mintcap Brokers Private Limited
CIN – U66110KA2023PTC178706 | Registered Address: Plot No 1290, Second Floor, 17th Cross, 5th Main, Sector-7, HSR Layout, Bangalore 560102 | Tel: 080 – 49552310 | Email ID: compliance@capmint.com | SEBI registered Stock Broker: INZ000322732 | NSE Cash/F&O Member ID: 90430 | BSE Cash/F&O Member ID: 6903 | MCX Member ID: 57400 | NCDEX Member ID: 1312 | SEBI registered Depository Participant: IN-DP-806-2025 | CDSL DP ID: 12102300 | NSE Clearing Member code: M70108 | AMFI-Registered Mutual Fund Distributor: ARN-289109 (Valid upto 28-Feb-2027) | Category II Execution Only Platform : E6903
Details of Client Bank Account
Compliance Officer: Ms. Shridevi Vungarala | Email ID: compliance@capmint.com | Tel no. + 91 9035330126 | Grievance Redressal Officer (GRO) – Ms. Shikha Gupta | Email ID: Grievance@capmint.com | Tel no: 9035331595.
Procedure to file a complaint on SEBI SCORES: Register on SCORES portal. Mandatory details for filing complaints on SCORES: Name, PAN, Address, Mobile Number, E-mail ID. Benefits: Effective Communication, Speedy redressal of the grievances. You may refer the website https://scores.sebi.gov.in/ for more information. You may also download the SEBI Scores app to log a complaint Android: https://play.google.com > store > apps > sebiscores iOS: https://apps.apple.com > app > sebiscores
Disclaimer
Investment in the securities market are subject to market risks, read all the related documents carefully before investing. Brokerage will not exceed the SEBI prescribed limit.
Mutual fund investments are subject to market risks, read all scheme related documents carefully before investing. Mutual Funds are not exchange-traded products.
Attention Investor:
- Stock Brokers can accept securities as margin from clients only by way of pledge in the depository system w.e.f. September 1, 2020.
- Update your mobile number & email Id with your stock broker/depository participant and receive OTP directly from depository on your email id and/or mobile number to create pledge.
- Pay 20% as upfront margin of the transaction value to trade in cash market segment.
- Investors may please refer to the Exchange’s Frequently Asked Questions (FAQs) issued vide circular reference NSE/INSP/45191 dated July 31, 2020 and NSE/INSP/45534 dated August 31, 2020 and other guidelines issued from time to time in this regard.
- Check your Securities /MF/ Bonds in the consolidated account statement issued by NSDL/CDSL every month.