
Link copied!
Displaced Moving Average (DMA)
Displaced Moving Average (DMA) is a type of moving average that shifts a simple or exponential moving average (SMA or EMA) forward or backwards in time by a specified number of periods. It helps traders smooth out price trends while adjusting the responsiveness of the moving average to market changes.
Key Takeaways
- A Displaced Moving Average (DMA) is a regular moving average (SMA or EMA) that is shifted forward or backwards by a set number of periods to refine trend analysis.
- DMA helps smooth out price movements, making it easier to see whether the market is in an uptrend, a downtrend, or moving sideways.
- When the price or a shorter-term DMA crosses a longer-term DMA, it can indicate buying or selling opportunities, helping traders make better decisions.
- Unlike the Exponential Moving Average (EMA), which reacts quickly to price changes, DMA provides a more stable view by shifting moving averages to confirm trends and reduce noise.
What Is the Displaced Moving Average in the Stock Market?
A displaced moving average means a regular moving average (SMA or EMA) that is shifted forward or backwards on a chart.
- If moved forward (positive displacement), it helps traders predict future trends.
- If moved backwards (negative displacement), it aligns better with past prices to confirm trends.
DMA reduces the lag caused by the simple moving average by moving forward and gives an early trend. DMA eliminates noise and confirms trends by doing a backward shift, which is especially helpful in trend-following and breakout strategies.
DMA Formula:
The standard moving average formula remains the same:
Where:
- MA(n) = Moving Average of period n
- X = Number of periods displaced (positive or negative)
Applications of Displaced Moving Average (DMA)
The Displaced Moving Average (DMA) is a powerful tool in technical analysis used to identify trends, improve trade timing, and establish support/resistance levels. Here’s how it helps traders:
DMA Helps In Trend Identification
DMA, just like any other moving average, also helps with trend identification by smoothing out price fluctuations and helping traders see the prevailing trend more clearly. Here’s a clear and simple table explaining how DMA helps in trend identification:
| DMA Trend | Market Condition | Trading Action |
|---|---|---|
| Rising DMA | Uptrend | Look for buying opportunities as prices are moving higher. |
| Falling DMA | Downtrend | Consider selling or shorting as prices are declining. |
| Sideways DMA | Range-bound Market | Avoid major trades; wait for a breakout in either direction. |
DMA In Entry & Exit Points
By shifting the moving average forward or backwards, traders can adjust the lag in price action and fine-tune trade signals.
- Forward Shift (Anticipatory DMA): Moves ahead of price action and predicts potential reversals earlier.
- Backwards Shift (Confirmatory DMA): Aligns better with past trends to validate breakouts and breakdowns.
When a shorter moving average crosses above a longer moving average, it indicates buying pressure in the short term. For example, a 10-day simple moving average shifted forward by 5 periods crossing above the 50-day displaced moving average can signal an early buying opportunity. On the other hand, when the longer-term moving average crosses below the shorter-term moving average, it suggests that selling pressure has built up. If the 10-day displaced moving average falls below the 50-day displaced moving average, it may indicate an early sell signal.
DMA As Dynamic Support And Resistance
Displaced moving averages serve as dynamic support and resistance levels by shifting with price movements, helping traders identify potential reversal or consolidation zones more effectively. When the price is in an uptrend, a forward-displaced moving average can act as anticipatory support, where prices tend to bounce off before continuing higher. Traders often look at DMAs like the 50-day and 200-day displaced moving averages to see if the price remains above them, indicating sustained bullish momentum. In a downtrend, a forward-displaced moving average can function as dynamic resistance, making it harder for the price to break above. If the price struggles to cross above a DMA multiple times, it strengthens the bearish trend and suggests continued downside pressure. By shifting moving averages forward or backwards, DMAs provide traders with a more flexible tool to analyse price behaviour and improve decision-making.
Interpretation of DMA
This dynamic behaviour of displaced moving averages helps traders interpret price action more effectively. Here’s how to interpret it:
Trend Direction
Clarify that a rising DMA indicates an uptrend, while a falling DMA suggests a downtrend. For instance, here’s the chart: TATA Motors has declining DMA, indicating selling pressure. 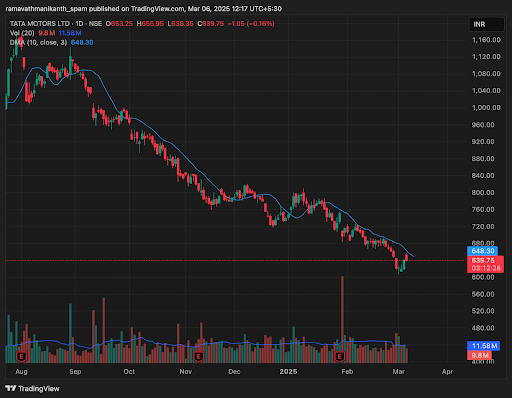
Momentum Shifts with DMA
When the price crosses above a displaced moving average, it signals increasing buying momentum, suggesting a potential uptrend. This can indicate that buyers are gaining control, and the price may continue rising. Conversely, when the price drops below a displaced moving average, it reflects growing selling pressure, signalling a possible downtrend. This suggests that sellers are dominating, and the price could decline further. By observing these crossings, traders can gauge shifts in market momentum early and adjust their strategies accordingly.
Buy and Sell Signals Using DMA Crossovers
Displaced moving averages can generate buy and sell signals when they cross either the price or another moving average.
- Buy Signal: When the price crosses above a displaced moving average, it indicates increasing buying pressure and a potential uptrend. Similarly, if a shorter-term DMA (e.g., 10-day DMA) crosses above a longer-term DMA (e.g., 50-day DMA), it confirms bullish momentum and signals a buying opportunity.
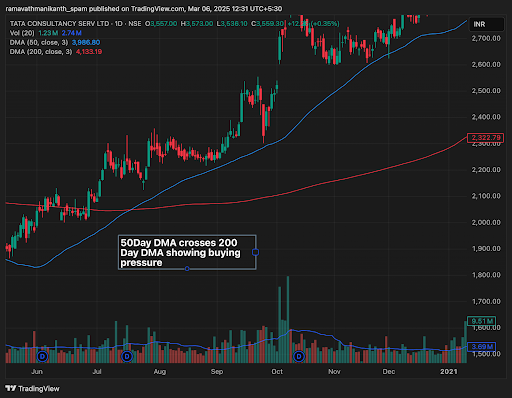 The chart shows TCS stock experiencing a bullish crossover, where the 50-day DMA (blue) crosses above the 200-day DMA (red). This Golden Cross signalled strong buying pressure, and the stock has rallied significantly since the crossover.
- Sell Signal: When the price falls below a displaced moving average, it suggests rising selling pressure and a potential downtrend. A short-term DMA crossing below a long-term DMA reinforces bearish momentum and signals a possible selling opportunity.
Traders use these crossovers to time their entry and exit points effectively, combining them with other indicators like RSI or MACD for confirmation.
Comparison: DMA vs. Exponential Moving Average (EMA)
Here is a table that shows the differences between DMA and EMA:
| Exponential Moving Average (EMA) | Displaced Moving Average (DMA) |
| Gives more weight to recent prices, making it react faster. | Shifts a regular moving average forward or backwards without changing weights. |
| Highly responsive to price changes, useful for quick signals. | Less responsive, as it smooths trends rather than reacting immediately. |
| Can be noisy due to frequent short-term fluctuations. | Helps in clearer trend identification by reducing noise. |
| Not commonly used for support/resistance levels. | Acts as a dynamic support or resistance zone. |
| Helps catch early breakouts but may give false signals. | Filters out false breakouts by providing a more stable trend view. |
| Short-term traders who need fast signals. | Trend-followers are looking for confirmation before making decisions. |
| Less lag but prone to false signals. | More lag due to displacement, but better for trend confirmation. |
Limitations of DMA
Despite its usefulness, traders should be aware of certain limitations of DMA:
Time lag
Even though DMA adjusts the lag of traditional moving averages, it does not eliminate it completely. This can lead to delayed signals, especially in fast-moving markets where timely decisions are critical.
Dependence on displacement choice
The effectiveness of DMA depends on how many periods it is shifted. Since this is decided by the trader, different settings can lead to different interpretations, making it less standardised.
False signals in sideways markets
DMA works best in trending conditions. In range-bound or low-volatility markets, it may generate misleading signals, making it harder to identify clear entry or exit points.
Over-reliance risk
Relying only on DMA for trading decisions can limit perspective. It is important to combine it with other indicators like RSI, MACD, or price action to improve accuracy and reduce risk.
Less effective in highly volatile conditions
In markets with sharp and unpredictable price movements, DMA may fail to capture sudden changes effectively, reducing its reliability for short-term trading decisions.
Conclusion
Displaced Moving Average (DMA) is a valuable tool in technical analysis that helps traders refine trend identification, improve trade timing, and establish key support and resistance levels. By shifting a moving average forward or backwards, DMA reduces lag and offers a clearer perspective on price movements. It is particularly useful for confirming trends, filtering out noise, and enhancing decision-making in both short-term and long-term trading strategies. DMA crossovers with price or other moving averages generate important buy and sell signals, helping traders anticipate momentum shifts effectively. Compared to the Exponential Moving Average (EMA), DMA does not react as quickly to price changes but provides a more stable view of market trends. Traders can use DMA in combination with other indicators to strengthen their analysis and make informed trading decisions. Understanding how to apply DMA correctly can significantly enhance market insights and improve overall trading performance.
Frequently Asked Questions on DMA
What is the Full form of DMA?
The full form of DMA is Displaced Moving Average. It is used to examine the stock market price patterns
Can DMA be used independently for making trading decisions?
DMA should always be combined with other technical indicators and fundamental analysis.
What is the formula for the displaced moving average?
The formula for a Displaced Moving Average (DMA) is: DMA = Moving Average (SMA or EMA) shifted by X periods Where:
- MA(n) = Moving Average over n periods (SMA or EMA)
- X = Number of periods the moving average is shifted (positive for forward, negative for backward)
What is a displaced moving average (DMA)?
A Displaced Moving Average (DMA) is a moving average (SMA or EMA) that is shifted forward or backwards on a chart by a set number of periods.
- Forward shift (+X periods): Helps predict future trends.
- Backward shift (-X periods): Aligns with past prices to confirm trends.
DMA helps traders reduce lag, smooth price movements, and identify key trend changes.
Disclaimer: This content is for educational purposes only and does not constitute financial or investment advice. Investments in securities or other financial instruments are subject to market risk, including partial or total loss of capital. Past performance is not indicative of future results. Always consider your financial situation carefully and consult a licensed financial advisor before making investment or trading decisions.
Engineered for the obsessed. Built for traders.

Purpose-built terminals.
Zero compromise.
Built for speed.
Plot No 1290, 2nd Floor, 17th Cross, 5th Main, Sector-7, HSR Layout, Bangalore 560102
Follow us on
Mintcap Brokers Private Limited
CIN – U66110KA2023PTC178706 | Registered Address: Plot No 1290, Second Floor, 17th Cross, 5th Main, Sector-7, HSR Layout, Bangalore 560102 | Tel: 080 – 49552310 | Email ID: compliance@capmint.com | SEBI registered Stock Broker: INZ000322732 | NSE Cash/F&O Member ID: 90430 | BSE Cash/F&O Member ID: 6903 | MCX Member ID: 57400 | NCDEX Member ID: 1312 | SEBI registered Depository Participant: IN-DP-806-2025 | CDSL DP ID: 12102300 | NSE Clearing Member code: M70108 | AMFI-Registered Mutual Fund Distributor: ARN-289109 (Valid upto 28-Feb-2027) | Category II Execution Only Platform : E6903
Details of Client Bank Account
Compliance Officer: Ms. Shridevi Vungarala | Email ID: compliance@capmint.com | Tel no. + 91 9035330126 | Grievance Redressal Officer (GRO) – Ms. Shikha Gupta | Email ID: Grievance@capmint.com | Tel no: 9035331595.
Procedure to file a complaint on SEBI SCORES: Register on SCORES portal. Mandatory details for filing complaints on SCORES: Name, PAN, Address, Mobile Number, E-mail ID. Benefits: Effective Communication, Speedy redressal of the grievances. You may refer the website https://scores.sebi.gov.in/ for more information. You may also download the SEBI Scores app to log a complaint Android: https://play.google.com > store > apps > sebiscores iOS: https://apps.apple.com > app > sebiscores
Disclaimer
Investment in the securities market are subject to market risks, read all the related documents carefully before investing. Brokerage will not exceed the SEBI prescribed limit.
Mutual fund investments are subject to market risks, read all scheme related documents carefully before investing. Mutual Funds are not exchange-traded products.
Attention Investor:
- Stock Brokers can accept securities as margin from clients only by way of pledge in the depository system w.e.f. September 1, 2020.
- Update your mobile number & email Id with your stock broker/depository participant and receive OTP directly from depository on your email id and/or mobile number to create pledge.
- Pay 20% as upfront margin of the transaction value to trade in cash market segment.
- Investors may please refer to the Exchange’s Frequently Asked Questions (FAQs) issued vide circular reference NSE/INSP/45191 dated July 31, 2020 and NSE/INSP/45534 dated August 31, 2020 and other guidelines issued from time to time in this regard.
- Check your Securities /MF/ Bonds in the consolidated account statement issued by NSDL/CDSL every month.