
Link copied!
Donchian Channels
Donchian Channels are a trend-following technical indicator that plots the highest high and lowest low over a specified time period. They are typically used to identify price breakouts, volatility, and support/resistance levels.
Key Takeaways:
- Based on highs and lows: Donchian Channels are created using the highest high and lowest low over a specific period (commonly 20 days), making it easy to spot market boundaries and possible breakouts.
- Helpful for trend spotting: They help traders quickly recognise when the price is breaking out of its range, signalling the start of a new trend or a potential reversal.
- Stronger with other indicators: When combined with tools like RSI or MACD, Donchian Channels give more reliable signals, helping confirm momentum or filter out weak breakouts.
- Flexible and customizable: These channels can be easily adjusted to fit different trading styles and timeframes, from fast-paced day trading to long-term investing.
What are Donchian Channels?
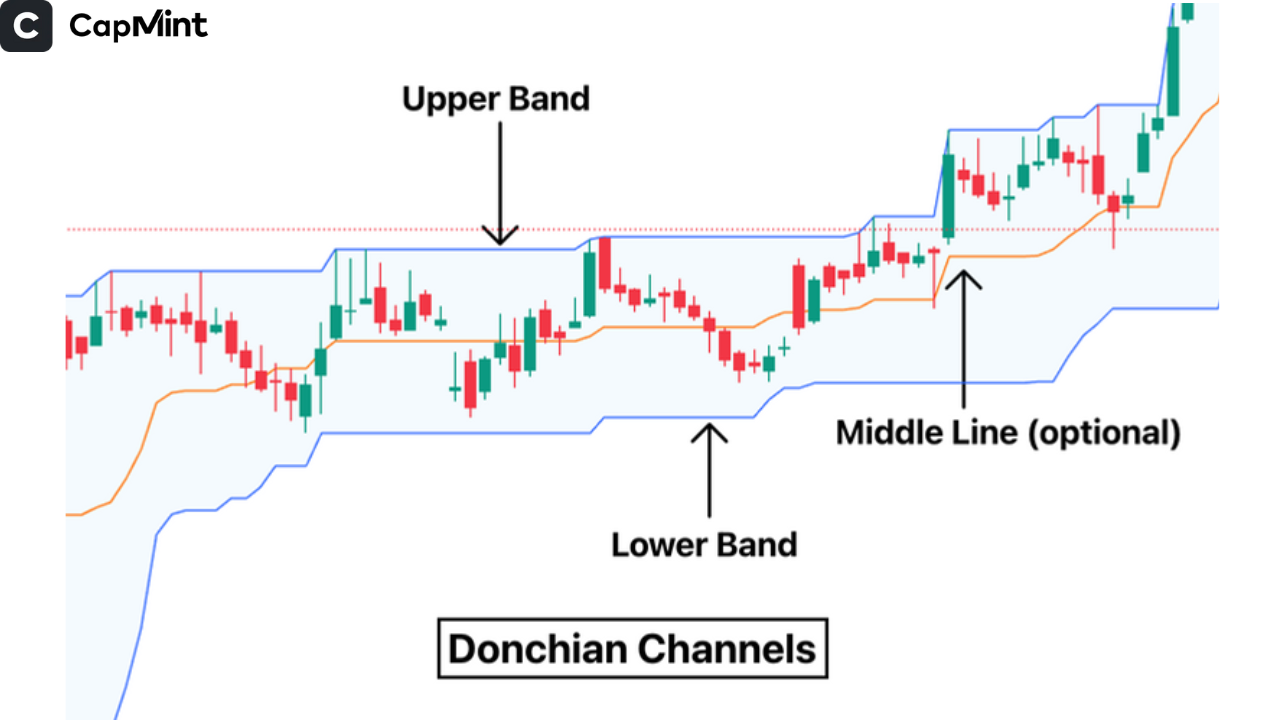
Donchian Channels are a tool in technical analysis that assesses market volatility and highlights the potential for price breakouts. The indicator consists of three bands: an upper band, a lower band, and a middle band.
Upper Band
The highest high over the chosen period. This is calculated by scanning the past “n” number of periods and identifying the peak price point reached during that span.
Lower Band
Lowest low over the same period. This is determined by finding the minimum price point during the same “n” period window used for the upper band.
Middle Line (optional)
(Upper Band + Lower Band) / 2. This gives a midrange reference line, offering a balanced view between bullish and bearish extremes over the chosen period.
Though simple in construction, Donchian Channels provide traders with a visual reference for trend direction and potential entry or exit points. A breakout beyond the upper or lower band often signals increased volatility and may suggest a developing trend, making the channel a helpful guide in decision-making across various market conditions.
By now, it must be very clear about the components of Donchian Channels. Let’s take a look at each one of them for clarity.
- Highest High (Upper Band): Captures the most bullish point of the look-back period. It tells you how far the price has pushed upward recently.
- Lowest Low (Lower Band): Reflects the lowest point reached in that same period. It’s a measure of downside extremity.
- Time Period: Commonly 20 days, but this can be adjusted based on the trader’s strategy. Shorter periods are more reactive; longer ones are smoother.
The time period can be adjusted easily from the indicator settings by increasing or decreasing its length.
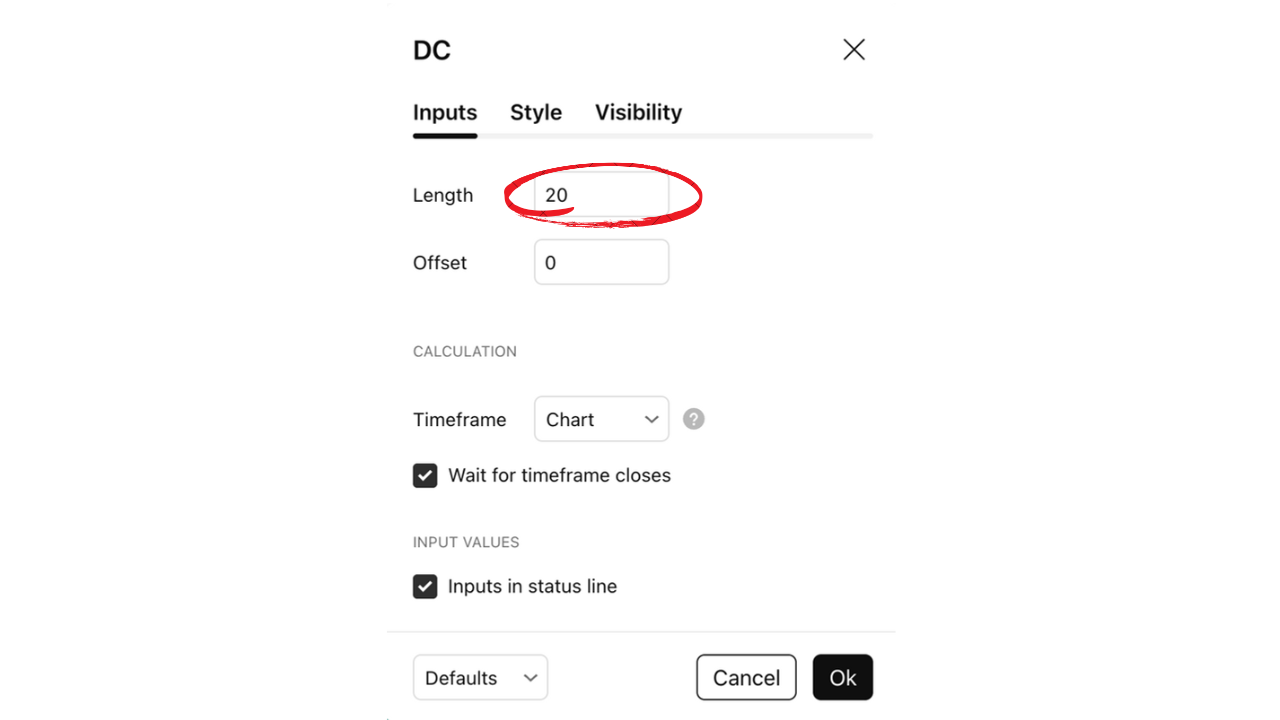
For example, if we increase the length to 30 days, it will include more data, so the upper and lower bands will be based on a wider window of price history. This means:
- Breakouts will need stronger or more prolonged moves to register.
- The bands will react more slowly to sudden price changes, filtering out short-term noise.
- Trends need to sustain momentum longer to cause a band expansion.
In short, if you are looking for a longer-term trade, you can increase the length depending on the strategy you deploy.
How to use Donchian Channels in Trading?
Donchian Channel strategies are versatile. They can assist traders in several practical ways that make spotting market movements easier and more informed:
Identify Breakouts
When the price moves beyond the upper or lower band, it can indicate that the market is starting a new trend. This breakout signal helps traders spot opportunities to enter positions early, before the move fully develops.
Define Trend Strength
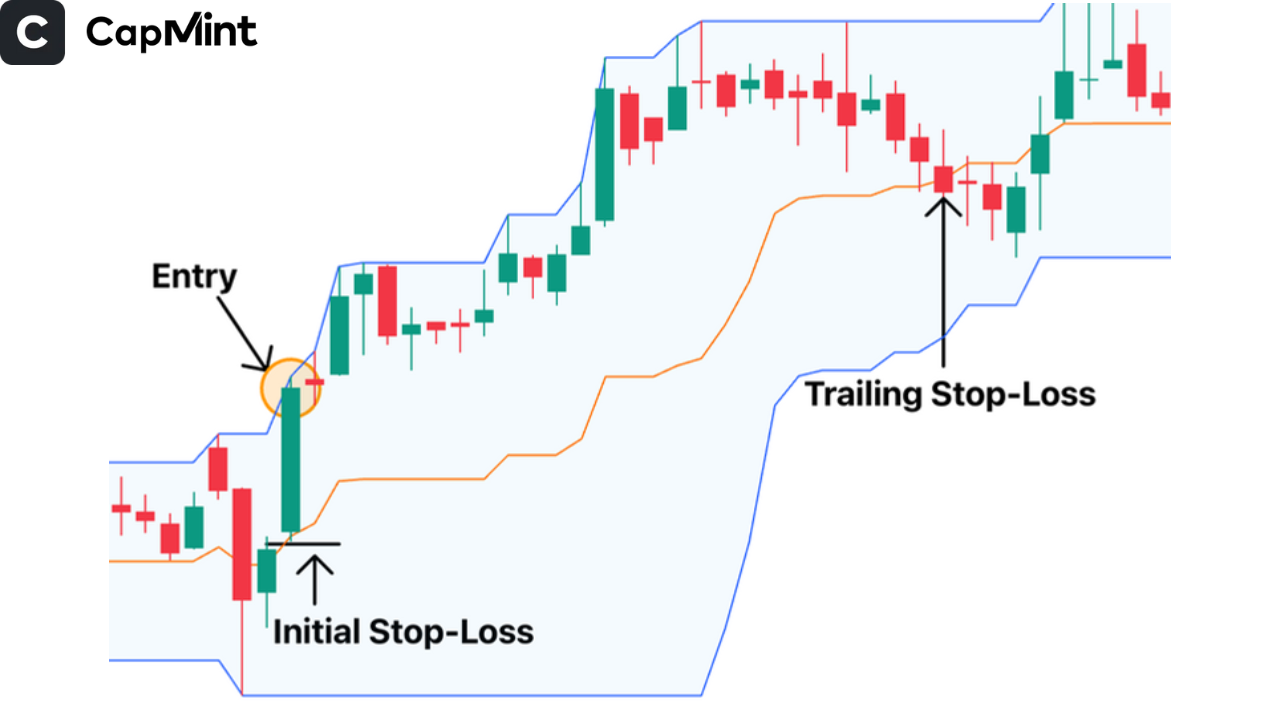
Place Stop-Losses
Traders often use the bands to decide where to place stop-loss orders. For instance, in an uptrend, the middle line can act as a trailing stop to lock in profits while giving the trade room to breathe. This approach helps manage risk without cutting off potential gains too early.
Also read: What is a Stop-Loss Order?
Donchian vs. Other Indicators
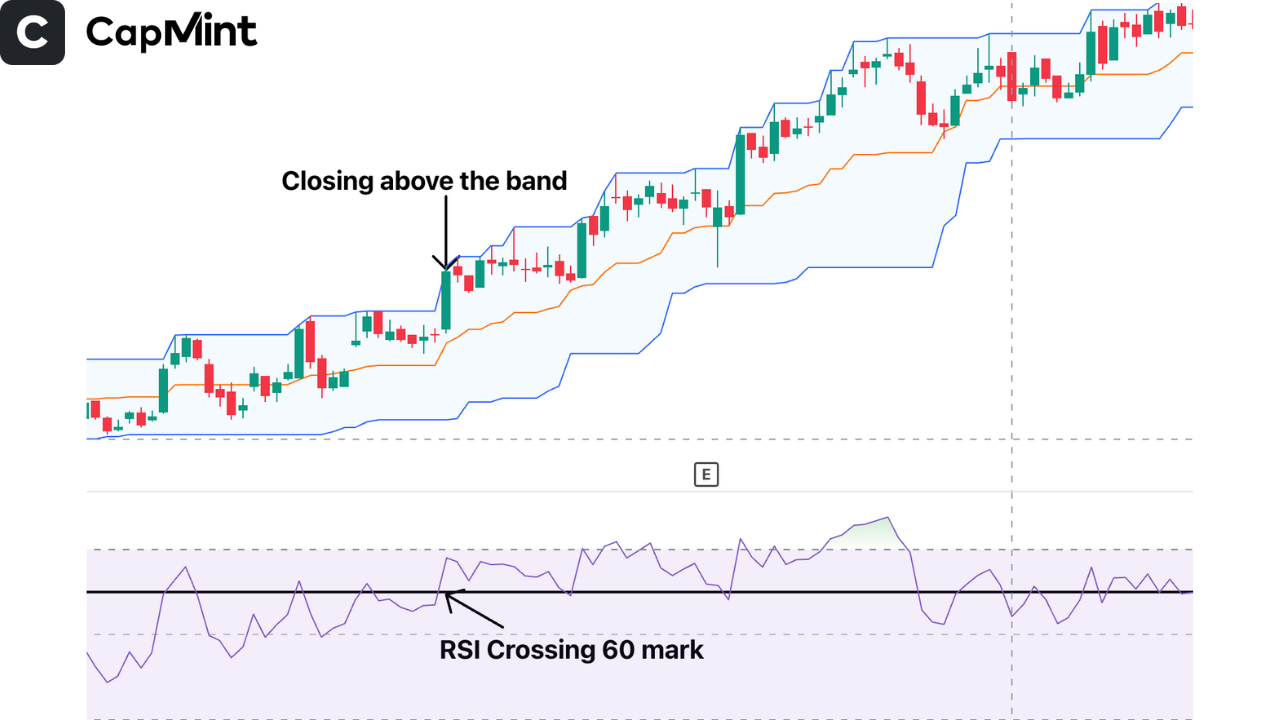
Unlike Bollinger Bands or Keltner Channels, Donchian Channels don’t rely on volatility in the traditional sense (like standard deviation or ATR). Instead, they provide a raw, unfiltered view of how far price has pushed in either direction. This can sometimes make them more responsive to actual market shifts, but also more prone to false signals in choppy markets.
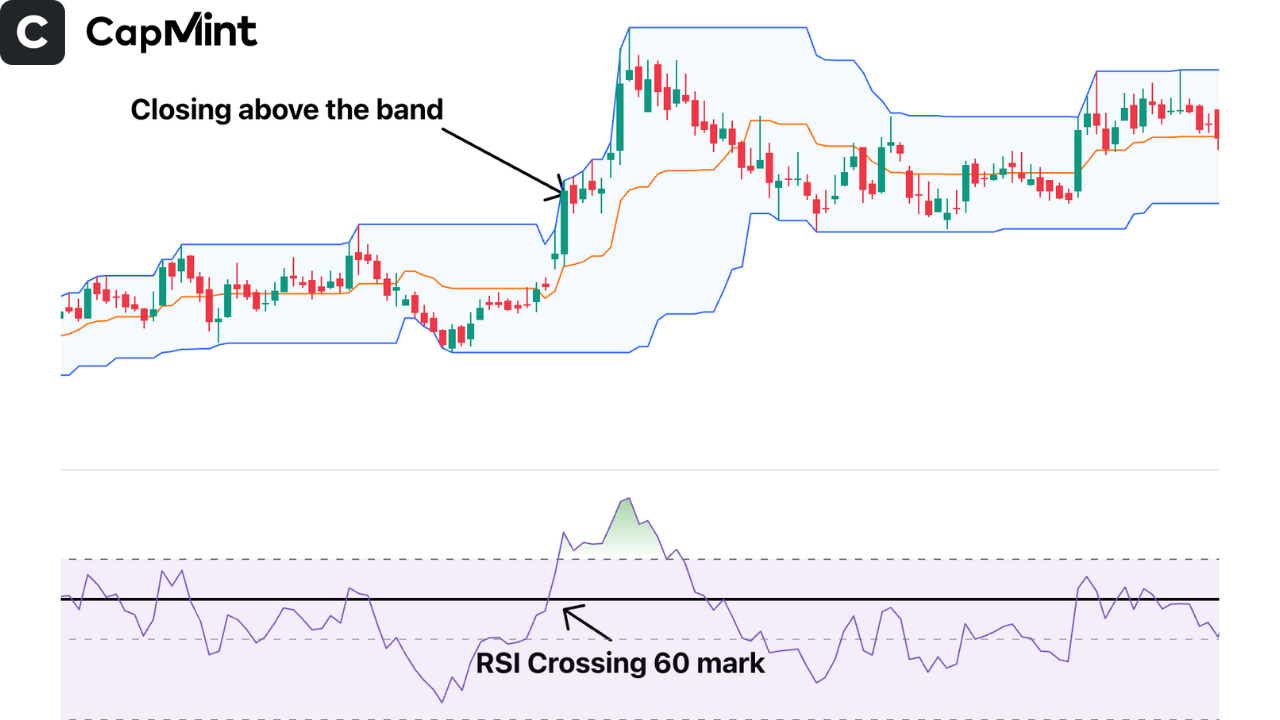
To improve accuracy, many traders pair Donchian Channels with indicators like RSI or other momentum indicators. If the price breaks the upper band and RSI confirms bullish momentum by crossing the 60 level mark (needs to be done manually), the trade setup becomes more compelling. You could see a few of the instances below.
Here is a tabular representation of the difference.
|
Feature |
Bollinger Bands |
Keltner Channels |
Donchian Channels |
|---|---|---|---|
|
Inventor |
John Bollinger |
Chester Keltner (modern version by Linda Raschke) |
Richard Donchian |
|
Basis Line |
20-period Simple Moving Average (SMA) |
20-period Exponential Moving Average (EMA) |
Midpoint between 20-day high and low |
|
Upper/Lower Bands |
±2 standard deviations from SMA |
EMA ± (2 × Average True Range) |
The highest high and the lowest low over a set period |
|
Volatility Measure |
Standard Deviation |
Average True Range (ATR) |
Price Range (High–Low) |
|
Primary Use |
Measures volatility, overbought/oversold |
Identifies volatility and trend direction |
Identifies breakouts and trend reversals |
|
Bandwidth Behaviour |
Expands and contracts with volatility |
Smooths volatility changes |
Width depends only on price extremes |
|
Best For |
Spotting reversals or squeeze breakouts |
Trend following with a volatility filter |
Breakout and trend-following strategies |
|
Sensitivity |
More reactive to short-term price changes |
Smoother, less noisy |
Highly sensitive to highs/lows |
Advantages Of Donchian Channels
Donchian Channels are a versatile tool used for spotting breakouts, identifying trends, managing risk, and adapting to different trading styles:
Clarity
Donchian Channels provide a simple, easy-to-read visual layout of price action by outlining the highest highs and lowest lows. This clean presentation helps traders understand where the market has been and where it might be headed.
Adaptability
These channels are incredibly flexible. Whether you’re a day trader looking at short timeframes or a long-term investor monitoring weekly charts, Donchian Channels can be customised to suit your strategy and trading style.
Breakout Friendly
Donchian Channels are a great tool that can help you catch good moves. They are designed to highlight when price breaks out of its recent range, giving traders a timely cue to jump in or adjust their positions.
Conclusion
Donchian Channels are a powerful tool for visually understanding market range and identifying emerging trends. Their strength lies in their simplicity, using historical highs and lows to create a dynamic trading framework. When used alone or in conjunction with other indicators, they can help traders stay on the right side of market momentum.
Frequently Asked Questions (FAQs)
Can Donchian Channels be used for day trading?
Yes. By adjusting the period (e.g., 20 bars on a 5-minute chart), they can adapt to fast-paced environments. This makes them helpful for spotting quick breakouts or managing trades in volatile, short-term setups.
What’s the best time period for Donchian Channels?
There’s no one-size-fits-all. While 20 days is commonly used, it depends on your strategy. Longer periods smooth the channels, while shorter ones catch quicker moves but may increase false signals.
Do Donchian Channels predict reversals?
Not exactly. They highlight the price extremes over a given period. When used with momentum or volume indicators, they can help suggest when a reversal might be taking shape.
Are Donchian Channels better than Bollinger Bands?
It’s not better, just different. Bollinger Bands reflect price volatility using standard deviation, while Donchian Channels focus on price range extremes. Both can be combined for a stronger confirmation strategy.
Disclaimer: This content is for educational purposes only and does not constitute financial or investment advice. Investments in securities or other financial instruments are subject to market risk, including partial or total loss of capital. Past performance is not indicative of future results. Always consider your financial situation carefully and consult a licensed financial advisor before making investment or trading decisions.
Engineered for the obsessed. Built for traders.

Purpose-built terminals.
Zero compromise.
Built for speed.
Plot No 1290, 2nd Floor, 17th Cross, 5th Main, Sector-7, HSR Layout, Bangalore 560102
Follow us on
Mintcap Brokers Private Limited
CIN – U66110KA2023PTC178706 | Registered Address: Plot No 1290, Second Floor, 17th Cross, 5th Main, Sector-7, HSR Layout, Bangalore 560102 | Tel: 080 – 49552310 | Email ID: compliance@capmint.com | SEBI registered Stock Broker: INZ000322732 | NSE Cash/F&O Member ID: 90430 | BSE Cash/F&O Member ID: 6903 | MCX Member ID: 57400 | NCDEX Member ID: 1312 | SEBI registered Depository Participant: IN-DP-806-2025 | CDSL DP ID: 12102300 | NSE Clearing Member code: M70108 | AMFI-Registered Mutual Fund Distributor: ARN-289109 (Valid upto 28-Feb-2027) | Category II Execution Only Platform : E6903
Details of Client Bank Account
Compliance Officer: Ms. Shridevi Vungarala | Email ID: compliance@capmint.com | Tel no. + 91 9035330126 | Grievance Redressal Officer (GRO) – Ms. Shikha Gupta | Email ID: Grievance@capmint.com | Tel no: 9035331595.
Procedure to file a complaint on SEBI SCORES: Register on SCORES portal. Mandatory details for filing complaints on SCORES: Name, PAN, Address, Mobile Number, E-mail ID. Benefits: Effective Communication, Speedy redressal of the grievances. You may refer the website https://scores.sebi.gov.in/ for more information. You may also download the SEBI Scores app to log a complaint Android: https://play.google.com > store > apps > sebiscores iOS: https://apps.apple.com > app > sebiscores
Disclaimer
Investment in the securities market are subject to market risks, read all the related documents carefully before investing. Brokerage will not exceed the SEBI prescribed limit.
Mutual fund investments are subject to market risks, read all scheme related documents carefully before investing. Mutual Funds are not exchange-traded products.
Attention Investor:
- Stock Brokers can accept securities as margin from clients only by way of pledge in the depository system w.e.f. September 1, 2020.
- Update your mobile number & email Id with your stock broker/depository participant and receive OTP directly from depository on your email id and/or mobile number to create pledge.
- Pay 20% as upfront margin of the transaction value to trade in cash market segment.
- Investors may please refer to the Exchange’s Frequently Asked Questions (FAQs) issued vide circular reference NSE/INSP/45191 dated July 31, 2020 and NSE/INSP/45534 dated August 31, 2020 and other guidelines issued from time to time in this regard.
- Check your Securities /MF/ Bonds in the consolidated account statement issued by NSDL/CDSL every month.