
Table of Content
- Key Takeaways
- Introduction to Technical Analysis in Trading
- What Is Technical Analysis?
- How is Technical Analysis Used?
- Key Components of Technical Analysis
- Popular Technical Analysis Tools
- Technical Analysis vs. Fundamental Analysis
- Limitations of Technical Analysis
- Advantages and Limitations of Technical Analysis
- Conclusion
- Frequently Asked Questions FAQs
Link copied!
Technical Analysis
Technical Analysis is a method used to evaluate and forecast the future price movements of financial assets, such as stocks, commodities, or cryptocurrencies, by analysing past market data, primarily price, volume, charts and technical indicators.
Key Takeaways
- Technical analysis enables traders to analyse price movements, trends, and trading volume to make informed market decisions.
- Markets move in identifiable trends, and history tends to repeat itself, making patterns like support and resistance crucial.
- The Golden Crossover, combined with RSI, can refine trade entry points, but risk management remains essential for long-term success.
- While technical analysis is useful, unexpected market events can disrupt trends, making a combined approach with fundamental analysis beneficial
Introduction to Technical Analysis in Trading
If you’ve ever wondered how traders predict stock movements without reading company reports, the answer lies in technical analysis. Unlike fundamental analysis, which looks at a company’s financial health, technical analysis focuses on price movements, patterns, and trading volume to forecast future price trends. Whether you’re a beginner or an experienced investor, understanding technical analysis can help you make better trading decisions and spot opportunities before they disappear.
What Is Technical Analysis?
Technical analysis is a method of evaluating securities by analysing historical price and volume data. Traders use this approach to identify trends, patterns, and signals that suggest where the price might move next.
Dow Theory and Its Core Principles
Dow Theory is a foundational concept of technical analysis developed by Charles Dow, the co-founder of the Wall Street Journal and Dow Jones & Company. It serves as the basis for modern price trend analysis and is built on the idea that markets move in predictable trends It helps traders understand how markets move and is based on six key principles:
The Market Discounts Everything
Stock prices reflect all available information, including economic data, political events, investor sentiment, and unforeseen global occurrences. This principle implies that technical analysts do not need to analyse fundamental factors separately, as they are already factored into the price.
The Market Moves in Trends
Prices do not move chaotically but follow identifiable trends, which can be upward, downward, or sideways. Recognising these trends helps traders align their strategies with the prevailing market direction, increasing the probability of success.
Primary, Secondary, and Minor Trends Exist
The market experiences different levels of trends: long-term (primary), medium-term corrections (secondary), and short-term fluctuations (minor). Understanding these trends helps traders differentiate between temporary price movements and significant shifts in market direction.
Trends Are Confirmed by Volume
Strong trends should be accompanied by increasing trading volume, indicating a higher level of participation by market players. A rising trend with declining volume may signal weakness and potential reversal, making volume analysis a crucial part of Dow Theory.
Trends Persist Until a Clear Reversal Occurs
A trend remains in effect until there is definitive evidence of a reversal. Reversals are typically confirmed by price patterns, technical indicators, and shifts in volume, rather than isolated price movements that might be misleading.
Indexes Must Confirm Each Other
For a market trend to be considered valid, multiple market indexes, such as industrial and transportation indexes, should move in the same direction. If one index shows an uptrend while another remains stagnant or declines, it may indicate weakness in the overall market movement.
These principles form the backbone of modern technical analysis, helping traders recognise market trends and make informed trading decisions with greater confidence.
How is Technical Analysis Used?
Technical analysis is primarily used by traders and investors to predict future price movements based on past market data. It is widely applied in stock trading, forex, commodities, and cryptocurrency markets. By analysing price charts, trends, and trading volumes, traders aim to make informed decisions about buying, selling, or holding assets.
The primary objectives of technical analysis are to provide traders and investors with a structured approach to analysing price action, identifying profitable opportunities, and making data-driven trading decisions based on historical market trends and statistical probabilities.
Identifying Market Trends:
Traders use charts to spot uptrends, downtrends, and sideways movements, helping them recognise patterns that indicate the strength and sustainability of a trend, which is crucial for making profitable trades.
Finding Entry and Exit Points
Indicators and price patterns help determine the best times to buy or sell, ensuring traders enter positions when the probability of profit is highest and exit before a reversal erases their gains.
Evaluating Market Sentiment
Oscillators and volume analysis provide insights into whether a market is bullish or bearish, helping traders gauge investor psychology and determine if momentum is in favour of buying or selling pressure.
Risk Management
Technical tools help traders set stop-loss and take-profit levels to manage potential losses, allowing them to control downside risk while maximising potential returns by following a disciplined approach to trading.
Now, let’s explore the core components of technical analysis that traders use daily.
Key Components of Technical Analysis
1. Charts and Chart Types
Technical analysts rely on charts to visualise price movements. The three most common types are:
- Line Chart: A simple way to track closing prices over time, providing a clear view of overall trends that helps traders quickly understand the general direction of the market.
- Bar Chart: Displays opening, closing, high, and low prices, helping traders see daily price fluctuations and analyse volatility, which is crucial for short-term trading strategies.
- Candlestick Chart: The most popular type, showing price action with colored candles indicating gains (green) or losses (red), along with key price levels, allowing traders to easily identify trend reversals and momentum shifts.
2. Indicators and Oscillators
Technical analysis Indicators help traders confirm trends and predict reversals. Some widely used ones include:
- Moving Averages (MA): Smooths out price fluctuations to highlight trends, with common types being Simple Moving Average (SMA) and Exponential Moving Average (EMA), which help traders determine support and resistance levels as well as trend continuation or reversal points.
- Relative Strength Index (RSI): A momentum indicator that ranges from 0 to 100; values above 70 suggest overbought conditions, while values below 30 indicate oversold conditions, helping traders anticipate potential reversals and make more precise entry and exit decisions.
- Moving Average Convergence Divergence (MACD): Helps identify trend direction, momentum shifts, and potential buy or sell signals by comparing short-term and long-term moving averages, offering traders a clear indication of market momentum and strength.
3. Support and Resistance Levels
- Support: A price level where buying pressure is strong enough to prevent further declines is often used as an entry point for long positions, as traders expect the price to bounce back from these levels, making it a critical factor in decision-making.
- Resistance: A price level where selling pressure prevents further upward movement, often acting as an exit point for traders who anticipate a reversal or temporary pullback before re-entering the trade at a lower price level.
Understanding these levels helps traders identify potential entry and exit points and develop effective trading strategies by aligning their trades with strong price levels and minimising risks.
Popular Technical Analysis Tools
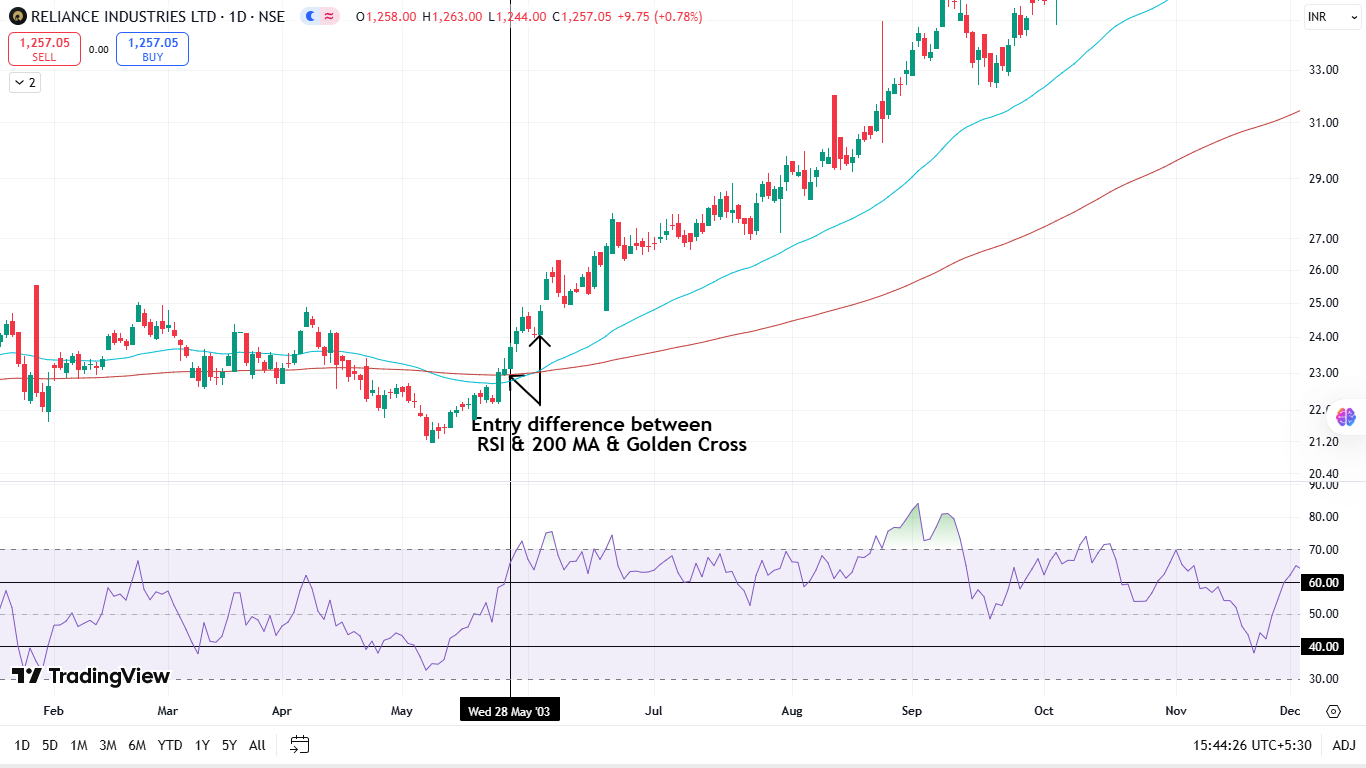
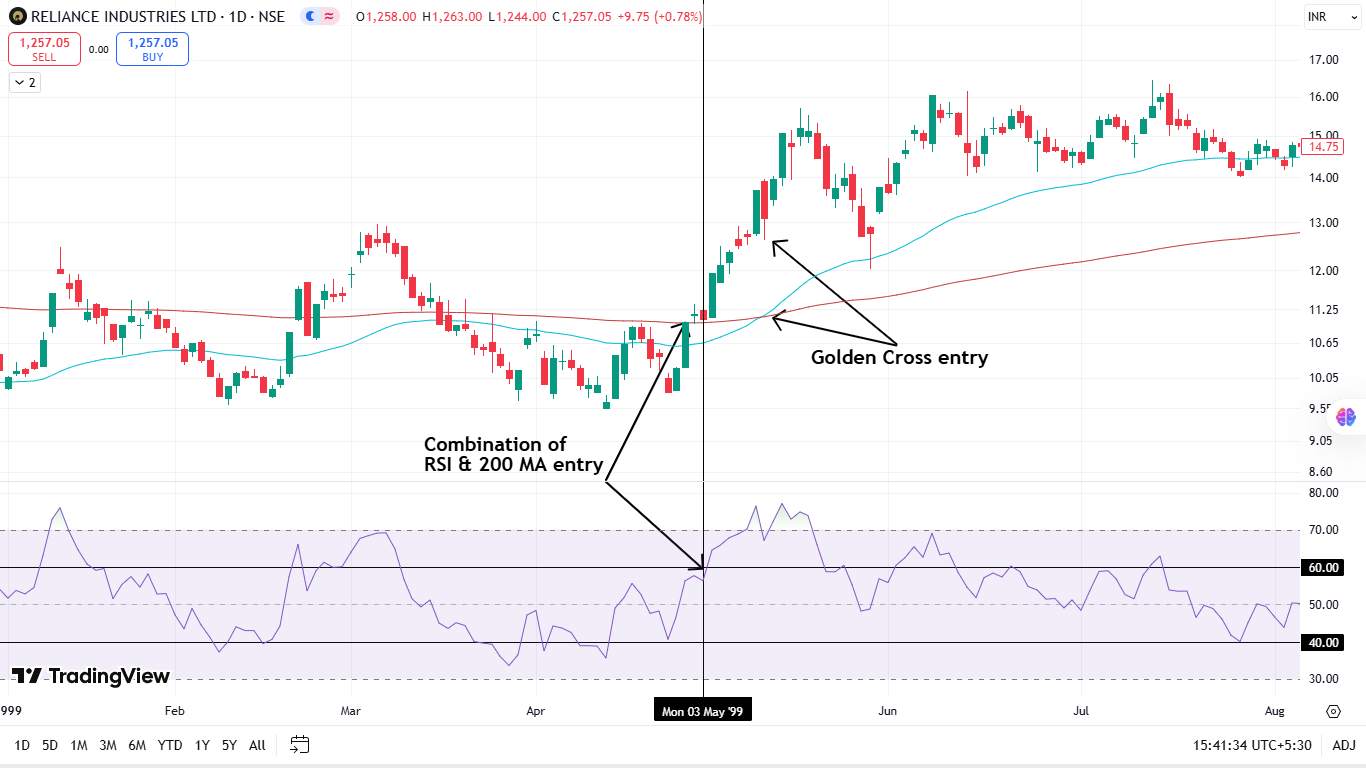
The Golden Crossover & RSI Strategy
The Golden Crossover is one of the most well-known and reliable indicators in technical analysis. However, it is important to acknowledge that it is a lagging indicator, meaning it reacts to price movements rather than predicting them. To refine entry points and make them more timely, traders can incorporate leading indicators such as the Relative Strength Index (RSI) to enhance trade execution.
How Can RSI Improve the Golden Crossover Strategy?
The process is straightforward:
- Draw a horizontal line at the 60 level on the RSI indicator.
- Wait for the stock price to cross above the 200-day Moving Average (MA) while simultaneously having the RSI break above the 60 level.
Why Is This Effective?
By using this combination, traders can enter positions earlier than waiting solely for the Golden Crossover signal. Once the crossover occurs (serving as the final confirmation), traders can stay in the position longer, potentially maximising returns.
Limitations of This Approach
No trading strategy is foolproof. This method has certain drawbacks:
- It may not be as effective in the long run unless confirmed by the convergence of the 50-day and 200-day MAs.
- There will be instances where, despite confirmation, the stock reverses direction. To mitigate risks, it is advisable to set a stop-loss below the breakout candle, ensuring capital protection.
The following charts represent the same.
Technical Analysis vs. Fundamental Analysis
Technical analysis and fundamental analysis are two distinct approaches used by traders and investors to analyse securities and make informed trading decisions. Understanding their differences can help traders choose the right strategy based on their investment goals and risk appetite.
|
Aspect |
Technical Analysis |
Fundamental Analysis |
|---|---|---|
|
Focus |
Analyses price movements, patterns, and market behaviour to understand trader psychology. |
Studies a company’s financial performance, business fundamentals, and economic conditions. |
|
Data Used |
Charts, technical indicators (like RSI, MACD), trading volume, and historical price action. |
Revenue, earnings, balance sheets, cash flows, industry trends, and economic data. |
|
Time Frame |
Short to medium-term; suitable for day trading, swing trading, and momentum strategies. |
Long-term outlook: ideal for buy-and-hold investing based on company fundamentals. |
|
Decision Basis |
Based on market sentiment, support & resistance levels, and technical indicators. |
Based on intrinsic value, growth potential, profitability, and competitive advantage. |
|
Best For |
Day traders, swing traders, and momentum traders are looking for quick gains. |
Long-term investors, value investors, and institutional investors are focused on sustained growth. |
Understanding the strengths and limitations of both methods can help traders optimise their strategies and improve their decision-making in the financial markets.
Limitations of Technical Analysis
1. Subjectivity
Different traders may interpret charts and patterns differently, leading to varying conclusions. This can result in conflicting signals, making it challenging to determine the best course of action. Moreover, emotions such as fear and greed can influence how traders perceive patterns, further increasing the risk of misinterpretation.
2. Market Anomalies
Unexpected events like financial crises, interest rate changes, corporate scandals, or geopolitical tensions can disrupt market patterns and render technical indicators ineffective. Since technical analysis relies heavily on historical data, it does not account for sudden, external shocks that may cause drastic price movements, making it essential for traders to stay informed about macroeconomic factors and global events.
Advantages and Limitations of Technical Analysis
Like any trading approach, technical analysis has its strengths and its drawbacks. It can be extremely useful, but only if you understand where it works well and where it doesn’t.
|
Advantages of Technical Analysis |
Limitations of Technical Analysis |
|---|---|
|
It helps you identify market trends, whether the market is bullish, bearish, or moving sideways, which makes decision-making more structured. |
It can be subjective at times, as different traders may read the same chart differently and come to completely different conclusions. |
|
It provides clear entry and exit signals, helping you decide when to buy, sell, or stay out of a trade. |
Since it focuses only on price and volume data, it may ignore important fundamental factors affecting a stock. |
|
It supports better risk management by helping you set stop-loss levels and control potential losses. |
It may not work well in all market conditions and can sometimes give false or misleading signals. |
|
Because it is based on data and indicators, it offers a more structured and disciplined approach to trading. |
It requires practice, skill, and experience, which means beginners may find it difficult to use effectively at first. |
Conclusion
Technical analysis is a valuable tool for traders who want to anticipate price movements based on past trends and patterns. By understanding charts, indicators, and key levels, you can make smarter trading decisions. However, always combine it with risk management and continuous learning to stay ahead in the market.
Frequently Asked Questions FAQs
What is technical analysis, and how does it work?
Technical analysis is a method of evaluating financial assets by analysing historical price charts and trading volume. It works on the principle that market prices follow trends and patterns that tend to repeat over time. Traders use indicators like moving averages, RSI, MACD, and chart patterns to predict future price movements.
What are the best technical indicators for trading?
The best indicators depend on the trader’s strategy, but some widely used ones include:
- Moving Averages (MA, EMA): Identify trends.
- Relative Strength Index (RSI): Measures momentum and overbought/oversold conditions.
- MACD (Moving Average Convergence Divergence): Detects trend strength and reversals.
- Bollinger Bands: Measures volatility.
- Volume Profile: Helps understand buying/selling pressure.
Can technical analysis be used for long-term investing?
While technical analysis is primarily used for short-term trading, long-term investors also use it to time their entries and exits. For example, moving averages help identify long-term trends, while support & resistance levels assist in buying at dips and selling at peaks. However, long-term investors typically combine fundamental analysis with technical analysis for better decision-making.
Which is better: Technical or Fundamental Analysis?
- Technical Analysis is better for short-term trading and market timing. It focuses on price action, trends, and indicators.
- Fundamental Analysis is better for long-term investing. It evaluates a company’s financial health, earnings, and growth potential.
Many traders and investors use a combination of both for a well-rounded approach.
Does technical analysis actually work?
Yes, but it’s not foolproof. Technical analysis works best when used with proper risk management and discipline. It helps traders identify probabilities of price movements rather than certainties. Success depends on experience, market conditions, and how well a trader interprets charts and indicators.
Disclaimer: This content is for educational purposes only and does not constitute financial or investment advice. Investments in securities or other financial instruments are subject to market risk, including partial or total loss of capital. Past performance is not indicative of future results. Always consider your financial situation carefully and consult a licensed financial advisor before making investment or trading decisions.
Table of Content
- Key Takeaways
- Introduction to Technical Analysis in Trading
- What Is Technical Analysis?
- How is Technical Analysis Used?
- Key Components of Technical Analysis
- Popular Technical Analysis Tools
- Technical Analysis vs. Fundamental Analysis
- Limitations of Technical Analysis
- Advantages and Limitations of Technical Analysis
- Conclusion
- Frequently Asked Questions FAQs
Engineered for the obsessed. Built for traders.

Purpose-built terminals.
Zero compromise.
Built for speed.
Plot No 1290, 2nd Floor, 17th Cross, 5th Main, Sector-7, HSR Layout, Bangalore 560102
Follow us on
Mintcap Brokers Private Limited
CIN – U66110KA2023PTC178706 | Registered Address: Plot No 1290, Second Floor, 17th Cross, 5th Main, Sector-7, HSR Layout, Bangalore 560102 | Tel: 080 – 49552310 | Email ID: compliance@capmint.com | SEBI registered Stock Broker: INZ000322732 | NSE Cash/F&O Member ID: 90430 | BSE Cash/F&O Member ID: 6903 | MCX Member ID: 57400 | NCDEX Member ID: 1312 | SEBI registered Depository Participant: IN-DP-806-2025 | CDSL DP ID: 12102300 | NSE Clearing Member code: M70108 | AMFI-Registered Mutual Fund Distributor: ARN-289109 (Valid upto 28-Feb-2027) | Category II Execution Only Platform : E6903
Details of Client Bank Account
Compliance Officer: Ms. Shridevi Vungarala | Email ID: compliance@capmint.com | Tel no. + 91 9035330126 | Grievance Redressal Officer (GRO) – Ms. Shikha Gupta | Email ID: Grievance@capmint.com | Tel no: 9035331595.
Procedure to file a complaint on SEBI SCORES: Register on SCORES portal. Mandatory details for filing complaints on SCORES: Name, PAN, Address, Mobile Number, E-mail ID. Benefits: Effective Communication, Speedy redressal of the grievances. You may refer the website https://scores.sebi.gov.in/ for more information. You may also download the SEBI Scores app to log a complaint Android: https://play.google.com > store > apps > sebiscores iOS: https://apps.apple.com > app > sebiscores
Disclaimer
Investment in the securities market are subject to market risks, read all the related documents carefully before investing. Brokerage will not exceed the SEBI prescribed limit.
Mutual fund investments are subject to market risks, read all scheme related documents carefully before investing. Mutual Funds are not exchange-traded products.
Attention Investor:
- Stock Brokers can accept securities as margin from clients only by way of pledge in the depository system w.e.f. September 1, 2020.
- Update your mobile number & email Id with your stock broker/depository participant and receive OTP directly from depository on your email id and/or mobile number to create pledge.
- Pay 20% as upfront margin of the transaction value to trade in cash market segment.
- Investors may please refer to the Exchange’s Frequently Asked Questions (FAQs) issued vide circular reference NSE/INSP/45191 dated July 31, 2020 and NSE/INSP/45534 dated August 31, 2020 and other guidelines issued from time to time in this regard.
- Check your Securities /MF/ Bonds in the consolidated account statement issued by NSDL/CDSL every month.