
Link copied!
Ichimoku Cloud
The Ichimoku Cloud is a technical indicator that shows you the trend direction, support and resistance levels, and momentum of a stock all in one chart. It helps traders quickly understand whether to buy, sell, or wait by using five lines and a shaded area called the “cloud.”
Key Takeaways
- What is Ichimoku Cloud: The Ichimoku Cloud is a technical analysis tool that helps traders understand the market trend, support and resistance levels, and momentum, all at once, in one chart. It was created in Japan and is also called the “one glance equilibrium chart” because it shows the market’s overall picture in a single view.
- How does it work: It uses five lines and a shaded area (called the Cloud) to show trend direction and strength. These lines calculate average prices over different periods and help traders know if the market is moving up, down, or sideways.
- How to use it for trading: When the price is above the cloud, it’s a signal to buy; when it’s below, it’s a signal to sell. Crossovers between lines and cloud breakouts give strong buy/sell signals. It also includes a “lagging line” to confirm if the trend is real.
- What are its limits? While it works great in trending markets, it may give false signals during sideways markets or on very short timeframes like 1-minute charts. Also, it can look messy for beginners because of too many lines.
Understanding Ichimoku Cloud
The Ichimoku Cloud, also known as Ichimoku Kinko Hyo, is a technical indicator created by Japanese journalist Goichi Hosoda in the late 1930s. After spending years testing and refining it, he published it in the 1960s.
The term Ichimoku Kinko Hyo means one glance equilibrium chart. And that’s exactly what it does: it helps traders understand the market at a single glance.
Unlike most indicators that show just one thing, like trend or momentum, the Ichimoku Cloud combines several elements in one tool. It shows the trend direction, identifies support and resistance levels, and measures the strength of the trend. It also tries to predict future price movement, not just what’s happening now or in the past. Most importantly, it gives visual signals that help traders decide when to buy or sell.
What is the Historical Development of Ichimoku Cloud?
The Ichimoku Cloud, also known as Ichimoku Kinko Hyo, was developed by Japanese journalist Goichi Hosoda in the 1930s. His goal was to create an indicator that could provide a complete view of the market at a glance, combining trend, momentum, and support/resistance in one system.
Hosoda spent several years testing and refining the indicator with the help of students, analysing historical price data to improve its accuracy. After decades of research, the Ichimoku Cloud was officially introduced to the public in 1969.
Over time, it gained popularity among Japanese traders and later spread globally. Today, it is widely used across stocks, forex, and crypto markets due to its ability to provide a comprehensive and visual understanding of market conditions.
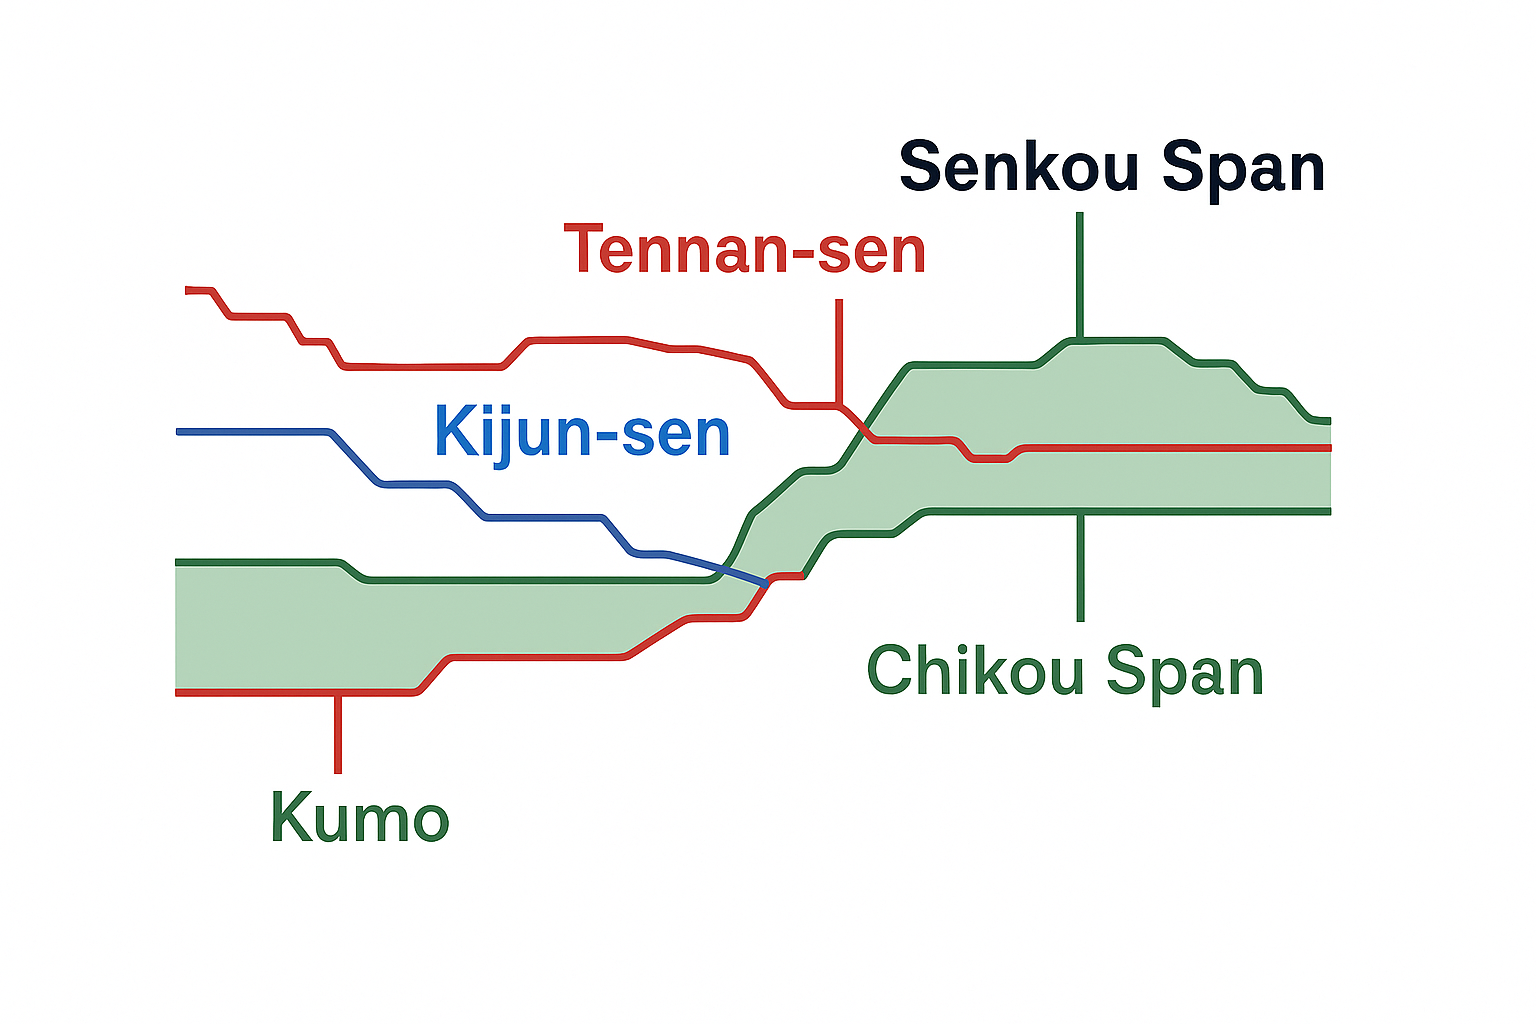
Key Components of Ichimoku Cloud
To understand how the Ichimoku Cloud works, let’s quickly break down its key parts. Each line has a purpose, and together, they tell a full story about the market.
1. Tenkan-sen (Conversion Line)
This is the short-term trend line.
Formula: (Highest high + Lowest low) over the last 9 periods ÷ 2
It shows the average mid-point of price over a short time, like a faster-moving average. If prices are moving up quickly, this line reacts fast and helps spot early trend changes.
2. Kijun-sen (Base Line)
This is the medium-term trend line.
Formula: (Highest high + Lowest low) over the last 26 periods ÷ 2
This is slower and steadier than Tenkan-sen. It smooths out price movement over a longer period. It works like a confirmation line; if the price stays above this, the uptrend is strong.
3. Senkou Span A (Leading Span A)
This forms one side of the Cloud (Kumo).
Formula: (Tenkan-sen + Kijun-sen) ÷ 2
Plotted 26 periods ahead
It averages the short and medium-term trend lines and plots them ahead of the current time. This gives a forward-looking support/resistance level, showing where the price might find balance in the future.
4. Senkou Span B (Leading Span B)
This forms the second side of the Cloud.
Formula: (Highest high + Lowest low) over the past 52 periods ÷ 2
Also plotted 26 periods ahead.
This is an even slower average that reflects long-term price levels. When combined with Span A, it creates the Cloud area (Kumo), and the thicker the Cloud, the stronger the support or resistance zone.
5. Chikou Span (Lagging Span)
This is the closing price plotted 26 periods behind.
It helps confirm trends. If the Chikou Span is above past prices, the trend is strong. If it’s below, the trend is weak. It’s like a shadow that checks whether the current trend is supported by past price action.
Here is the pictorial representation of all these bands
How to Read the Ichimoku Cloud?
There are multiple lines in this indicator, but the cloud (also called Kumo) is the most visual and powerful part of the Ichimoku system. Here’s how to understand what it’s telling you:
Cloud Colour and Thickness
A thicker cloud means stronger support or resistance. It shows that the market is less likely to break through. A thin cloud means weaker support/resistance, and the price may break out easily.
Price Position with Cloud
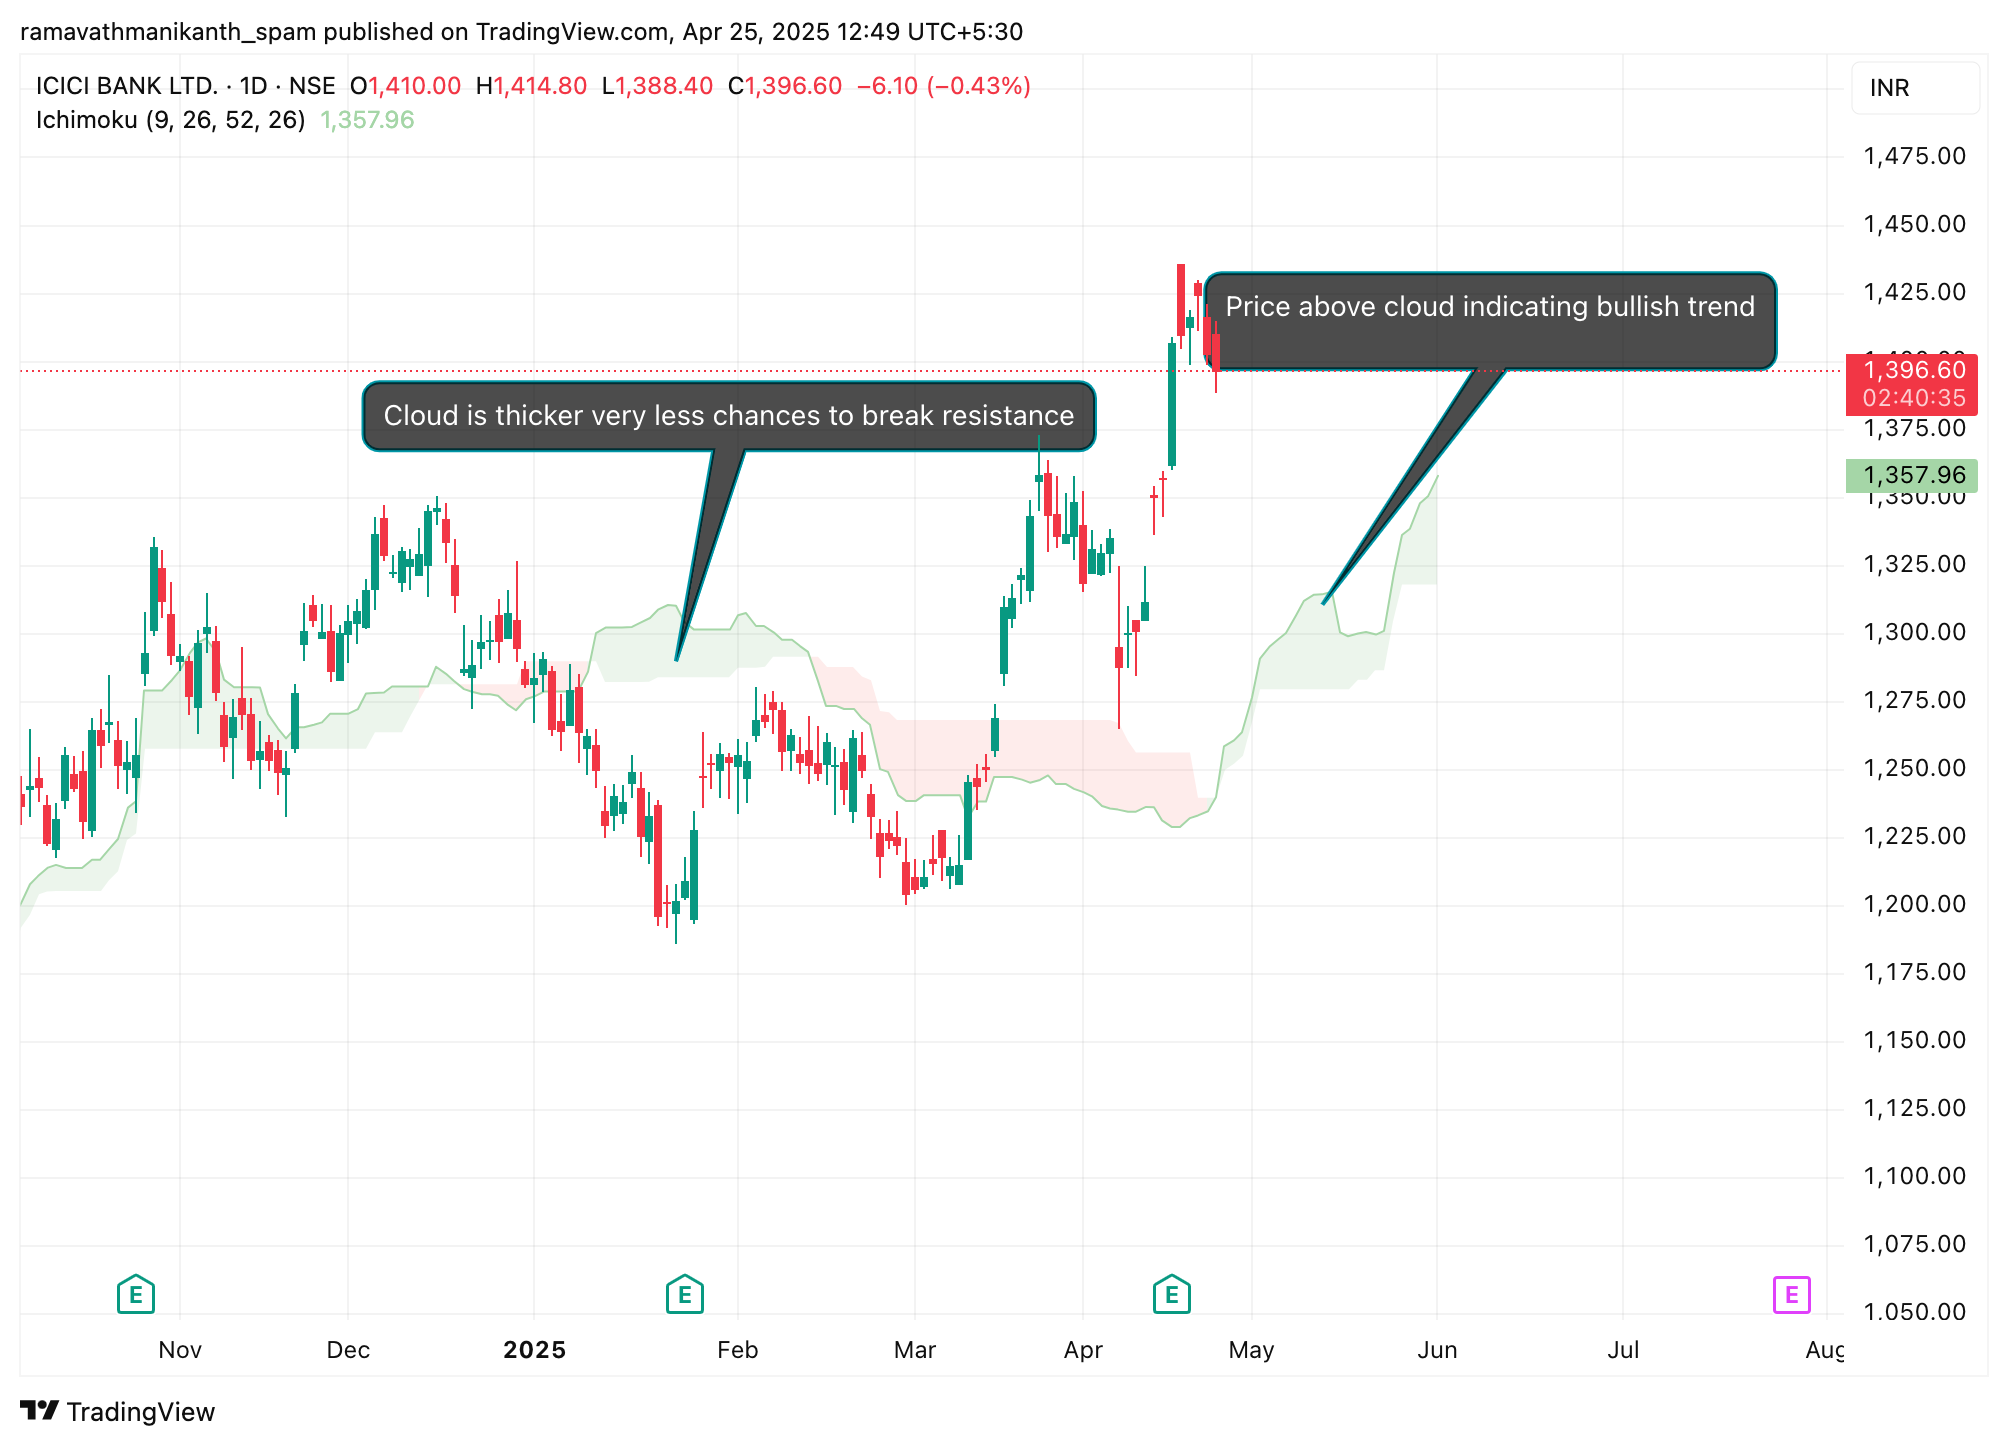
When the price is above the cloud, it signals a bullish trend; below the cloud indicates a bearish trend; and inside the cloud suggests market uncertainty or a sideways phase.
Trading Signals With Ichimoku Cloud
Now that you know how to read the cloud, let’s look at how it actually gives buy and sell signals during real trades.
Bullish Crossover
When the Tenkan-sen crosses above the Kijun-sen, it’s a buy signal. This shows short-term momentum is picking up in an uptrend. For example, in the ICICI Bank chart below, when the Tenkan-sen (red line) crossed Kijun-sen (blue line) from below, it gave a bullish crossover signal indicating a potential upward move.
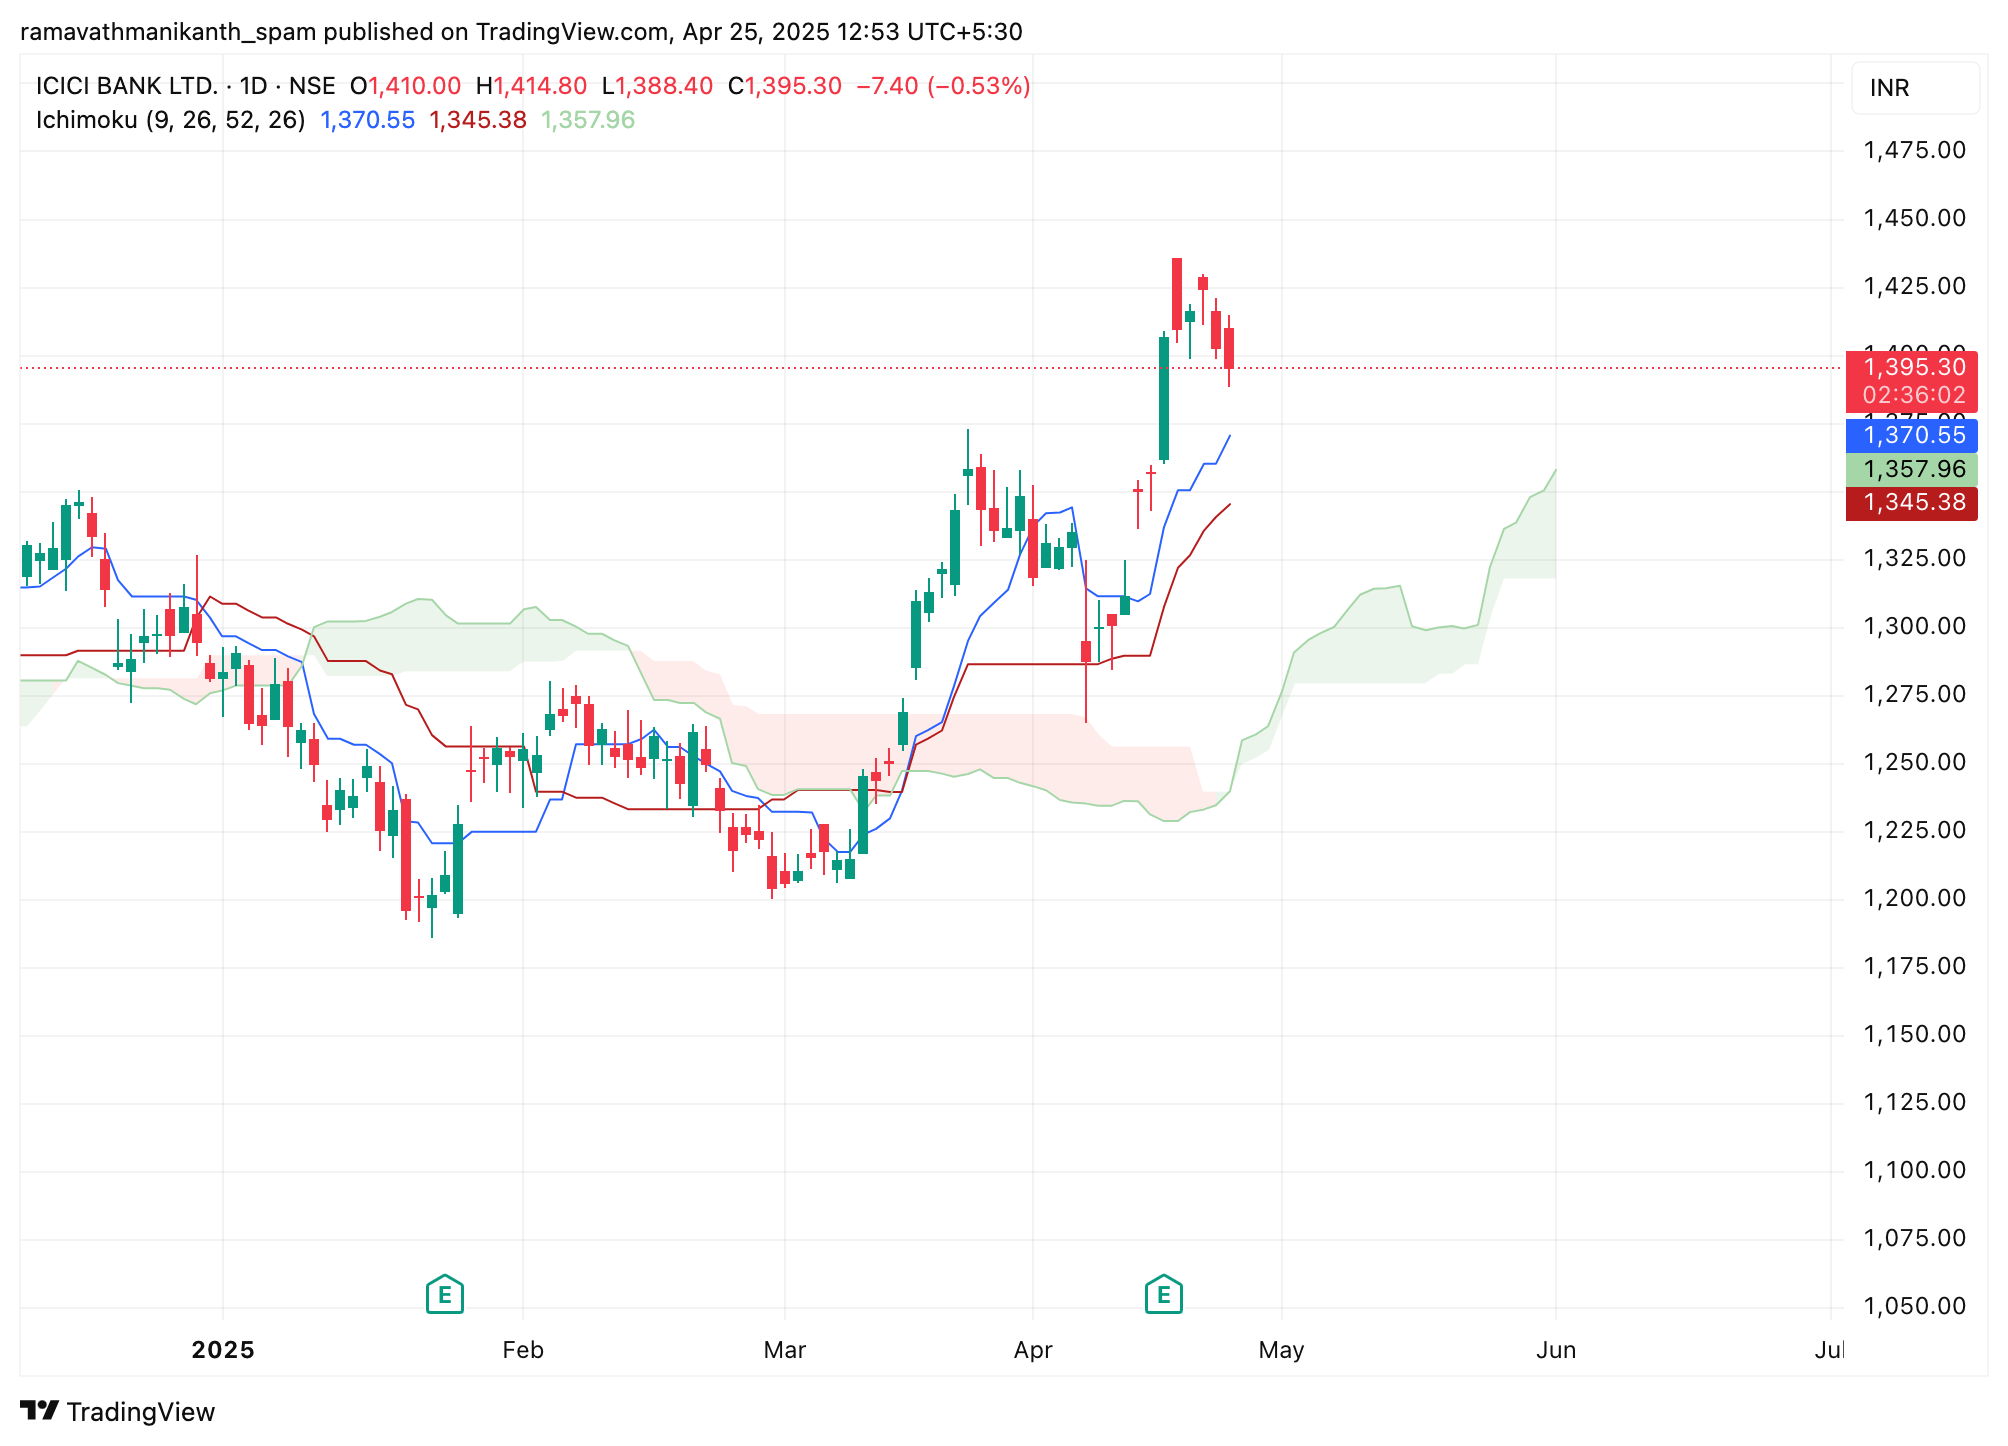
Bearish Crossover
When the Tenkan-sen crosses below the Kijun-sen, it’s a sell signal. This indicates potential weakness or the start of a downtrend.
Kumo Breakout
When the price breaks above the cloud, it signals a bullish breakout.
If the price falls below the cloud, it’s a bearish breakout. Stronger signals if the breakout happens with volume and a clear distance from the cloud.
Chikou Span Confirmation
The Chikou Span (lagging line) should be above the price in bullish setups and below the price in bearish setups. It acts as a filter to confirm if the signal has strong market backing.
Limitations Of Ichimoku Cloud
While the Ichimoku Cloud is powerful, it’s not perfect. Let’s quickly look at where it can fall short or give misleading signals.
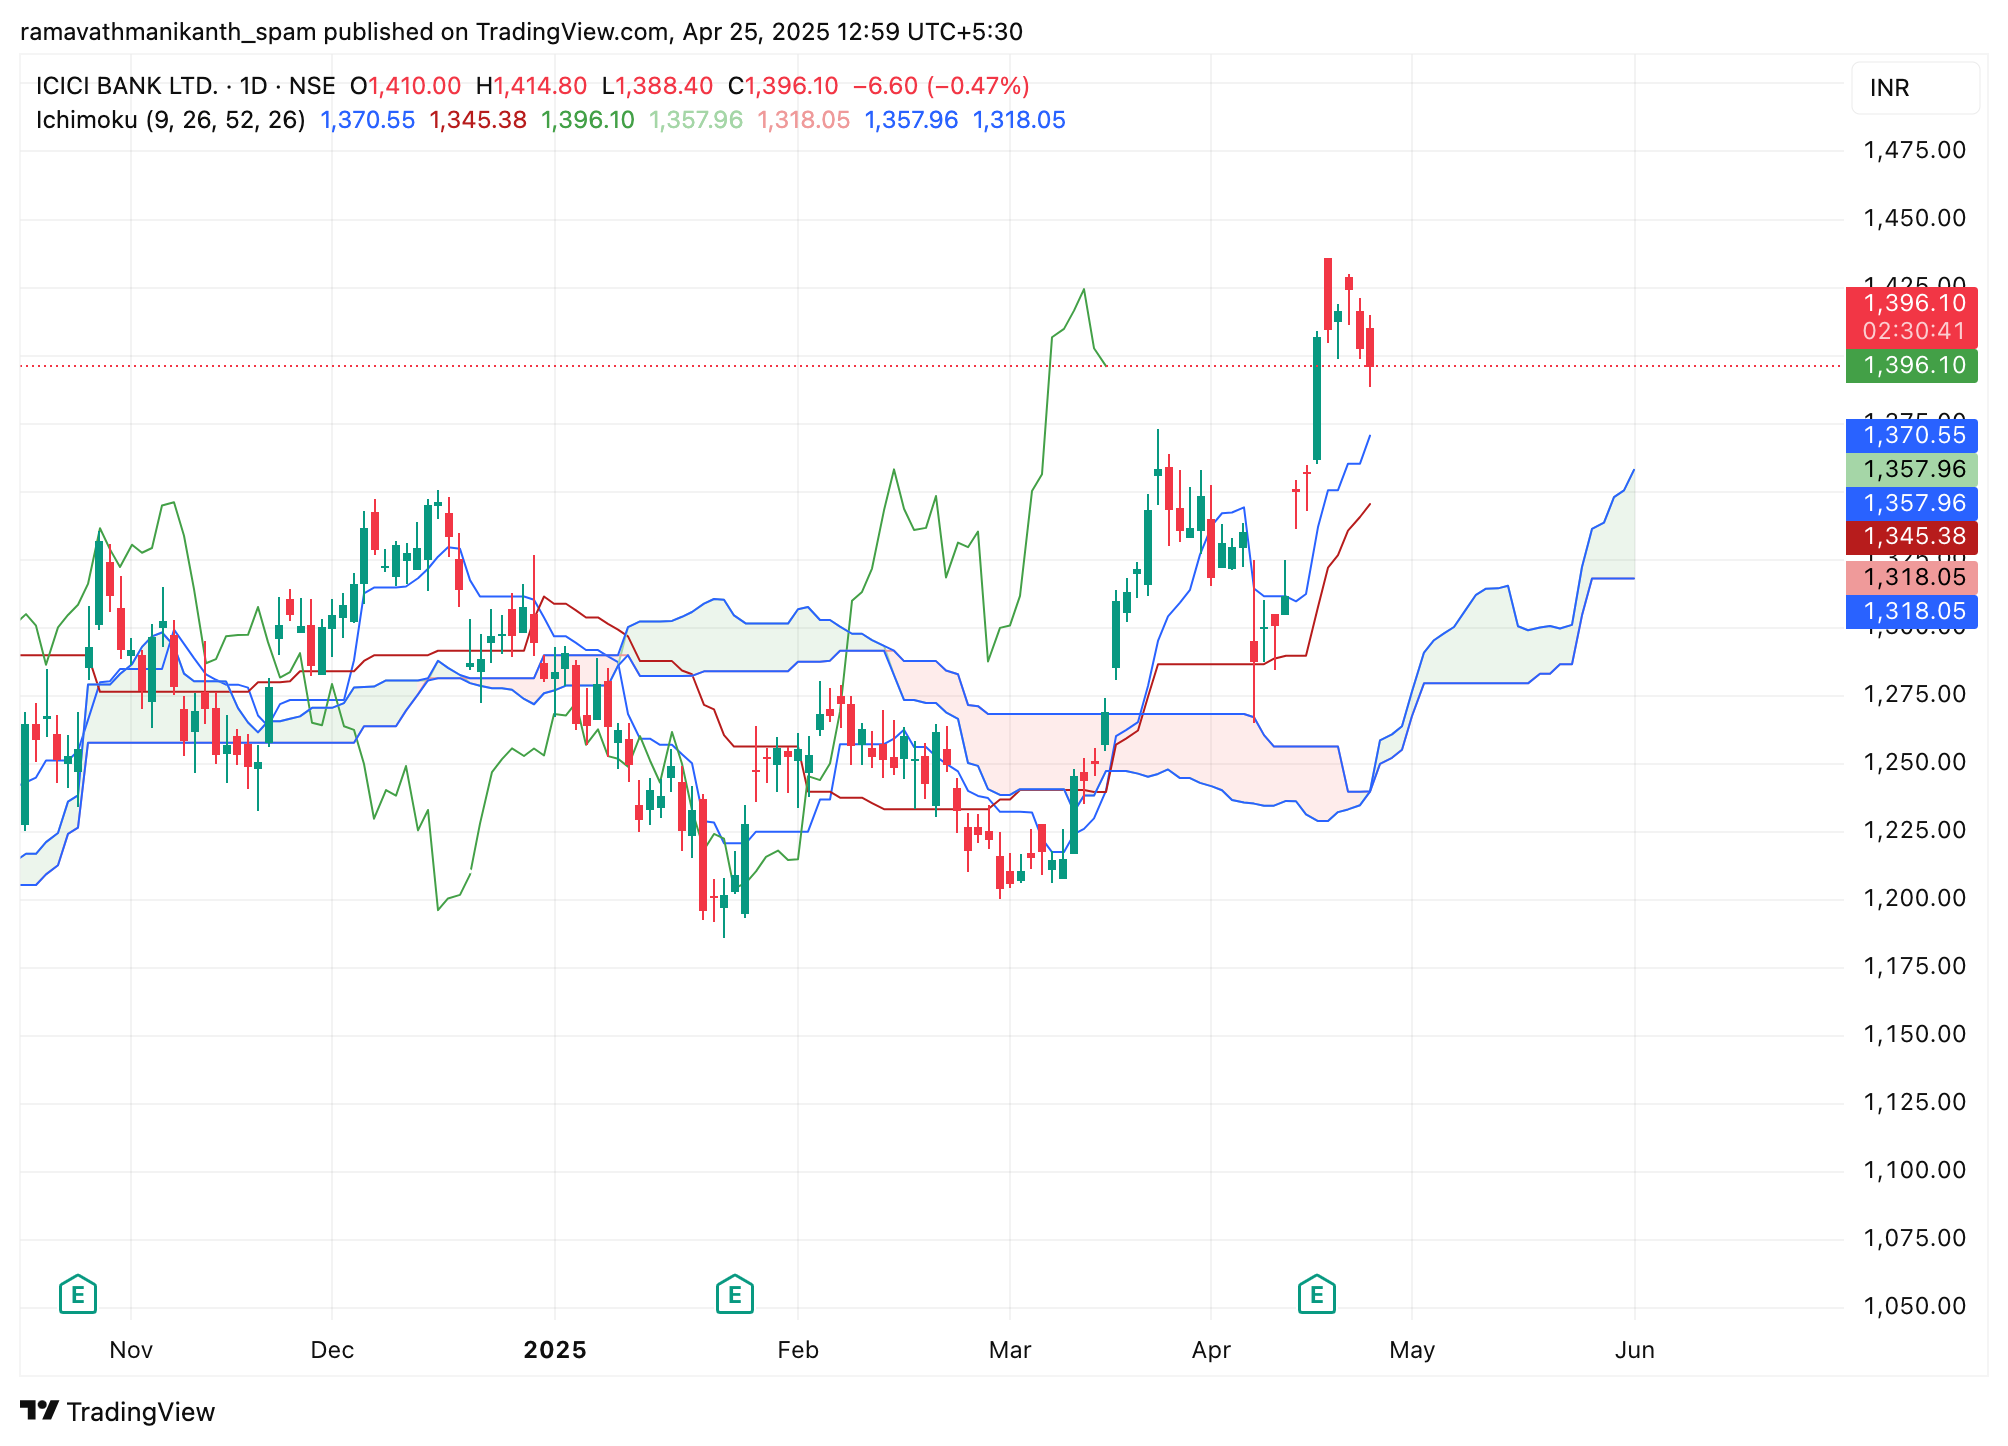
Cluttered View:
The Ichimoku Cloud includes five different lines plus a shaded area, which can make charts look complicated, especially when combined with other indicators. For new traders, it might feel overwhelming and hard to focus on what really matters unless the chart is cleaned up or zoomed in. Here is the Ichimoku cloud with all its components:
Not Ideal for Very Short Timeframes:
Ichimoku is designed to capture broader trends, not quick moves. On lower timeframes like 1-minute or 5-minute charts, the indicator may lag or generate frequent false signals. It’s not the best fit for scalpers who need fast and sharp entries and exits.
Less Effective in Sideways Markets:
This system works best in strong trending environments. In sideways or ranging markets, crossovers and cloud breakouts happen more often but without real follow-through. This can lead to whipsaws, frequent trades that end in small losses instead of clear wins.
Conclusion
The Ichimoku Cloud may look complex at first, but it brings together trend, momentum, and support/resistance into one simple visual system. Once you understand what each line means and how to read the cloud, it can help you make more confident trading decisions. It’s especially useful in trending markets and works well for spotting entry and exit points. However, like any indicator, it’s not perfect. It’s important to combine it with other tools or basic price action to avoid false signals. With some practice, the Ichimoku Cloud can become a reliable part of your trading strategy.
Frequently Asked Questions
How effective is the Ichimoku Cloud?
The Ichimoku Cloud is very effective in trending markets. It gives a full view of trend direction, strength, and support/resistance in one chart. But in sideways or choppy markets, it may give false signals, so it’s best used with other tools or filters.
What are the five lines of Ichimoku?
- Tenkan-sen (Conversion Line) – short-term trend
- Kijun-sen (Base Line) – medium-term trend
- Senkou Span A – one boundary of the cloud
- Senkou Span B – the other boundary of the cloud
- Chikou Span (Lagging Line) – trend confirmation
Which time frame is best for Ichimoku?
Ichimoku works best on higher timeframes like 1-hour, 4-hour, or daily charts. On lower timeframes like 1-minute or 5-minute, it can be noisy and less reliable.
What are the green and red lines in Ichimoku?
The red line is usually the Tenkan-sen (Conversion Line), showing short-term price movement. The green line is the Chikou Span (Lagging Line), which helps confirm the trend by comparing the current price to the past price.
How to use Ichimoku Cloud?
Ichimoku Cloud is used to identify trend, support/resistance, and momentum. Traders look at price position relative to the cloud, Tenkan-Kijun crossovers, and cloud direction. A price above the cloud suggests an uptrend, while a price below indicates a downtrend.
Is the Ichimoku Cloud strategy good?
Yes, it is a comprehensive indicator that combines trend, momentum, and support/resistance in one system. It works well in trending markets but may give false signals in sideways conditions, so confirmation with other indicators is useful.
What is the success Rate of Ichimoku?
There is no fixed success rate, as it depends on market conditions, timeframe, and trader discipline. When used correctly with confirmation signals, it can be effective, especially in strong trending markets.
Can Ichimoku Cloud Predict the Future?
No, Ichimoku Cloud does not predict the future. It provides a structured view of current trends and potential future support and resistance levels, helping traders make informed decisions rather than exact predictions.
Disclaimer: This content is for educational purposes only and does not constitute financial or investment advice. Investments in securities or other financial instruments are subject to market risk, including partial or total loss of capital. Past performance is not indicative of future results. Always consider your financial situation carefully and consult a licensed financial advisor before making investment or trading decisions.
Engineered for the obsessed. Built for traders.

Purpose-built terminals.
Zero compromise.
Built for speed.
Plot No 1290, 2nd Floor, 17th Cross, 5th Main, Sector-7, HSR Layout, Bangalore 560102
Follow us on
Mintcap Brokers Private Limited
CIN – U66110KA2023PTC178706 | Registered Address: Plot No 1290, Second Floor, 17th Cross, 5th Main, Sector-7, HSR Layout, Bangalore 560102 | Tel: 080 – 49552310 | Email ID: compliance@capmint.com | SEBI registered Stock Broker: INZ000322732 | NSE Cash/F&O Member ID: 90430 | BSE Cash/F&O Member ID: 6903 | MCX Member ID: 57400 | NCDEX Member ID: 1312 | SEBI registered Depository Participant: IN-DP-806-2025 | CDSL DP ID: 12102300 | NSE Clearing Member code: M70108 | AMFI-Registered Mutual Fund Distributor: ARN-289109 (Valid upto 28-Feb-2027) | Category II Execution Only Platform : E6903
Details of Client Bank Account
Compliance Officer: Ms. Shridevi Vungarala | Email ID: compliance@capmint.com | Tel no. + 91 9035330126 | Grievance Redressal Officer (GRO) – Ms. Shikha Gupta | Email ID: Grievance@capmint.com | Tel no: 9035331595.
Procedure to file a complaint on SEBI SCORES: Register on SCORES portal. Mandatory details for filing complaints on SCORES: Name, PAN, Address, Mobile Number, E-mail ID. Benefits: Effective Communication, Speedy redressal of the grievances. You may refer the website https://scores.sebi.gov.in/ for more information. You may also download the SEBI Scores app to log a complaint Android: https://play.google.com > store > apps > sebiscores iOS: https://apps.apple.com > app > sebiscores
Disclaimer
Investment in the securities market are subject to market risks, read all the related documents carefully before investing. Brokerage will not exceed the SEBI prescribed limit.
Mutual fund investments are subject to market risks, read all scheme related documents carefully before investing. Mutual Funds are not exchange-traded products.
Attention Investor:
- Stock Brokers can accept securities as margin from clients only by way of pledge in the depository system w.e.f. September 1, 2020.
- Update your mobile number & email Id with your stock broker/depository participant and receive OTP directly from depository on your email id and/or mobile number to create pledge.
- Pay 20% as upfront margin of the transaction value to trade in cash market segment.
- Investors may please refer to the Exchange’s Frequently Asked Questions (FAQs) issued vide circular reference NSE/INSP/45191 dated July 31, 2020 and NSE/INSP/45534 dated August 31, 2020 and other guidelines issued from time to time in this regard.
- Check your Securities /MF/ Bonds in the consolidated account statement issued by NSDL/CDSL every month.