
Table of Content
- Key Takeaways
- What is a Doji Candlestick Pattern?
- Significance of Doji in Technical Analysis
- Types of Doji Candlestick Patterns
- The Psychology Behind the Formation of a Doji
- Interpreting Doji Patterns in Different Market Contexts
- Limitations and Considerations When Using Doji Patterns
- Practical Examples of Doji Patterns in Trading
- Conclusion
- Frequently Asked Questions (FAQs)
Link copied!
Doji Candlestick Pattern
A Doji candlestick pattern is a type of candlestick that represents market indecision. It forms when a security’s opening and closing prices are nearly equal, resulting in a candle with a very small or non-existent body and long or short wicks (shadows) on either side.
Key Takeaways
- A Doji candlestick forms when the opening and closing prices are nearly the same, signalling market indecision.
- Different types of Doji patterns indicate potential trend reversals or pauses, depending on their placement in a trend.
- A Doji can signal both reversals and continuations, requiring confirmation from other technical indicators.
- Doji patterns are not standalone signals; traders should use risk management strategies to avoid false predictions.
What is a Doji Candlestick Pattern?
A Doji is a unique candlestick pattern where the opening and closing prices of an asset are nearly identical, forming a short or non-existent body that resembles a cross or plus sign. The term “Doji” originates from Japanese and means “blunder” or “mistake,” highlighting its rarity.
In trading, a Doji represents a battle between buyers and sellers, with no clear winner, leading to uncertainty about the next price direction. On Indian exchanges, Doji candles appear more frequently than many beginners expect, particularly on daily charts of volatile mid-cap stocks where intraday swings are wide but the net movement by close is negligible. Not every Doji is actionable, which is why context and confirmation matter more than the pattern itself.
Significance of Doji in Technical Analysis
Market Indecision
A Doji signifies a standoff between buyers and sellers, leading to price stagnation and uncertainty about future market direction. It reflects hesitation among traders, making it a crucial signal for market sentiment analysis.
Potential Trend Reversal
A Doji appearing after a strong trend could be an early indication of an impending reversal. If it forms after a prolonged uptrend, it might suggest weakening bullish momentum and a possible downturn. Conversely, after a sustained downtrend, it could hint at a potential bullish reversal. The reversal implication strengthens considerably when the Doji forms near a well-established support or resistance zone rather than in the middle of a trend’s range.
Temporary Market Pause
In some cases, a Doji does not immediately lead to a trend reversal but rather signals a temporary pause in price movement. This can occur during periods of consolidation when the market is gathering strength before making its next move. A common scenario is a Doji forming the day before a major event like an RBI policy announcement or quarterly results, where participants deliberately hold back and wait for new information before committing.
Since a Doji alone is not a definitive trading signal, traders should analyse its occurrence in conjunction with other technical indicators, such as volume analysis, moving averages, and support or resistance levels, to make well-informed trading decisions.
Types of Doji Candlestick Patterns
Let’s explore the popular Doji candlestick patterns now.
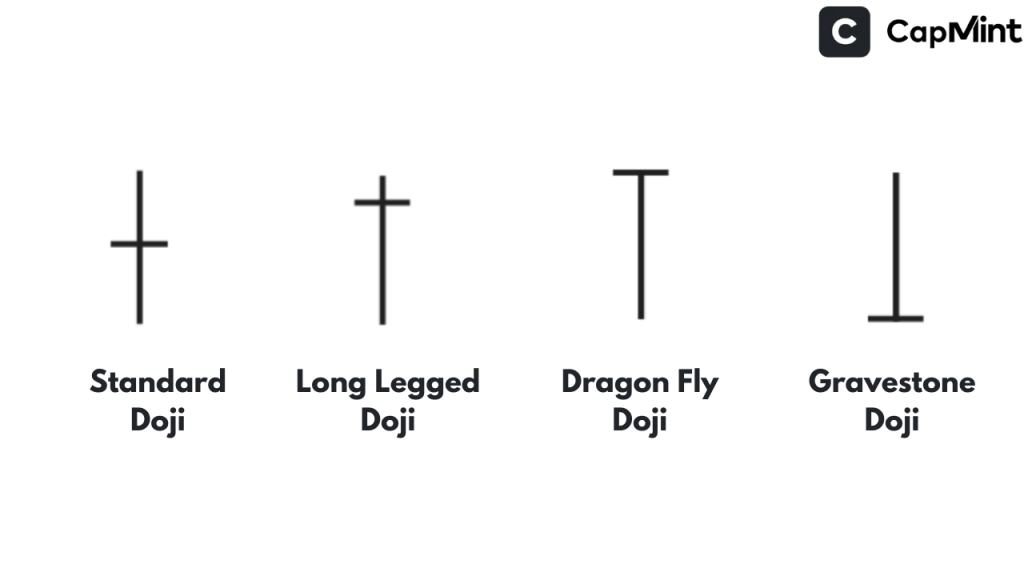
Standard Doji
A basic Doji where the open and close prices are nearly identical. The length of the shadows can vary, reflecting different degrees of market uncertainty. It is a neutral pattern and requires additional confirmation from subsequent price action. In practice, a standard Doji with very short shadows on both sides often indicates low participation rather than genuine indecision, especially if it forms on below-average volume. This distinction matters because low-participation Dojis tend to resolve in the direction of the prior trend rather than reversing it.
Long-Legged Doji
This Doji has extended upper and lower shadows, indicating high volatility within the trading session. It suggests that both buyers and sellers were active, but neither was able to establish dominance, reinforcing market indecision. On Nifty 50 stocks, long-legged Dojis with intraday ranges exceeding 2–3% but near-zero net change tend to appear around major expiry dates or event-driven sessions, and they often precede a directional breakout within the next one to two sessions.
Dragonfly Doji
Forms when the open, high, and close prices are nearly identical, but there is a long lower shadow.
The long lower wick suggests strong buying interest after a period of selling pressure, which could signal a potential bullish reversal, especially when it appears after a downtrend. The length of the lower shadow relative to the stock’s average daily range is a useful gauge. A lower shadow that extends 1.5 to 2 times the stock’s typical daily range carries more weight than one within normal bounds.
Gravestone Doji
A Gravestone Doji pattern forms when the open, low, and close prices are almost the same, with a long upper shadow.
The extended upper wick indicates that buyers initially pushed prices higher, but sellers regained control, forcing the price back down. It is often seen as a bearish reversal signal, particularly in an uptrend. A gravestone Doji near a round-number resistance level, such as ₹500, ₹1,000, or ₹2,000, tends to carry additional psychological significance because these levels naturally attract profit-booking.
The Psychology Behind the Formation of a Doji
A Doji forms when buyers and sellers reach a temporary equilibrium, creating uncertainty in the market. It signals hesitation, where neither bulls nor bears have enough momentum to push prices decisively in one direction. This often happens after a strong trend, suggesting exhaustion and a potential reversal.
Sometimes, a Doji could appear when traders wait for more information, such as economic reports or earnings results. It can also occur during periods of low trading volume, reflecting a lack of commitment from market participants. On truncated trading weeks or sessions before long holidays, Doji formations are particularly common on Indian exchanges as institutional participants reduce activity, and these tend to be less meaningful as reversal signals compared to Dojis that form on full-participation trading days.
While a Doji highlights market indecision, traders should use additional indicators to confirm the next move before acting on it.
Interpreting Doji Patterns in Different Market Contexts
In Uptrends
A Doji appearing after a strong upward move may indicate that buying pressure is weakening, and a bearish reversal could be imminent. Traders should watch for confirmation signals, such as a bearish candlestick pattern forming after the Doji, before considering a sell position. The signal is more compelling when the Doji appears after four or more consecutive green candles, as the uptrend is more clearly established and the indecision carries greater weight.
In Downtrends
When a Doji forms after a prolonged downtrend, it suggests that selling momentum may be fading, potentially leading to a bullish reversal. If the following candlestick is bullish, it can confirm a shift in market sentiment, making it an opportunity to enter a long position. Volume on the confirmation candle matters here. A bullish candle following the Doji on rising volume is far more reliable than one on declining volume, which may simply reflect a temporary pause in selling rather than genuine demand.
During Consolidation
In a sideways market, a Doji generally signifies continued indecision rather than a reversal. In such cases, traders should wait for a breakout from the consolidation range before making a trade decision. The breakout direction, whether bullish or bearish, will provide better clarity on the market’s next move. A common mistake is treating every Doji in a consolidation zone as a potential reversal, which leads to repeated whipsaws and unnecessary trading costs.
Remember that since Doji patterns do not confirm trends on their own, traders should seek additional confirmation using other indicators, such as relative strength index (RSI), moving averages, and Bollinger Bands, to improve the reliability of their trades.
Limitations and Considerations When Using Doji Patterns
While Doji candlestick patterns provide valuable insights into market indecision, they come with certain limitations that traders must be aware of to make informed decisions.
Confirmation is Essential
A Doji on its own is not a strong enough signal to initiate a trade. It must be accompanied by confirmation from subsequent candlestick patterns or technical indicators like moving averages, RSI, or Bollinger Bands to increase reliability.
Market Context Matters
The significance of a Doji depends on its location within a trend. If a Doji appears at the peak of an uptrend or the trough of a downtrend, it could indicate a possible reversal. However, if it forms within a consolidation phase, it may simply reflect ongoing uncertainty with no clear direction.
Potential for False Signals
Doji patterns can sometimes produce misleading signals, particularly in highly volatile markets. Large price swings can cause momentary indecision, forming a Doji that does not necessarily indicate a reversal, leading traders into premature or false trades. During earnings season, for instance, a stock might form a Doji on the day before results and then gap sharply in either direction the next morning, making the Doji itself irrelevant to the subsequent move.
Risk Management is Crucial
Since Doji patterns do not provide clear price targets, traders should implement strong risk management strategies, such as setting stop-loss and take-profit levels based on broader market structure and additional indicators. A practical approach is to place the stop-loss beyond the high or low of the Doji’s shadow, depending on the trade direction, and then use the nearest support or resistance level as the initial target.
Not Always a Reversal Signal
While Doji patterns are often associated with reversals, they do not always lead to a trend change. In many cases, they simply highlight market hesitation, requiring traders to wait for additional confirmations before acting. Across heavily traded indices like Nifty, a significant proportion of Doji candles on the daily chart resolve as continuation patterns rather than reversals, especially when the broader trend has strong momentum behind it.
To maximise the effectiveness of Doji patterns, traders should incorporate them into a broader technical analysis framework, combining them with trend lines, volume analysis, and momentum indicators to make well-informed trading decisions.
Practical Examples of Doji Patterns in Trading
Example 1: Dragonfly Doji in a Small Pull-back
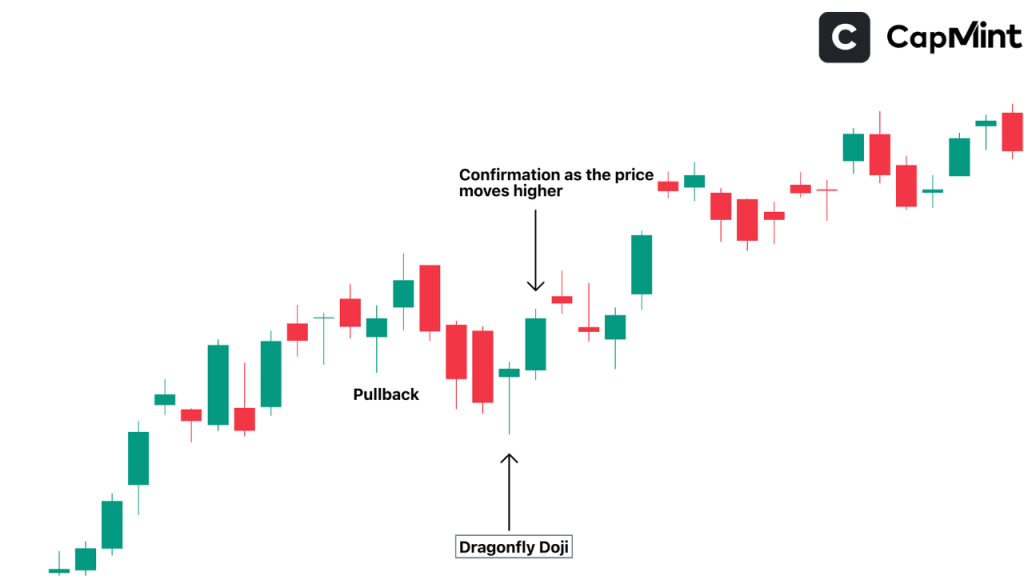
A stock experiencing a small pull-back forms a Dragonfly Doji. If the next candle is a bullish move, it confirms a potential reversal, making it a buying opportunity. This setup tends to work well when the pull-back has brought the stock to a known support level, such as a prior breakout zone or the 20-day moving average, and the lower shadow of the Dragonfly tests that level before recovering.
Example 2: Gravestone Doji in an Uptrend
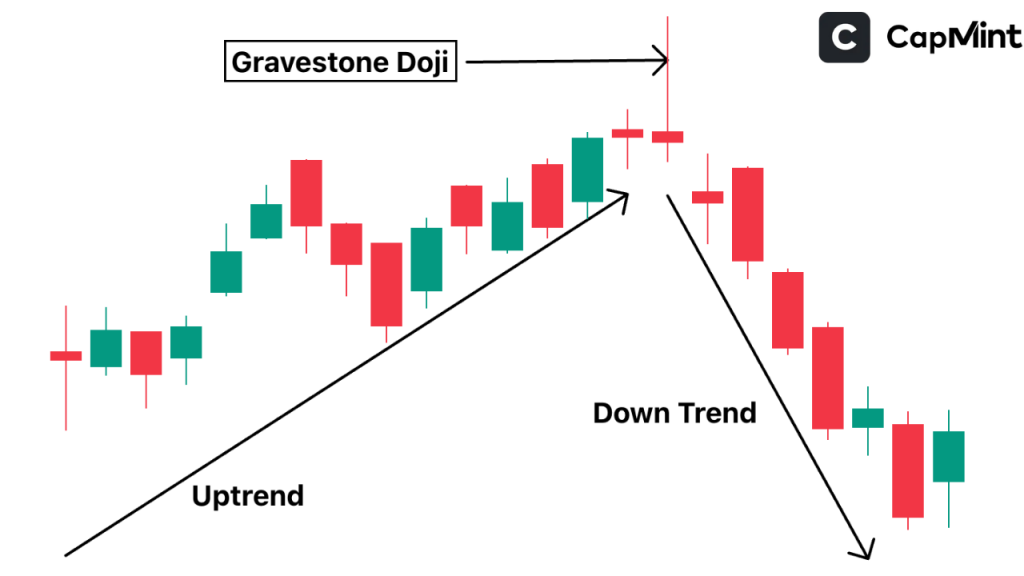
A stock in an uptrend prints a Gravestone Doji. If the next candle is a bearish move, it confirms a potential price drop, signalling a sell opportunity. The conviction behind this signal increases if the upper shadow of the Gravestone Doji pierced a resistance level during the day but failed to hold above it by close, as this represents a clear rejection of higher prices.
These examples highlight the importance of combining Doji patterns with additional confirmation strategies.
Conclusion
The Doji candlestick pattern is a useful tool for traders, indicating market indecision and potential reversals. Recognising the different types of Doji candlestick charts and their implications can meaningfully improve trading strategies. However, it is crucial to use these patterns in conjunction with other technical indicators to avoid false signals. The most reliable Doji setups tend to be those that form at technically significant levels, on meaningful volume, and are followed by a strong confirmation candle in the expected direction. By understanding and applying the Doji pattern correctly within this broader framework, traders can enhance their market predictions and make more informed trading decisions.
Frequently Asked Questions (FAQs)
What does a Doji candlestick indicate?
A Doji candlestick indicates market indecision, where neither buyers nor sellers have full control. It often suggests a potential trend reversal or continuation, depending on the context within the price chart and the strength of the preceding trend.
How reliable is the Doji candlestick for trading decisions?
A Doji alone is not highly reliable; it needs confirmation from the next candlestick. If a Doji appears in an uptrend, a bearish candle after it may confirm a reversal. In a downtrend, a bullish candle following the Doji suggests a potential bullish reversal. The reliability also improves on higher timeframes. A Doji on a daily or weekly chart tends to carry more weight than one on a 15-minute chart, where market noise frequently produces Dojis with little directional significance.
What are the different types of Doji candlestick patterns?
The main types of Doji patterns are:
- Standard Doji: Small body with equal upper and lower shadows.
- Dragonfly Doji: Long lower shadow, no upper shadow (bullish implication).
- Gravestone Doji: Long upper shadow, no lower shadow (bearish implication).
- Long-Legged Doji: Long upper and lower shadows, showing extreme indecision.
How do traders use the Doji in technical analysis?
Traders use Doji patterns to identify potential trend reversals or continuation signals. The key is to check the previous trend and wait for confirmation with the next candle. A Doji near support or resistance levels holds greater significance than one forming in the middle of a trend’s range.
Is a Doji bullish or bearish?
A Doji itself is neutral, but its impact depends on its location:
- In an uptrend, a Doji can signal weakening momentum, potentially leading to a bearish reversal.
- In a downtrend, a Doji may indicate buying interest, possibly resulting in a bullish reversal.
- If followed by a strong bullish or bearish candle, it confirms the direction. Without that confirmation candle, the Doji remains an indecision signal and should not be acted upon in isolation.
Disclaimer: This content is for educational purposes only and does not constitute financial or investment advice. Investments in securities or other financial instruments are subject to market risk, including partial or total loss of capital. Past performance is not indicative of future results. Always consider your financial situation carefully and consult a licensed financial advisor before making investment or trading decisions.
Table of Content
- Key Takeaways
- What is a Doji Candlestick Pattern?
- Significance of Doji in Technical Analysis
- Types of Doji Candlestick Patterns
- The Psychology Behind the Formation of a Doji
- Interpreting Doji Patterns in Different Market Contexts
- Limitations and Considerations When Using Doji Patterns
- Practical Examples of Doji Patterns in Trading
- Conclusion
- Frequently Asked Questions (FAQs)
Engineered for the obsessed. Built for traders.

Purpose-built terminals.
Zero compromise.
Built for speed.
Plot No 1290, 2nd Floor, 17th Cross, 5th Main, Sector-7, HSR Layout, Bangalore 560102
Follow us on
Mintcap Brokers Private Limited
CIN – U66110KA2023PTC178706 | Registered Address: Plot No 1290, Second Floor, 17th Cross, 5th Main, Sector-7, HSR Layout, Bangalore 560102 | Tel: 080 – 49552310 | Email ID: compliance@capmint.com | SEBI registered Stock Broker: INZ000322732 | NSE Cash/F&O Member ID: 90430 | BSE Cash/F&O Member ID: 6903 | MCX Member ID: 57400 | NCDEX Member ID: 1312 | SEBI registered Depository Participant: IN-DP-806-2025 | CDSL DP ID: 12102300 | NSE Clearing Member code: M70108 | AMFI-Registered Mutual Fund Distributor: ARN-289109 (Valid upto 28-Feb-2027) | Category II Execution Only Platform : E6903
Details of Client Bank Account
Compliance Officer: Ms. Shridevi Vungarala | Email ID: compliance@capmint.com | Tel no. + 91 9035330126 | Grievance Redressal Officer (GRO) – Ms. Shikha Gupta | Email ID: Grievance@capmint.com | Tel no: 9035331595.
Procedure to file a complaint on SEBI SCORES: Register on SCORES portal. Mandatory details for filing complaints on SCORES: Name, PAN, Address, Mobile Number, E-mail ID. Benefits: Effective Communication, Speedy redressal of the grievances. You may refer the website https://scores.sebi.gov.in/ for more information. You may also download the SEBI Scores app to log a complaint Android: https://play.google.com > store > apps > sebiscores iOS: https://apps.apple.com > app > sebiscores
Disclaimer
Investment in the securities market are subject to market risks, read all the related documents carefully before investing. Brokerage will not exceed the SEBI prescribed limit.
Mutual fund investments are subject to market risks, read all scheme related documents carefully before investing. Mutual Funds are not exchange-traded products.
Attention Investor:
- Stock Brokers can accept securities as margin from clients only by way of pledge in the depository system w.e.f. September 1, 2020.
- Update your mobile number & email Id with your stock broker/depository participant and receive OTP directly from depository on your email id and/or mobile number to create pledge.
- Pay 20% as upfront margin of the transaction value to trade in cash market segment.
- Investors may please refer to the Exchange’s Frequently Asked Questions (FAQs) issued vide circular reference NSE/INSP/45191 dated July 31, 2020 and NSE/INSP/45534 dated August 31, 2020 and other guidelines issued from time to time in this regard.
- Check your Securities /MF/ Bonds in the consolidated account statement issued by NSDL/CDSL every month.