
Table of Content
Link copied!
Keltner Channels
Keltner Channels are a volatility-based technical indicator consisting of three lines, a central exponential moving average (EMA) and two outer bands set above and below the EMA by a multiple of the average true range (ATR).
Key Takeaways:
- Core Structure and Functionality: Keltner Channels use an EMA with ATR-based outer bands that expand or contract with market volatility.
- Trading Strategies: Traders enter on EMA pullbacks in trend direction and often exit near the opposite band.
- Comparison with Bollinger Bands: Keltner Channels offer smoother trend signals, while Bollinger Bands highlight reversals through price volatility.
- Triple Indicator Advantage: Using Keltner Channels with RSI and Bollinger Bands confirms signals and reduces false breakouts.
What are Keltner Channels?
Keltner Channels is a technical indicator that helps traders evaluate the market’s volatility or emerging trends while pinpointing breakout opportunities. The Indicator was first developed in the 60s by a grain trader, Chester W. Keltner and consists of a moving average in the centre with two outer bands that change position according to volatility.
Keltner Channels sprout Indicators that outline price movements in relation to volatility. They help traders make better decisions to either ride the trend or time an entry during consolidation.
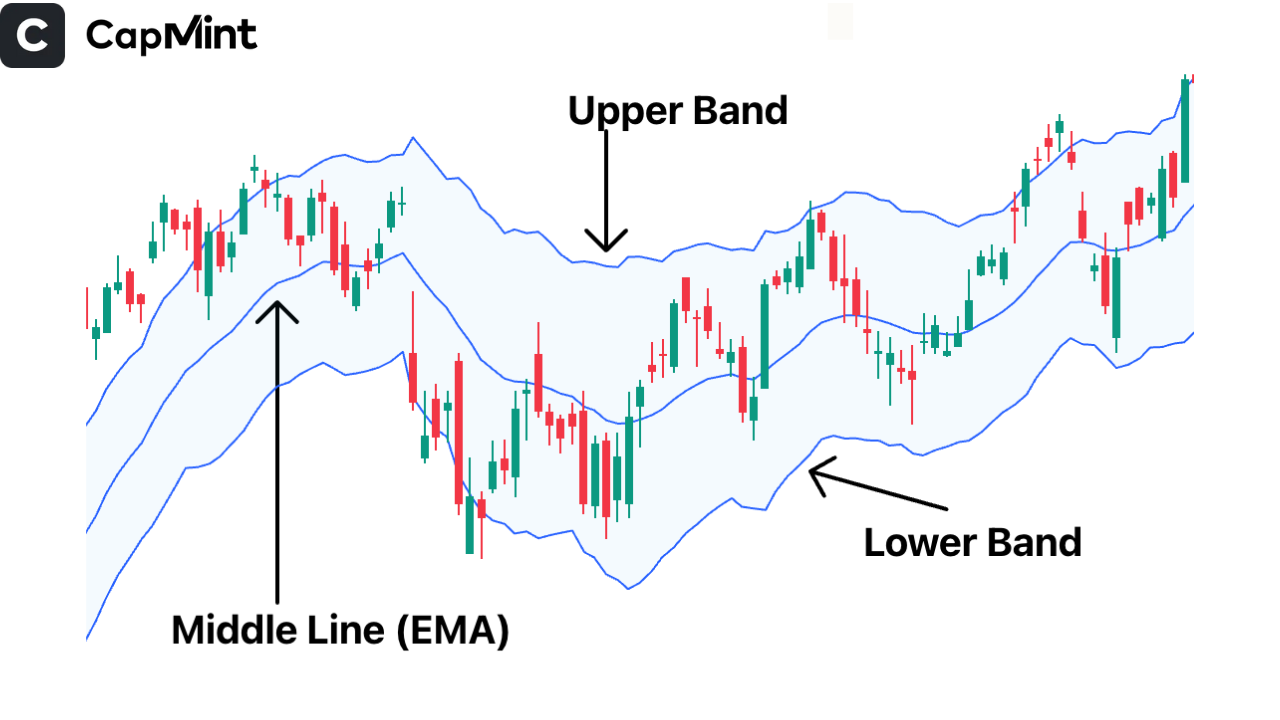
Keltner Channels consist of three lines that form a visual price envelope:
Middle Line (EMA)
This is usually a 20-period Exponential Moving Average (EMA). It acts as the core of the channel, showing the general trend direction by smoothing recent price data.
Upper Band
This is calculated by taking the EMA and adding the Average True Range (ATR), multiplied by a factor (commonly 2).
The formula is: Upper Band = EMA + (Multiplier × ATR).
Lower Band
This is calculated by subtracting the same ATR multiplier from the EMA
The formula is: Lower Band = EMA – (Multiplier × ATR).
What does EMA mean in simple terms?
Think of the EMA as the average path the price is following, like a smoothed roadmap of price direction. The ATR tells us how much the price typically moves, meaning how volatile the market is. When the price becomes more volatile, the bands move apart to accommodate that increased movement. In contrast, during quiet periods, the bands narrow.
These dynamic bands act like a flexible price boundary. When the price moves outside the bands, it can indicate strength in the trend or a potential reversal if the move is unsustainable.
By now, it must be very clear about the components of Keltner Channels. Let’s take a look at each one of them for clarity.
Components of Keltner Channels
Keltner Channels are made up of three key elements that help traders identify trends and volatility in a structured way.
Exponential Moving Average (EMA)
This line is a “trend tracker.” It takes recent price data and smooths it out so you can easily tell whether the market is moving up or down.
Average True Range (ATR)
This tells you how volatile a stock or index is. It doesn’t tell you the direction of the market, but it does show how much the price tends to move, whether the market is energetic or quiet.
Multiplier (usually 2)
This number determines how far the bands are from the EMA. A bigger multiplier creates wider bands, allowing for bigger price swings to stay within range. The multiplier can be increased or decreased in the settings depending on your trading style.
Together, these three parts work to create a smart, flexible price range. It’s like a visual framework that helps traders recognise when prices are behaving unusually, either breaking out or about to reverse.
How to use Keltner Channels?
Once you understand how the bands react to price and volatility, you can start using them to identify trading opportunities.
For example, when the price consistently stays near or above the upper band it could be the start of a strong uptrend signalling a potential buy opportunity, especially if confirmed by volume or a momentum indicator like RSI.
On the flip side, if price hovers around the lower band, it might indicate a downtrend or potential short setup. Traders also use the middle EMA line as a dynamic support or resistance level, entering trades when the price bounces off this line in the direction of the trend
Here are three tips on when to enter and when to take an exit:
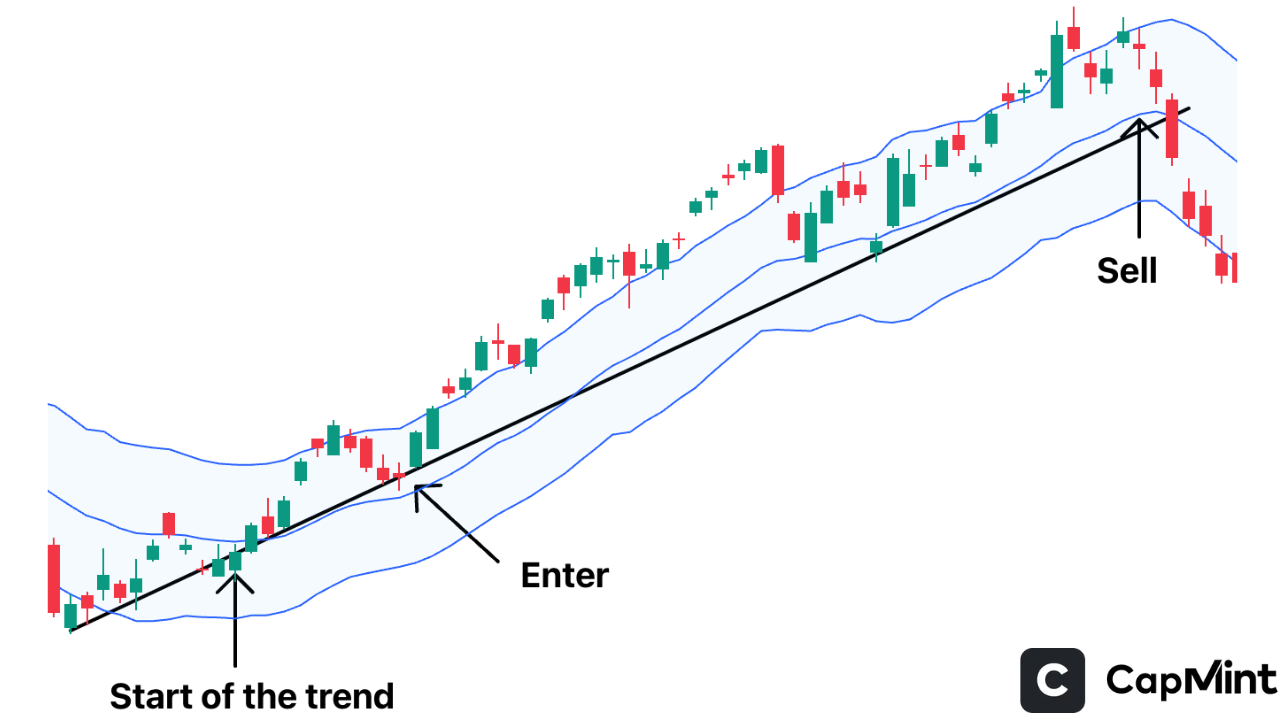
Entry on Pullback to EMA in Trend
If the price is trending upward and pulls back to the middle EMA line without breaking below it, this can act as a support level, presenting a good entry point for a long trade.
Exit at Opposite Band
If you’re riding a trend and enter near the EMA, a conservative strategy is to exit the trade when the price approaches the opposite band. This helps capture a move while minimising the risk of reversal.
Use RSI for Confirmation
Pair your entries and exits with RSI signals. For example, enter a trade only when the RSI confirms strength (above 50 for longs) and consider exiting when the RSI becomes overbought or shows signs of divergence.
History of the Keltner Channel
The Keltner Channel was introduced by American grain trader Chester W. Keltner in his 1960 book How to Make Money in Commodities. His original version used a 10-day moving average of the typical price (average of high, low, and close) as the centre line.
The upper and lower bands were calculated using the simple moving average of the past 10 days’ trading range. A close above the upper band was seen as a bullish signal, while a close below the lower band indicated bearishness.
Later, trader Linda Bradford Raschke refined the indicator by introducing the exponential moving average (EMA) and Average True Range (ATR) for the bands. This modern version is widely used today, although some variation in definitions still exists.
Keltner Channels vs. Bollinger Bands
While both indicators use bands around a central average, there are key differences that impact how traders use them in real scenarios:
Keltner Channels
Calculate their upper and lower bands using the Average True Range (ATR), which smooths out sudden price spikes and results in cleaner, steadier bands. This makes them ideal for identifying and riding trends.
Bollinger Bands
On the other hand, rely on the standard deviation, which responds more dramatically to price changes. This makes them better suited for spotting short-term overbought or oversold conditions and potential price reversals.
Because of this contrast, many traders combine both tools in their strategy. You can use Keltner Channels to ride the trend and then bring in Bollinger Bands to identify exit points. For example, suppose price begins to push outside the upper Keltner Channel, indicating strength, but also hits the upper Bollinger Band, and RSI entersoverbought territory. In that case, it might be a sign that the trend is losing momentum, giving you a smart place to consider taking profits. This dual-band strategy helps traders make more informed decisions about not just when to enter, but also when to exit with confidence.
Advantages of the Triple Indicator Approach
Using Keltner Channels, along with other indicators like RSI (Relative Strength Index) and Bollinger Bands, can greatly improve your ability to make confident and well-timed trades. Here’s how this powerful combination works in your favour:
Filters out Market Noise
When markets are choppy, it’s easy to get misled by random price spikes. The triple indicator approach helps smooth out these distractions by aligning signals across trend, momentum, and volatility.
Confirms Signals with Multiple Indicators
Instead of relying on a single tool, you cross-check trade ideas. For example, if price breaks above the Keltner Channel and RSI is also above 50, this double confirmation boosts your confidence in entering the trade.
Adapts well to different Timeframes
Whether you’re trading 5-minute charts or daily candles, the flexibility of these indicators makes them effective across styles, from quick scalps to multi-day holds.
Reduces false Breakouts and Whipsaws
False signals are a common risk in trading. But when multiple indicators agree, the chances of being faked out are lower, making your entries and exits more accurate.
Conclusion
Keltner Channels provide traders with a clear visual framework for interpreting price action in relation to volatility and trend direction. When used alone or in combination with other tools like RSI and Bollinger Bands, they offer powerful insights for more precise entries, exits, and trend confirmation. This makes them a valuable asset in both trending and consolidating markets, adaptable to various trading styles and timeframes.
Frequently Asked Questions (FAQs)
How are Keltner Channels different from Bollinger Bands?
Keltner Channels use ATR to calculate band width, making them smoother and better for trend following, while Bollinger Bands use standard deviation, making them more reactive to price volatility.
What does it mean when the price breaks above or below a Keltner Channel?
A breakout above the upper band may signal strong bullish momentum, while a drop below the lower band could indicate a bearish trend or potential reversal.
Can Keltner Channels be used for all types of trading?
Yes, they are versatile and can be used on various timeframes, making them suitable for day trading, swing trading, and even long-term investing.
What is the best indicator to use with the Keltner Channel?
The Keltner Channel works best with momentum indicators like RSI or MACD. These help confirm overbought or oversold conditions and strengthen breakout signals, improving trade accuracy when used alongside price action.
Are Keltner Channels profitable?
Keltner Channels can be profitable when used with proper confirmation and risk management. They help identify trends and breakouts, but relying on them alone may lead to false signals. Combining them with other indicators improves consistency.
Disclaimer: This content is for educational purposes only and does not constitute financial or investment advice. Investments in securities or other financial instruments are subject to market risk, including partial or total loss of capital. Past performance is not indicative of future results. Always consider your financial situation carefully and consult a licensed financial advisor before making investment or trading decisions.
Table of Content
Engineered for the obsessed. Built for traders.

Purpose-built terminals.
Zero compromise.
Built for speed.
Plot No 1290, 2nd Floor, 17th Cross, 5th Main, Sector-7, HSR Layout, Bangalore 560102
Follow us on
Mintcap Brokers Private Limited
CIN – U66110KA2023PTC178706 | Registered Address: Plot No 1290, Second Floor, 17th Cross, 5th Main, Sector-7, HSR Layout, Bangalore 560102 | Tel: 080 – 49552310 | Email ID: compliance@capmint.com | SEBI registered Stock Broker: INZ000322732 | NSE Cash/F&O Member ID: 90430 | BSE Cash/F&O Member ID: 6903 | MCX Member ID: 57400 | NCDEX Member ID: 1312 | SEBI registered Depository Participant: IN-DP-806-2025 | CDSL DP ID: 12102300 | NSE Clearing Member code: M70108 | AMFI-Registered Mutual Fund Distributor: ARN-289109 (Valid upto 28-Feb-2027) | Category II Execution Only Platform : E6903
Details of Client Bank Account
Compliance Officer: Ms. Shridevi Vungarala | Email ID: compliance@capmint.com | Tel no. + 91 9035330126 | Grievance Redressal Officer (GRO) – Ms. Shikha Gupta | Email ID: Grievance@capmint.com | Tel no: 9035331595.
Procedure to file a complaint on SEBI SCORES: Register on SCORES portal. Mandatory details for filing complaints on SCORES: Name, PAN, Address, Mobile Number, E-mail ID. Benefits: Effective Communication, Speedy redressal of the grievances. You may refer the website https://scores.sebi.gov.in/ for more information. You may also download the SEBI Scores app to log a complaint Android: https://play.google.com > store > apps > sebiscores iOS: https://apps.apple.com > app > sebiscores
Disclaimer
Investment in the securities market are subject to market risks, read all the related documents carefully before investing. Brokerage will not exceed the SEBI prescribed limit.
Mutual fund investments are subject to market risks, read all scheme related documents carefully before investing. Mutual Funds are not exchange-traded products.
Attention Investor:
- Stock Brokers can accept securities as margin from clients only by way of pledge in the depository system w.e.f. September 1, 2020.
- Update your mobile number & email Id with your stock broker/depository participant and receive OTP directly from depository on your email id and/or mobile number to create pledge.
- Pay 20% as upfront margin of the transaction value to trade in cash market segment.
- Investors may please refer to the Exchange’s Frequently Asked Questions (FAQs) issued vide circular reference NSE/INSP/45191 dated July 31, 2020 and NSE/INSP/45534 dated August 31, 2020 and other guidelines issued from time to time in this regard.
- Check your Securities /MF/ Bonds in the consolidated account statement issued by NSDL/CDSL every month.