
Link copied!
Volume Indicators
Volume indicators are technical analysis tools that help traders understand how much a stock or asset is being traded over a certain period. Volume indicators show the strength or weakness of a price move based on trading activity.
Key Takeaways
- Volume indicators help you understand how much a stock is being traded. They show whether a price move is strong or weak based on the trading activity behind it.
- Volume helps confirm if a trend is real, spot possible reversals, and sometimes even gives early warning signs before a big price move.
- Tools like OBV, VMA, and VWAP make it easier to read volume patterns and decide whether buyers or sellers are in control.
- Using volume along with tools like moving averages, RSI, or MACD gives more reliable trading signals and helps avoid false breakouts.
The Role of Volume in Technical Analysis
Volume is one of the most important key indicators in trading and tells you how strong the current volume is. Here is their role:
Confirmation of Trends
When the price of a stock rises along with high trading volume, it signals strong buying interest and confirms a bullish trend. Similarly, if the price falls with high volume, it indicates heavy selling and confirms a bearish trend. On the other hand, if price movements happen on low volume, they may not be reliable or sustainable. In simple terms, volume acts as a supporting signal that helps validate whether a trend is strong or weak.
Identifying Reversals
Reversals can often be spotted by looking at the relationship between price and volume. If prices are going up but the trading volume is falling, it could mean that buying interest is fading, a potential sign of an upcoming trend reversal. This kind of mismatch is called a divergence and usually signals that the current trend is losing strength. Paying attention to such divergences can help traders exit early or prepare for a possible change in direction.
Volume Precedes Price
In many cases, a sudden increase in volume happens before a major price move. This means traders start taking positions quietly before the price reacts. A sharp rise in volume without much price change can be an early clue that something big is about to happen. Smart traders watch volume closely to catch these early signals before the crowd joins in.
Key Volume Indicators
Here are the key volume indicators that stock market participants use:
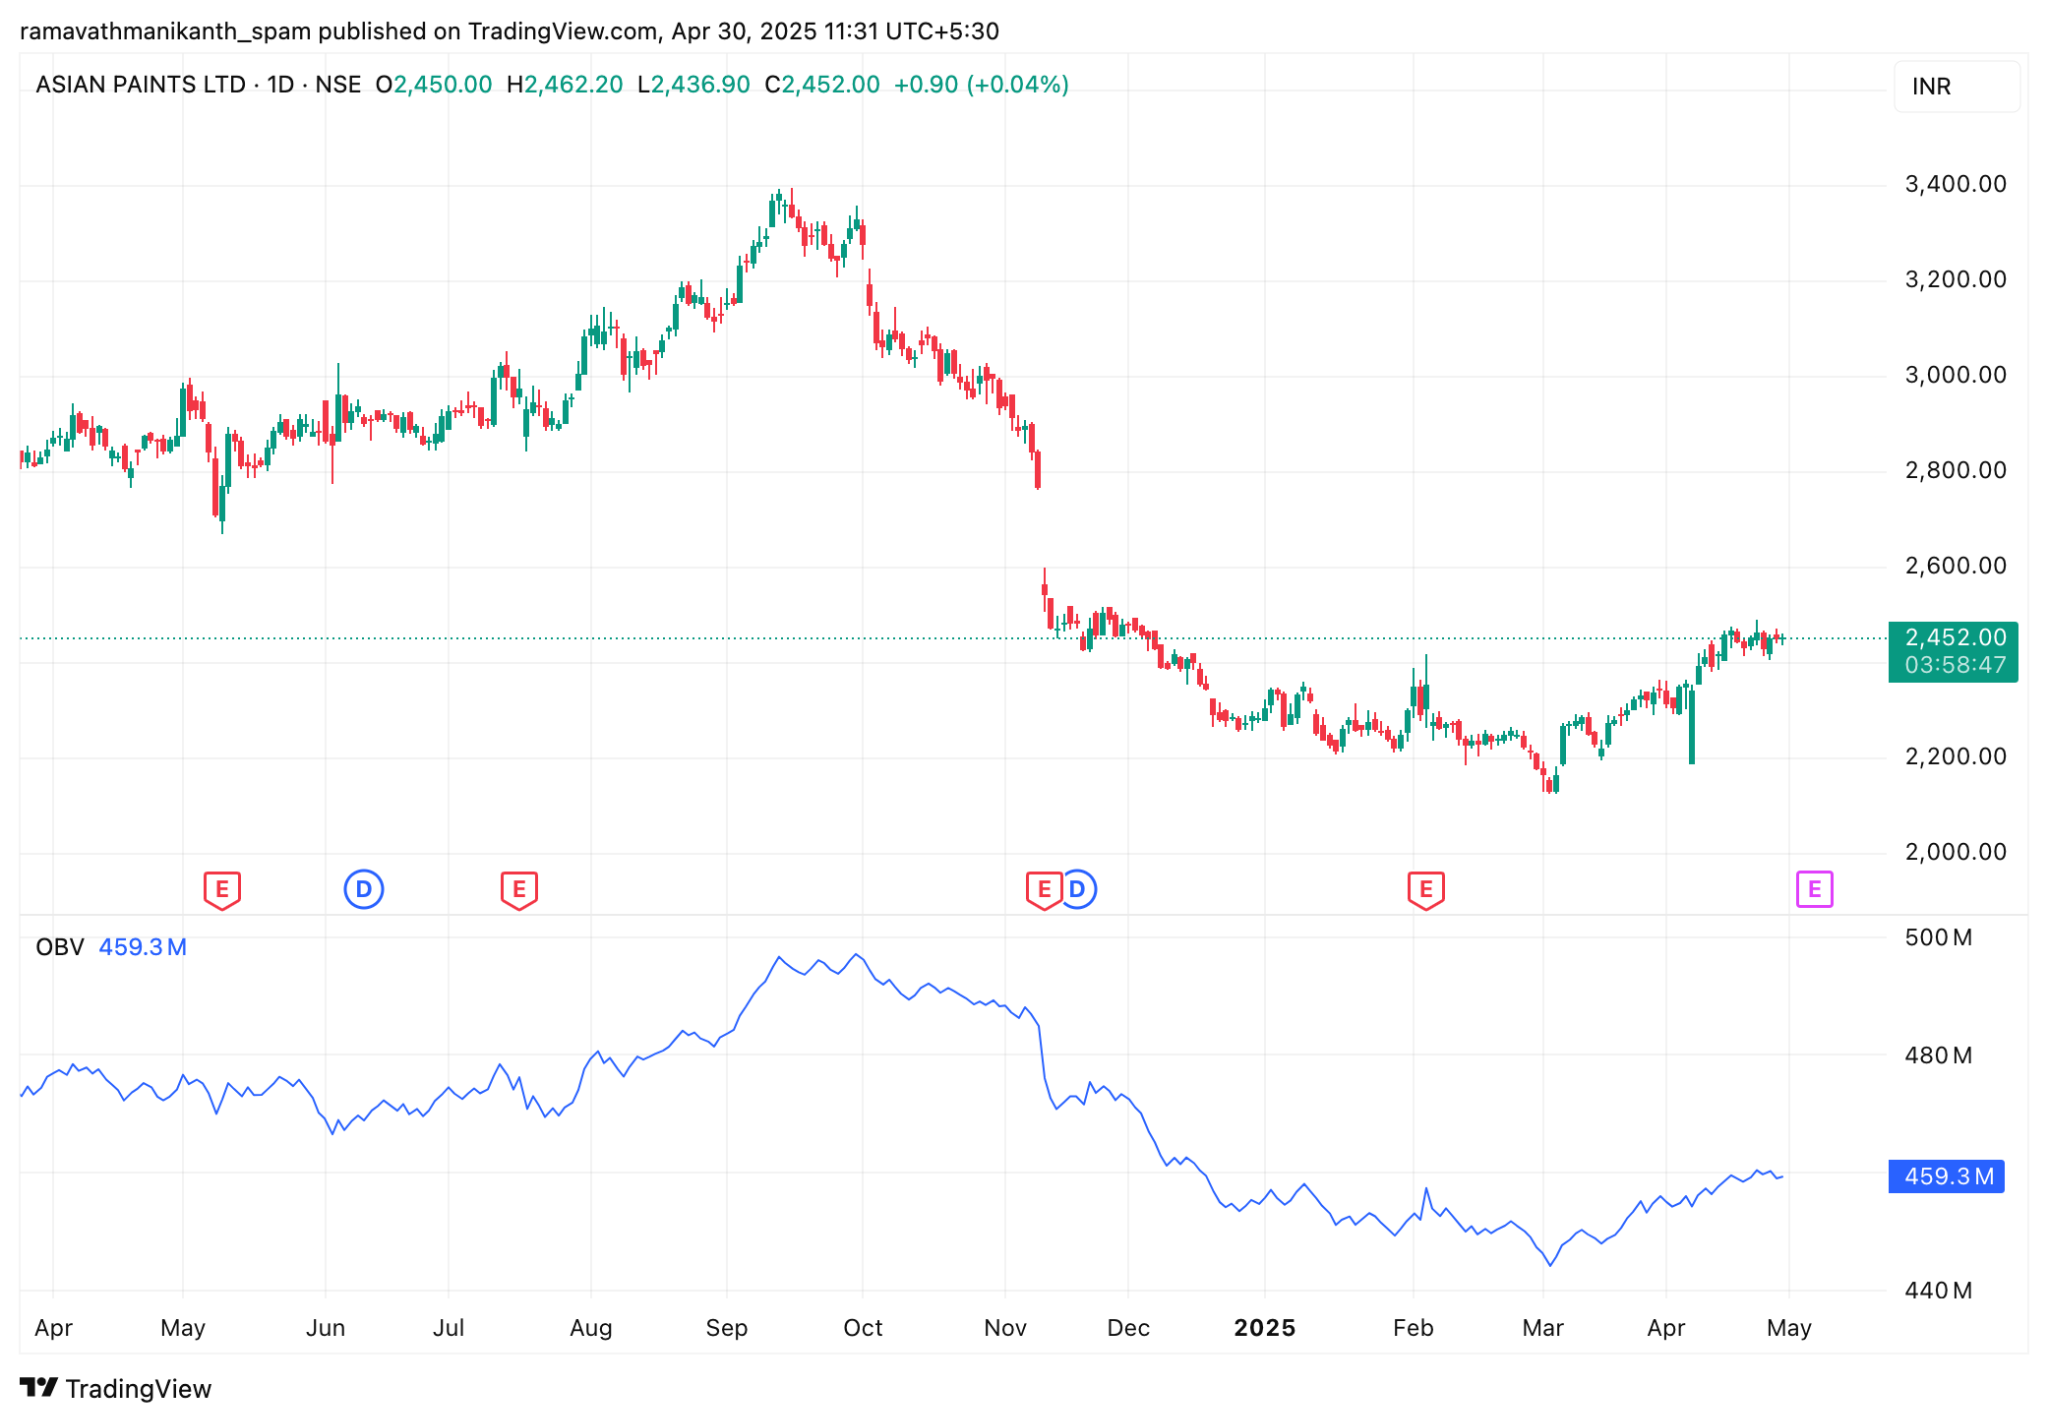
On-Balance Volume (OBV)
OBV is a technical indicator that helps measure buying and selling pressure. It works by adding the day’s volume to a total when the price goes up and subtracting the volume when the price goes down. Over time, this helps show whether more people are buying or selling. A rising OBV suggests strong buying interest, while a falling OBV shows selling pressure.
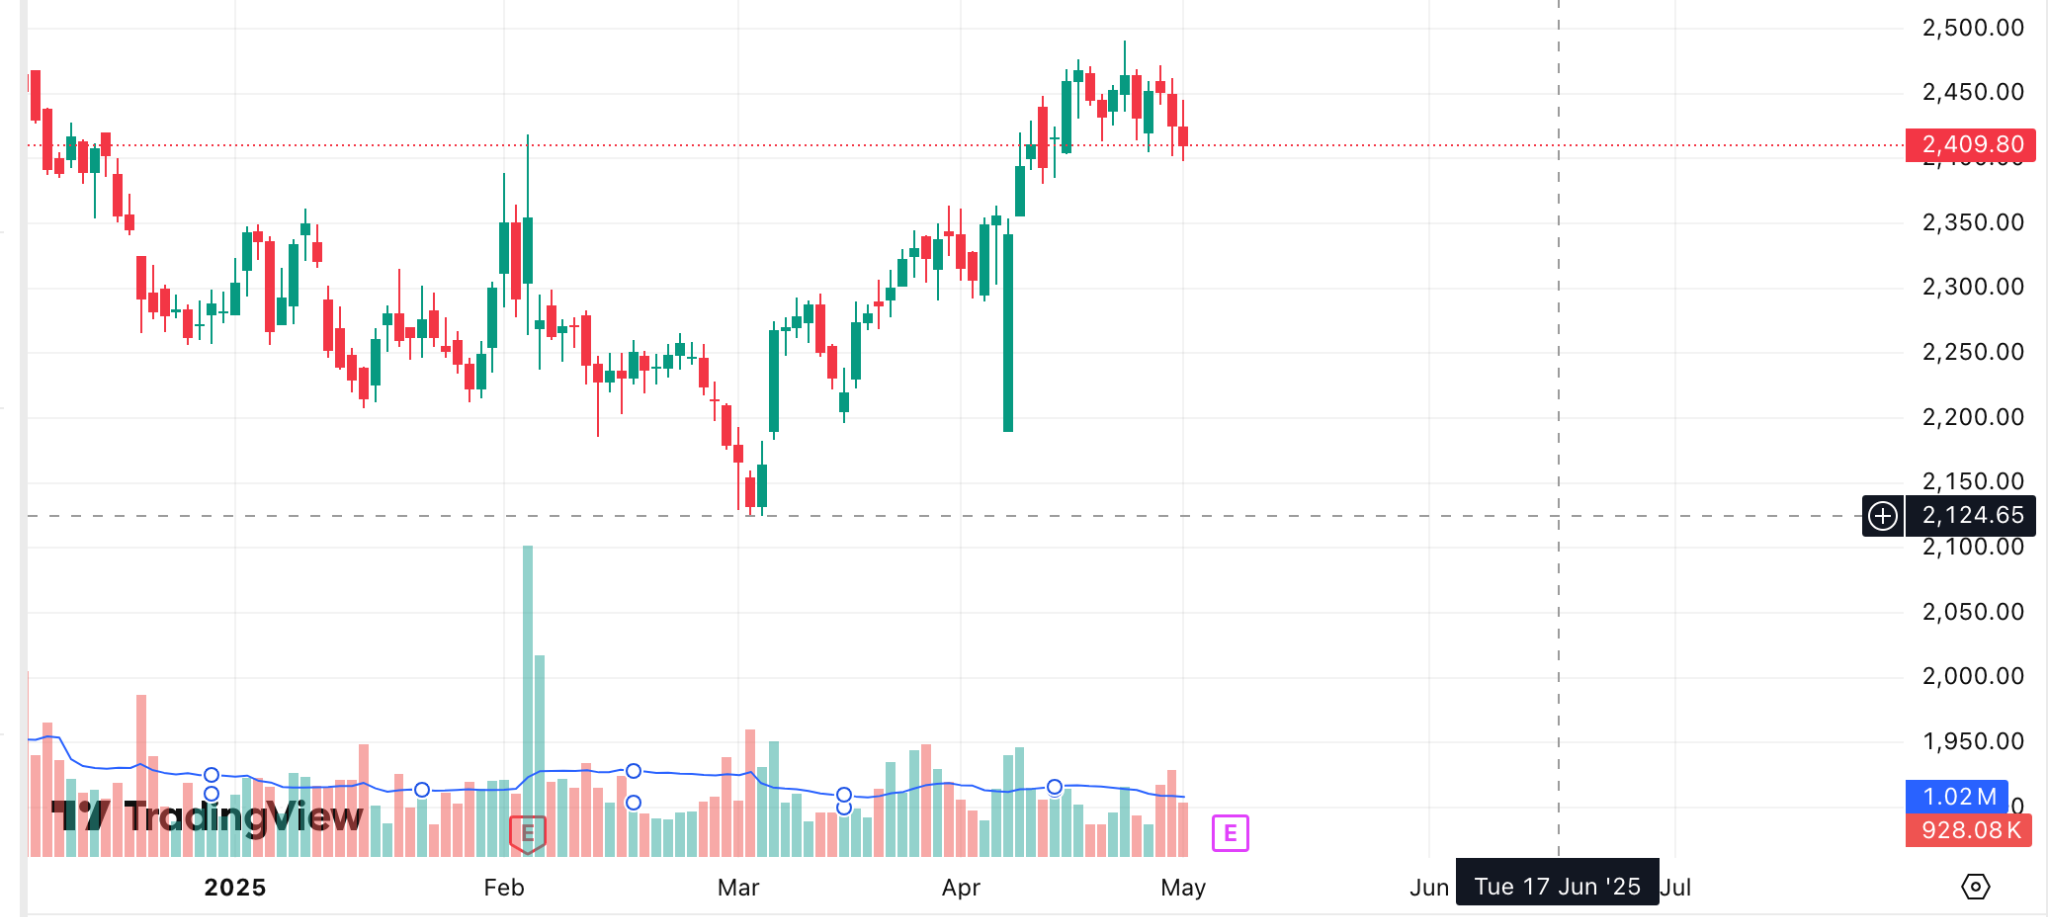
Volume Moving Average (VMA)
The Volume Moving Average (VMA) shows the average trading volume over a set period, like 10 or 20 days. It helps smooth out daily fluctuations and gives a clearer picture of normal volume levels. When the current volume is much higher than the VMA, it can signal unusual activity or growing interest. Traders use it to spot breakouts, trend changes, or sudden spikes in participation.
Since you have understood VMA, you can also check out Simple Moving Average (SMA) and Exponential Moving Average (EMA).
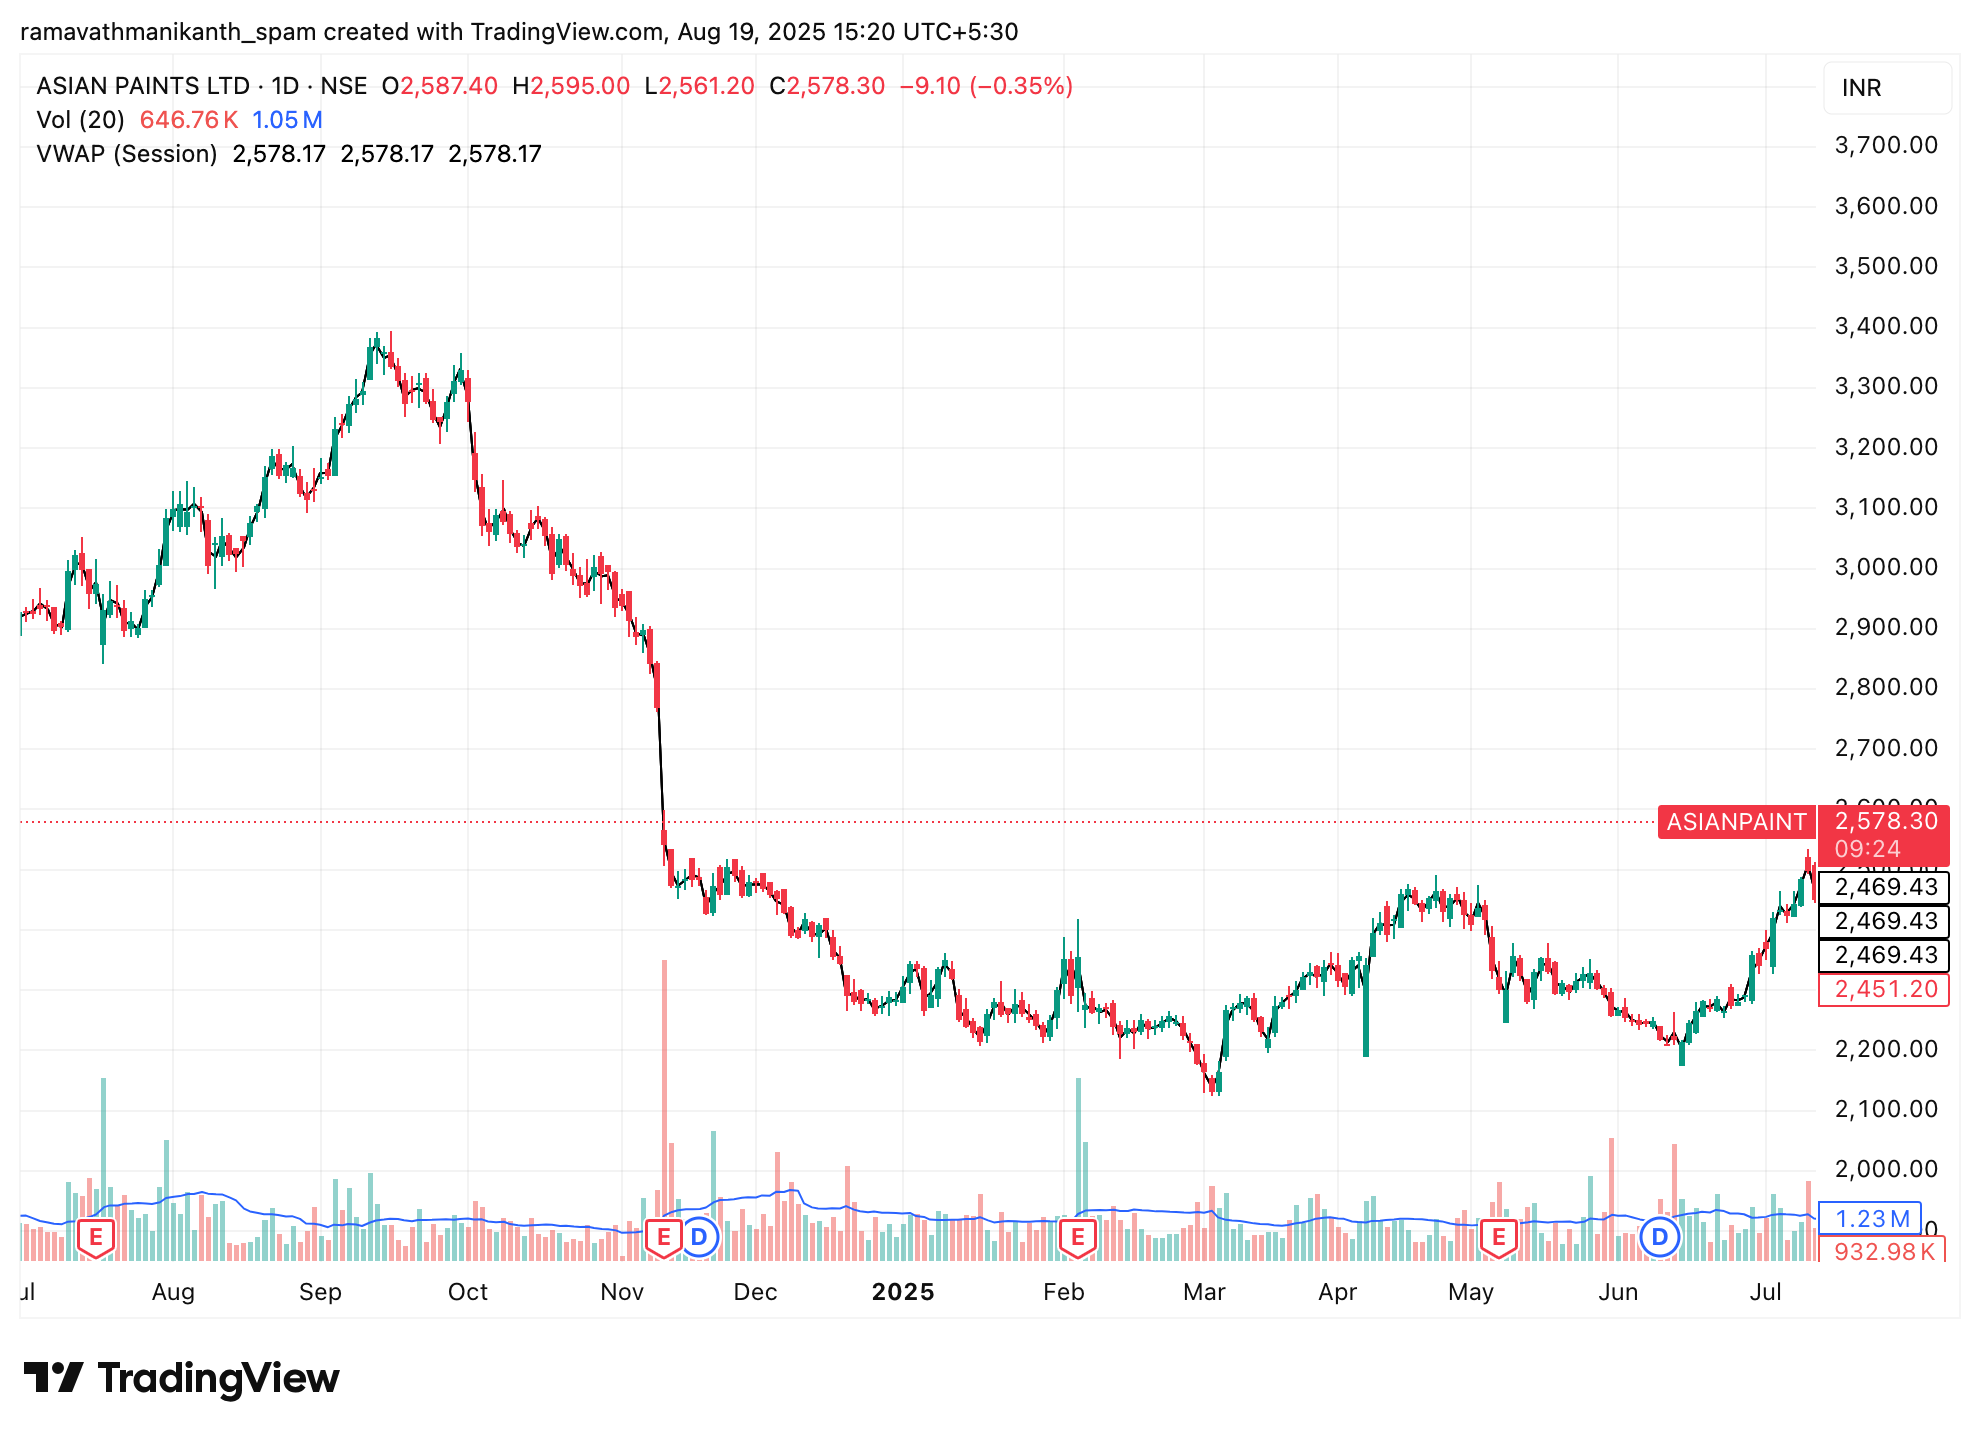
Volume Weighted Average Price (VWAP)
Volume Weighted Average Price (VWAP) shows the average price a stock has traded at throughout the day, but it gives more weight to trades with higher volume. This makes it more accurate than a simple average, as it reflects where most trading activity happened. Traders use VWAP to judge whether they bought or sold at a good price compared to the day’s average. It’s also a popular tool for tracking the market’s intraday trend and momentum.
Integrating Volume with Other Technical Tools
Volume becomes even more powerful when combined with other indicators like moving averages, the Relative Strength Index, or trendlines. It helps confirm signals and adds more confidence to your trades, rather than relying on price alone.
Using Moving Averages with Volume in Trading
When a stock crosses a moving average on high volume, it signals a stronger and more reliable trend. Rising moving averages with increasing volume suggest solid momentum, while low volume during crossovers may indicate weak or false breakouts. Volume also helps confirm whether a moving average is acting as real support or resistance. Together, they give clearer signals and help traders avoid fakeouts.
RSI + Volume: Confirming Momentum Shifts
RSI shows if a stock is overbought or oversold, but volume adds an extra layer of confirmation.
If RSI shows oversold and volume spikes up, it could signal a strong reversal ahead. Similarly, overbought conditions with rising volume might confirm continued bullish strength. Together, RSI and volume help validate if the price move is real or just temporary noise.
MACD + Volume: Strengthening the Signal
MACD crossovers and divergences become more reliable when supported by volume. If a bullish MACD crossover happens with rising volume, it signals strong buying interest and a possible trend shift. On the flip side, a bearish crossover with high volume confirms selling pressure. Volume helps validate whether the MACD signal has real momentum behind it.
Conclusion
Volume is a critical piece of the puzzle in technical analysis. It not only shows how actively a stock is being traded but also adds depth to price signals by confirming strength, spotting reversals, and even hinting at future moves. Indicators like OBV, VMA, and VWAP provide structured ways to interpret volume, while combining volume with tools like moving averages, RSI, and MACD helps filter out false signals and improve trading accuracy.
In essence, volume acts as the “voice” behind price action, telling you whether a move is real or just noise. For any trader looking to make informed decisions, understanding and applying volume indicators can be a game-changer.
Frequently Asked Questions (FAQs)
What is the Best Indicator for Volume?
There’s no single “best,” but On-Balance Volume (OBV), Volume Moving Average (VMA), and VWAP are commonly used. They help confirm trends, spot reversals, and highlight unusual activity. The best one depends on your trading style.
What are volume indicators?
A volume indicator shows how many shares or contracts are traded in a given time. It helps traders understand the strength behind price movements. High volume means strong interest; low volume means weak interest.
Which Volume Profile indicator is Best?
The Volume Profile Visible Range (VPVR) is one of the most popular. It shows how much trading happened at different price levels, helping traders identify support, resistance, and high-interest zones.
Disclaimer: This content is for educational purposes only and does not constitute financial or investment advice. Investments in securities or other financial instruments are subject to market risk, including partial or total loss of capital. Past performance is not indicative of future results. Always consider your financial situation carefully and consult a licensed financial advisor before making investment or trading decisions.
Engineered for the obsessed. Built for traders.

Purpose-built terminals.
Zero compromise.
Built for speed.
Plot No 1290, 2nd Floor, 17th Cross, 5th Main, Sector-7, HSR Layout, Bangalore 560102
Follow us on
Mintcap Brokers Private Limited
CIN – U66110KA2023PTC178706 | Registered Address: Plot No 1290, Second Floor, 17th Cross, 5th Main, Sector-7, HSR Layout, Bangalore 560102 | Tel: 080 – 49552310 | Email ID: compliance@capmint.com | SEBI registered Stock Broker: INZ000322732 | NSE Cash/F&O Member ID: 90430 | BSE Cash/F&O Member ID: 6903 | MCX Member ID: 57400 | NCDEX Member ID: 1312 | SEBI registered Depository Participant: IN-DP-806-2025 | CDSL DP ID: 12102300 | NSE Clearing Member code: M70108 | AMFI-Registered Mutual Fund Distributor: ARN-289109 (Valid upto 28-Feb-2027) | Category II Execution Only Platform : E6903
Details of Client Bank Account
Compliance Officer: Ms. Shridevi Vungarala | Email ID: compliance@capmint.com | Tel no. + 91 9035330126 | Grievance Redressal Officer (GRO) – Ms. Shikha Gupta | Email ID: Grievance@capmint.com | Tel no: 9035331595.
Procedure to file a complaint on SEBI SCORES: Register on SCORES portal. Mandatory details for filing complaints on SCORES: Name, PAN, Address, Mobile Number, E-mail ID. Benefits: Effective Communication, Speedy redressal of the grievances. You may refer the website https://scores.sebi.gov.in/ for more information. You may also download the SEBI Scores app to log a complaint Android: https://play.google.com > store > apps > sebiscores iOS: https://apps.apple.com > app > sebiscores
Disclaimer
Investment in the securities market are subject to market risks, read all the related documents carefully before investing. Brokerage will not exceed the SEBI prescribed limit.
Mutual fund investments are subject to market risks, read all scheme related documents carefully before investing. Mutual Funds are not exchange-traded products.
Attention Investor:
- Stock Brokers can accept securities as margin from clients only by way of pledge in the depository system w.e.f. September 1, 2020.
- Update your mobile number & email Id with your stock broker/depository participant and receive OTP directly from depository on your email id and/or mobile number to create pledge.
- Pay 20% as upfront margin of the transaction value to trade in cash market segment.
- Investors may please refer to the Exchange’s Frequently Asked Questions (FAQs) issued vide circular reference NSE/INSP/45191 dated July 31, 2020 and NSE/INSP/45534 dated August 31, 2020 and other guidelines issued from time to time in this regard.
- Check your Securities /MF/ Bonds in the consolidated account statement issued by NSDL/CDSL every month.