
Link copied!
Momentum Indicators
Momentum indicators are technical indicator tools that measure the speed or rate of change in stock prices. They help highlight their role in identifying the strength of price movements and potential trend reversals.
Key Takeaways
- Momentum indicators help track how fast a stock’s price is going up or down, which shows the strength of a trend.
- These indicators don’t tell you whether the price will rise or fall next—they only show how strong the current movement is.
- Commonly used momentum indicators are RSI, MACD, ADX, ROC, and Stochastic Oscillator, each measuring momentum in different ways.
- They can give wrong signals in sideways or volatile markets and don’t work the same on all timeframes, so it’s better to use them with other tools.
What Are Momentum Indicators?
Momentum indicators help identify trends and strengths. There are technical indicators like the relative strength index (RSI), moving averages, or MACD that analyse how quickly and significantly a stock’s price changes over a specific time frame. These tools measure the rate of change or momentum, in other words, how fast the price is climbing or falling, not just the fact that it is.
When using Momentum indicators, it’s vital to understand that these indicators reflect the strength or momentum of price movement, not necessarily the direction. So, while these tools help traders judge how forceful a move is, they don’t predict whether the price will go up or down next. That’s why they are often used with other tools like support/resistance or volume analysis.
Common Momentum Technical Indicators
Let’s look at some of the most commonly used momentum indicators, the ones traders rely on to judge how strong a trend really is.
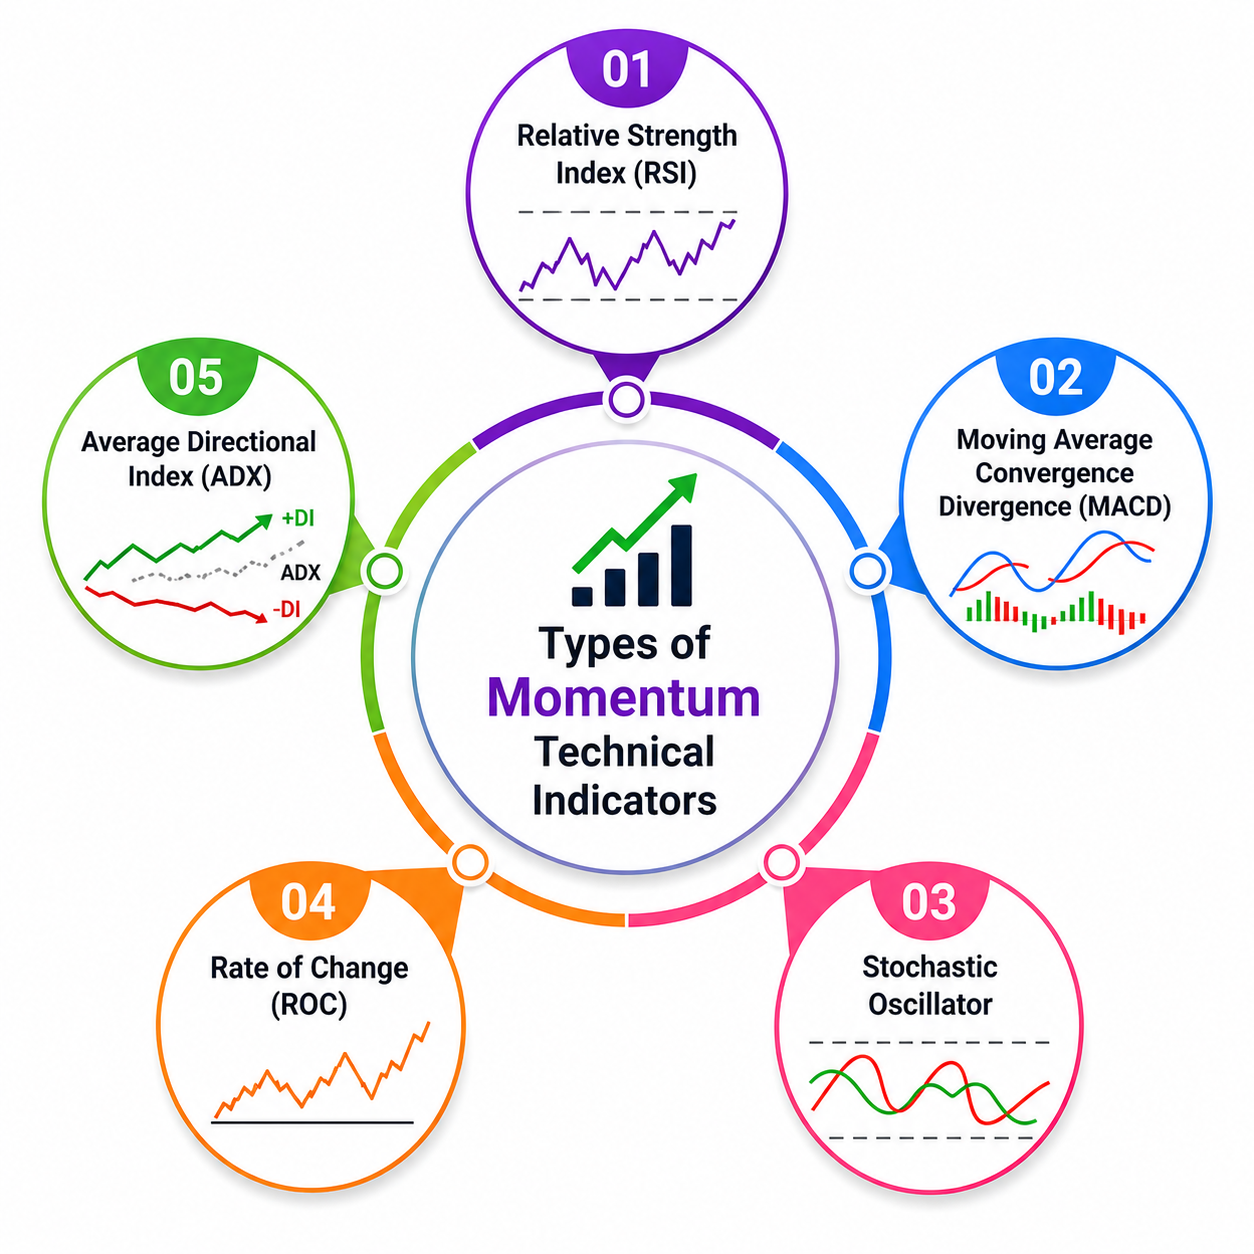
Relative Strength Index (RSI):
RSI measures how quickly prices have moved up or down over a set period (usually 14 days).
If the RSI goes above 70, the stock might be overbought (too expensive, too fast). If it drops below 30, it could be oversold (too cheap, too quickly). It helps traders spot potential reversals in momentum. Below is a pictorial representation of RSI.
Moving Average Convergence Divergence (MACD):
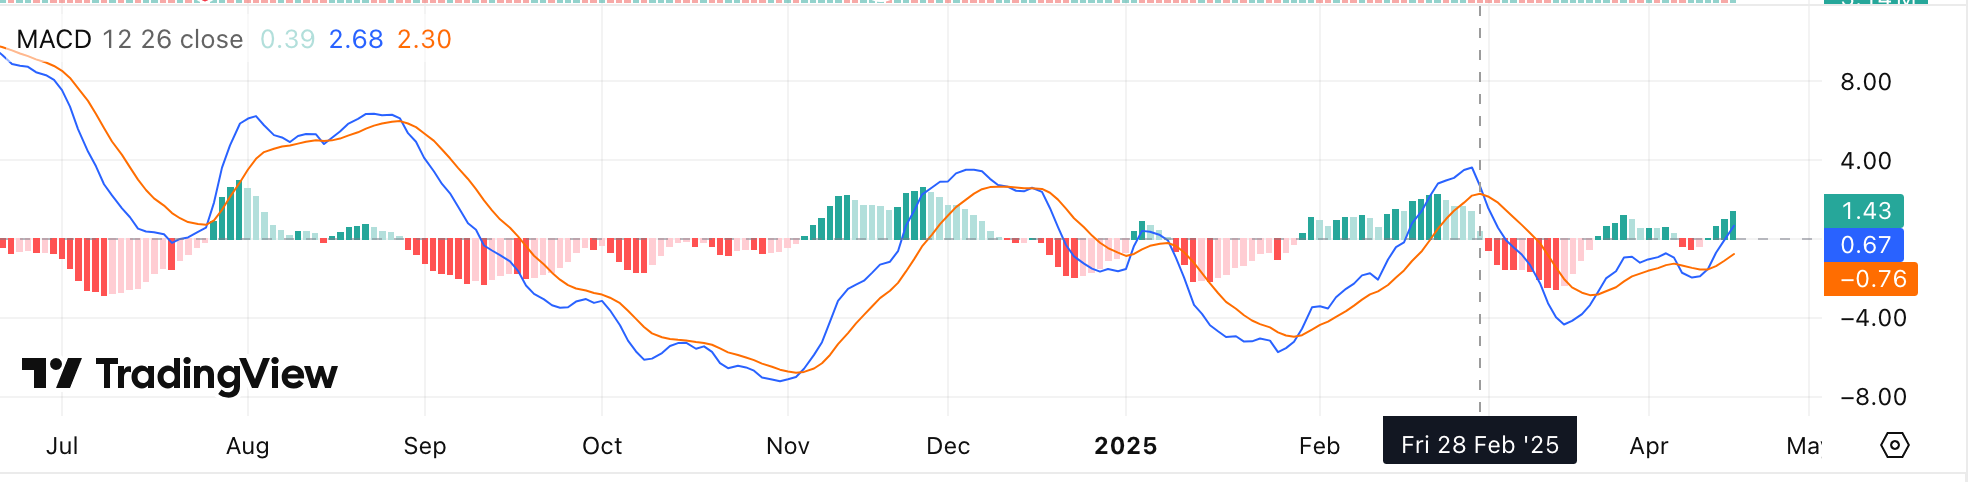
MACD tracks the difference between two exponential moving averages (12-day and 26-day). When the MACD line crosses above the signal line, it can be a buy signal—below it, a sell signal. It’s great for spotting trend changes and momentum shifts. Also shows when momentum is increasing or weakening. Image of MACD below
Average Directional Index (ADX):
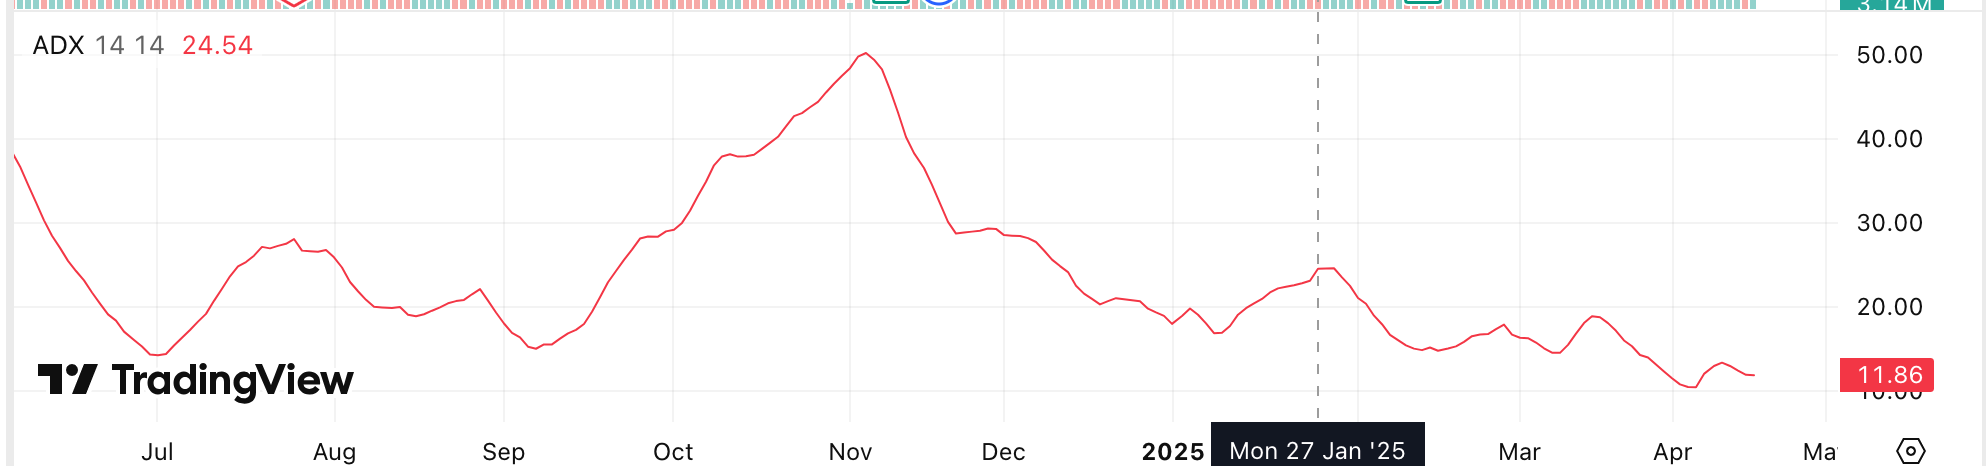
ADX doesn’t care about the direction, just how strong the trend is. It ranges from 0 to 100; above 25 usually signals a strong trend. The higher the ADX, the stronger the trend (whether it’s up or down). It’s best used alongside other indicators.
Rate of Change (ROC):
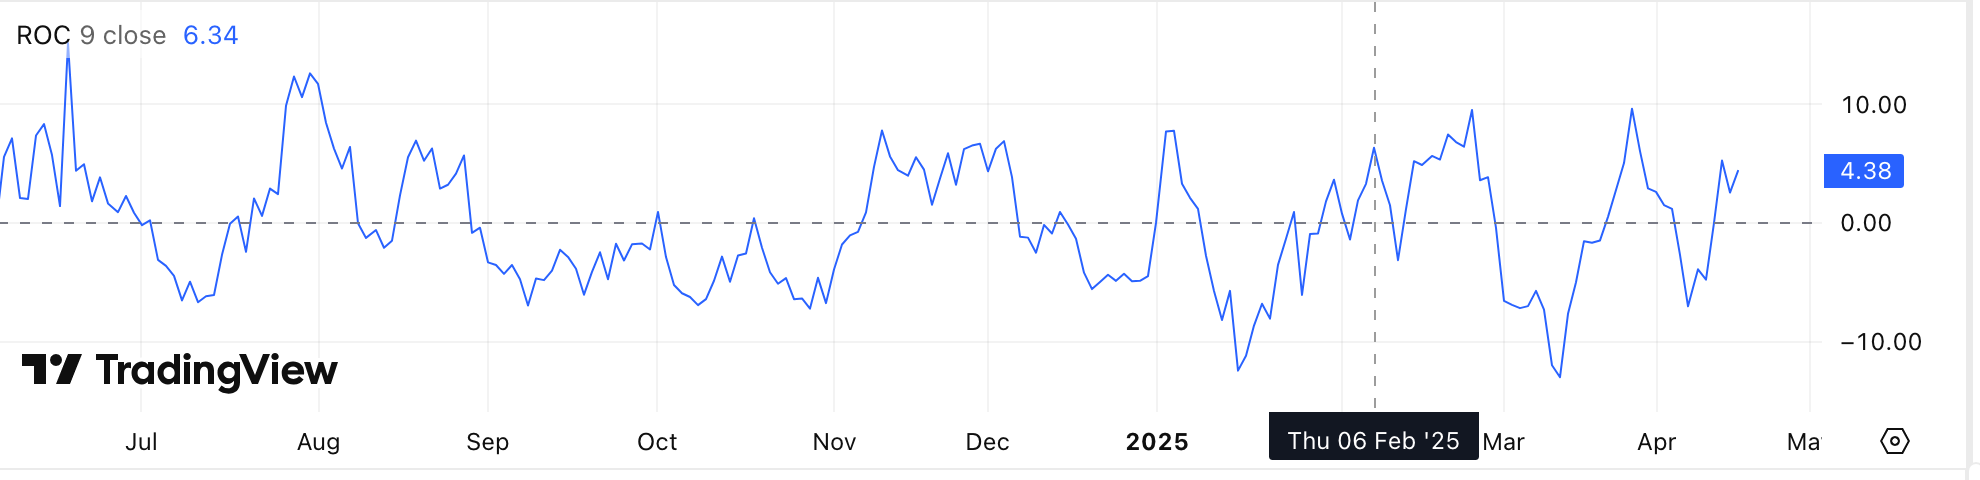
ROC shows how much a stock’s price has changed (in %) compared to a past value. A rising ROC indicates growing momentum, while a falling one shows slowing movement. It helps spot the speed of price moves and possible breakouts. Simple but powerful for spotting early trend signals.
Stochastic Oscillator:
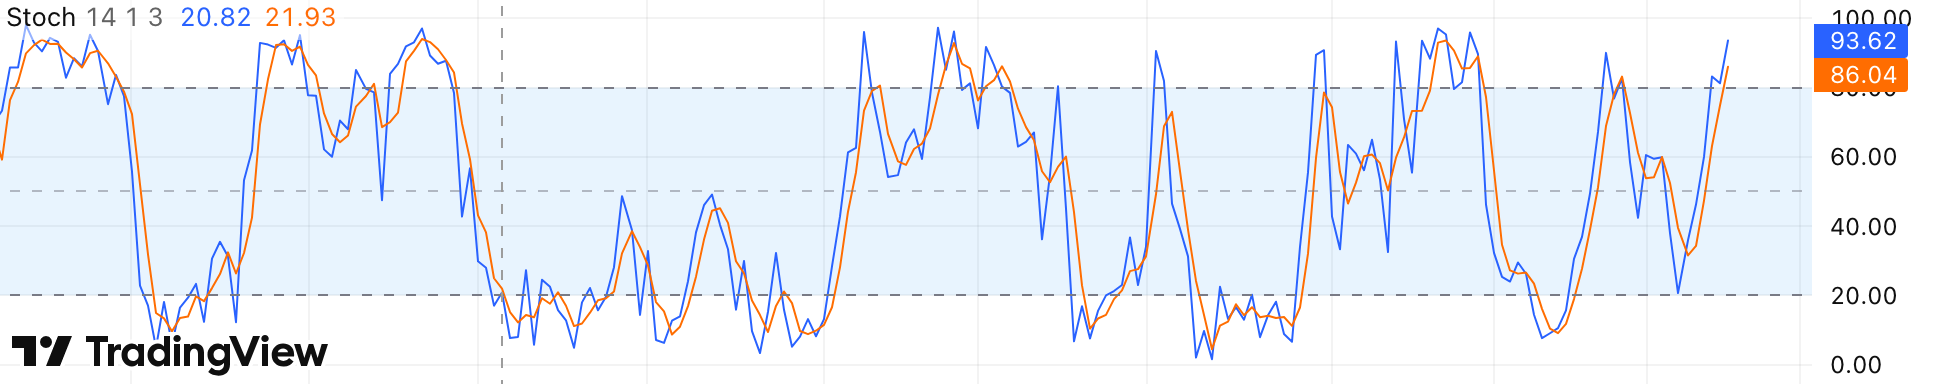
This compares a stock’s current closing price to its price range over a recent period (usually 14 days). Values above 80 suggest the stock might be overbought, and those below 20 mean oversold. It’s mainly used to identify possible reversal points. Especially effective in sideways or range-bound markets.
Calculating Momentum Basic Formula:
The basic crux of any momentum formula is to compare current price data with the previous one; here is how it can be
Momentum = (Current Closing Price / Closing Price n periods ago) × 100
This formula compares today’s price to a price from a set number of days ago (like 10 or 14 days). It helps traders see how fast the price is moving over that time frame.
Interpretation:
- If Momentum > 100:
Indicates upward momentum (price has increased compared to earlier). - If Momentum < 100:
Suggests downward momentum (price has decreased compared to earlier).
The higher it goes above 100, the stronger the upward push. If it keeps falling below 100, the trend might be weakening or turning bearish.
Divergence and Its Significance
Divergence happens when the stock price and a momentum indicator (like RSI or MACD) move in opposite directions. It often acts as an early warning of a potential trend reversal. There are two types of divergence.
Bullish Divergence
Here, the price of the stock or index is making a low, but the momentum indicator makes a higher low. Signals weakening downward momentum and a possible upward reversal. From here, the downtrend may be losing strength. Buyers could step in, and prices may start moving upward.
Bearish Divergence
Here, the price of the stock or index is making a higher high, but the momentum indicator forms a lower high. This indicates that buying momentum is fading, even though the price is still climbing. It suggests that bulls are running out of steam, and sellers might soon dominate, causing the price to decline. A reversal to the downside may follow shortly.
Limitations Of Momentum Indicators
Here are some limitations of the momentum Indicators:
False Signals in Volatile or Sideways Markets
In choppy or range-bound markets, momentum indicators may flash buy or sell signals that don’t play out. Price often lacks direction, making it hard to rely on momentum alone.
Should Not Be Used in Isolation
Relying only on momentum indicators can lead to misleading conclusions. They work best when combined with tools like support/resistance, volume analysis, or price action.
Effectiveness Varies by Market Conditions and Timeframes
An indicator that works well on a daily chart may not give the same signals on an hourly or weekly chart. Different assets and market phases also affect the reliability of the indicator.
Conclusion
Momentum indicators are useful tools that help traders understand how strong or weak a price movement is. They show how quickly prices are rising or falling, which can help in spotting potential trend changes early. However, it’s important to remember that these indicators don’t tell the exact direction in which the price will move next. They only highlight the strength behind the move.
That’s why traders should not depend only on momentum indicators to make decisions. They work best when used together with other tools like support/resistance levels or volume analysis. Also, these indicators may not work the same way in every market condition or in every timeframe. It’s essential to stay careful, especially in volatile markets where signals can be confusing. Overall, momentum indicators can be helpful for spotting opportunities and risks if used correctly and with proper confirmation from other market signals.
Frequently Asked Questions (FAQs)
Which indicator is best for momentum?
There’s no single “best” indicator, but the Relative Strength Index (RSI) and MACD are among the most popular for tracking momentum. They are widely used because they offer clear signals about the strength and potential shifts in price trends.
Which indicator is used for momentum?
Commonly used momentum indicators include RSI, MACD, Stochastic Oscillator, Rate of Change (ROC), and Average Directional Index (ADX). Each one helps measure how fast or strong the price movement is over a period.
How do momentum indicators help in trading?
Momentum indicators help traders identify the strength of a price trend and potential reversals. They show whether a stock is overbought or oversold, allowing traders to time their entry and exit more effectively.
What is the difference between momentum and trend indicators?
Momentum indicators measure the speed of price movement, while trend indicators show the direction of the market. Momentum can change before the trend reverses, making it useful for early signals.
Can momentum indicators be used alone?
Momentum indicators should not be used alone. They work best when combined with trend analysis, volume, and support-resistance levels to improve accuracy and reduce false signals.
Disclaimer: This content is for educational purposes only and does not constitute financial or investment advice. Investments in securities or other financial instruments are subject to market risk, including partial or total loss of capital. Past performance is not indicative of future results. Always consider your financial situation carefully and consult a licensed financial advisor before making investment or trading decisions.
Engineered for the obsessed. Built for traders.

Purpose-built terminals.
Zero compromise.
Built for speed.
Plot No 1290, 2nd Floor, 17th Cross, 5th Main, Sector-7, HSR Layout, Bangalore 560102
Follow us on
Mintcap Brokers Private Limited
CIN – U66110KA2023PTC178706 | Registered Address: Plot No 1290, Second Floor, 17th Cross, 5th Main, Sector-7, HSR Layout, Bangalore 560102 | Tel: 080 – 49552310 | Email ID: compliance@capmint.com | SEBI registered Stock Broker: INZ000322732 | NSE Cash/F&O Member ID: 90430 | BSE Cash/F&O Member ID: 6903 | MCX Member ID: 57400 | NCDEX Member ID: 1312 | SEBI registered Depository Participant: IN-DP-806-2025 | CDSL DP ID: 12102300 | NSE Clearing Member code: M70108 | AMFI-Registered Mutual Fund Distributor: ARN-289109 (Valid upto 28-Feb-2027) | Category II Execution Only Platform : E6903
Details of Client Bank Account
Compliance Officer: Ms. Shridevi Vungarala | Email ID: compliance@capmint.com | Tel no. + 91 9035330126 | Grievance Redressal Officer (GRO) – Ms. Shikha Gupta | Email ID: Grievance@capmint.com | Tel no: 9035331595.
Procedure to file a complaint on SEBI SCORES: Register on SCORES portal. Mandatory details for filing complaints on SCORES: Name, PAN, Address, Mobile Number, E-mail ID. Benefits: Effective Communication, Speedy redressal of the grievances. You may refer the website https://scores.sebi.gov.in/ for more information. You may also download the SEBI Scores app to log a complaint Android: https://play.google.com > store > apps > sebiscores iOS: https://apps.apple.com > app > sebiscores
Disclaimer
Investment in the securities market are subject to market risks, read all the related documents carefully before investing. Brokerage will not exceed the SEBI prescribed limit.
Mutual fund investments are subject to market risks, read all scheme related documents carefully before investing. Mutual Funds are not exchange-traded products.
Attention Investor:
- Stock Brokers can accept securities as margin from clients only by way of pledge in the depository system w.e.f. September 1, 2020.
- Update your mobile number & email Id with your stock broker/depository participant and receive OTP directly from depository on your email id and/or mobile number to create pledge.
- Pay 20% as upfront margin of the transaction value to trade in cash market segment.
- Investors may please refer to the Exchange’s Frequently Asked Questions (FAQs) issued vide circular reference NSE/INSP/45191 dated July 31, 2020 and NSE/INSP/45534 dated August 31, 2020 and other guidelines issued from time to time in this regard.
- Check your Securities /MF/ Bonds in the consolidated account statement issued by NSDL/CDSL every month.