
Link copied!
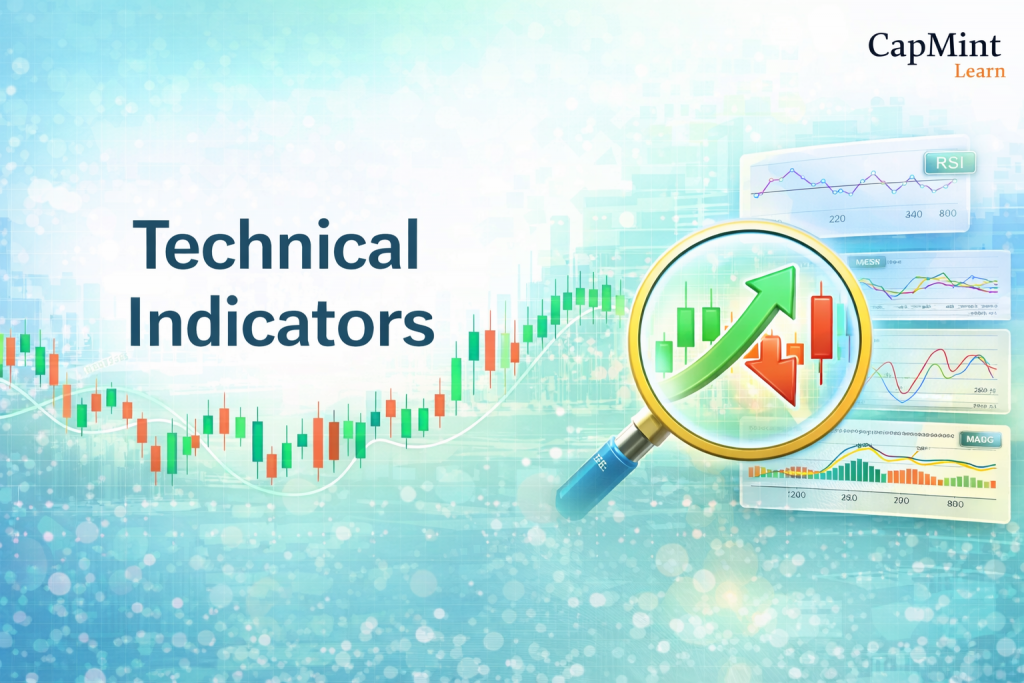
Technical Indicators
Technical indicators are mathematical calculations based on the price or volume of a security. They are used by traders and analysts to forecast future market trends and identify trading opportunities.
Key Takeaways
- Technical indicators simplify market data: They help traders identify trends, momentum, volatility, and volume by translating complex price and volume data into actionable insights for better trading decisions.
- Leading vs. lagging indicators serve different purposes: Lagging indicators confirm trends after they occur (e.g., Moving Averages, MACD), while leading indicators predict potential reversals (e.g., RSI, Stochastic Oscillator).
- Four main types serve unique functions: Trend, momentum, volatility, and volume indicators. Each offers distinct insights, helping traders understand market direction, price speed, risk levels, and trade confirmation strength.
- Effective use requires strategy and balance: Combining complementary indicators, avoiding chart clutter, and testing strategies improves reliability.
What Are Technical Indicators?
Stock market technical indicators are designed to provide actionable insights. They digest complex market data and present it in a simplified way to help traders:
- Spot emerging trends
- Measure momentum
- Confirm patterns
- Identify entry and exit points
They are particularly valuable in volatile markets where rapid decision-making is crucial. By offering objective data points, technical indicators reduce emotional bias and help traders stay disciplined. That said, indicators are tools, not answers. They work best when the trader using them understands what the indicator is measuring and, equally important, what it is not measuring. An RSI reading of 75, for instance, tells you about the speed of recent price gains relative to losses, but it says nothing about whether the company just announced strong earnings or is about to face a regulatory issue.
Lagging vs. Leading Indicators
Technical indicators can be broadly categorised into two types:
Lagging Indicators
These are reactive tools that follow price action. They help confirm an ongoing trend and are typically used to validate signals after a movement has started. Examples include Moving Averages and MACD.
Lagging indicators are often criticised for being “late,” but that delay is also their strength. Because they require a trend to establish itself before generating a signal, they tend to produce fewer false signals during strongly trending markets. The trade-off is that they can be slow to react at turning points, which means entries and exits may come a few sessions after the optimal point.
Leading Indicators
These are predictive tools that aim to signal future price movements. They work well in range-bound or sideways markets and can highlight potential reversals before they happen. For example, the Relative Strength Index (RSI) and the Stochastic Oscillator.
Leading indicators attempt to anticipate rather than confirm, which makes them faster but also more prone to false signals. In a strong trending market, a leading indicator like RSI can remain in overbought territory for weeks while the stock continues climbing, generating repeated sell signals that would have been premature to act on.
Using both types in tandem allows traders to balance confirmation with anticipation, improving the accuracy and reliability of trading decisions. A common and practical pairing is using a lagging indicator like a moving average to establish the trend direction, and then using a leading indicator like RSI to time entries within that trend.
Additionally, understanding the context, whether the market is trending or consolidating, can significantly enhance the effectiveness of technical indicators. Most indicator-related frustration comes from applying a tool designed for trending markets in a sideways environment, or vice versa.
Types of Technical Indicators
There are four main categories of technical indicators, each serving a specific purpose:
Trend Indicators
Trend indicators are designed to help traders determine the overall direction of the market, whether it is moving upward, downward, or sideways. Recognising a trend early allows traders to position themselves accordingly and ride the momentum.
These indicators smooth out short-term price fluctuations to highlight the prevailing direction over a given period. They are particularly useful in trending markets, where they help filter out market noise and provide clarity on the dominant trend. A few such indicators are MACD and Moving Averages. On Indian large-cap stocks and indices like Nifty 50, trend indicators on the daily timeframe tend to capture broad multi-week moves reliably. On lower timeframes, such as 5-minute or 15-minute charts, the same indicators generate considerably more noise, and the signals require more aggressive filtering.
Momentum Indicators
Momentum indicators are tools that measure the rate at which prices move over a specific period. Rather than focusing on the direction of a trend, these indicators help traders read the strength and speed of price changes. They are particularly useful for identifying potential reversals and pinpointing when an asset is becoming overbought or oversold.
These indicators are widely used in both trending and range-bound markets. In a strong trend, momentum indicators help traders determine whether the trend still has room to run or if it’s weakening. Even in consolidating markets, they can be used to catch early breakouts. For example, the RSI and the Stochastic Oscillator.
One practical nuance: “overbought” does not mean “about to fall”. During strong uptrends on stocks with institutional buying, momentum indicators can remain in overbought territory for extended periods. The overbought reading is informational, not a standalone sell signal.
Volatility Indicators
Volatility indicators measure the degree of price variation over a specific period, helping traders understand how much an asset’s price is fluctuating. These tools are crucial for assessing market risk, adjusting position sizes, and timing trades effectively, especially in uncertain or rapidly changing market environments.
High volatility often signals larger price movements and potentially greater risk, but it can also mean more trading opportunities. Low volatility, on the other hand, might indicate market consolidation or reduced momentum. By monitoring volatility, traders can adapt their strategies to current market conditions. For example, Bollinger Bands and ATR (Average True Range). A useful application of ATR for Indian market traders is position sizing: dividing your per-trade risk amount by the stock’s 14-day ATR gives a data-driven lot size that adjusts automatically to current volatility conditions, rather than using a fixed number of shares regardless of how volatile the stock is.
Volume Indicators
Volume indicators analyse the number of shares or contracts traded in a security or market over a specific time. Volume is a key measure of market strength. Rising volume often indicates strong interest and conviction behind a price move, while falling volume may suggest weakening momentum or indecision.
These indicators are especially useful for confirming trends and validating price breakouts or reversals. For example, On-Balance Volume (OBV) and Chaikin Money Flow (CMF).
On Indian exchanges, volume data is readily available for equities, but can be misleading on stocks with low free float, where a single large block deal can spike volume without reflecting broad market participation. For Nifty 50 and Bank Nifty constituents, where daily volumes are deep and consistent, volume indicators tend to be more reliable as confirmation tools.
Popular Technical Indicators Explained
Here’s a closer look at some of the most widely used technical indicators:
Moving Average (MA)
A simple yet practical tool, the Moving Average smooths out price data to help identify trends. Common types include Simple Moving Average (SMA) and Exponential Moving Average (EMA).
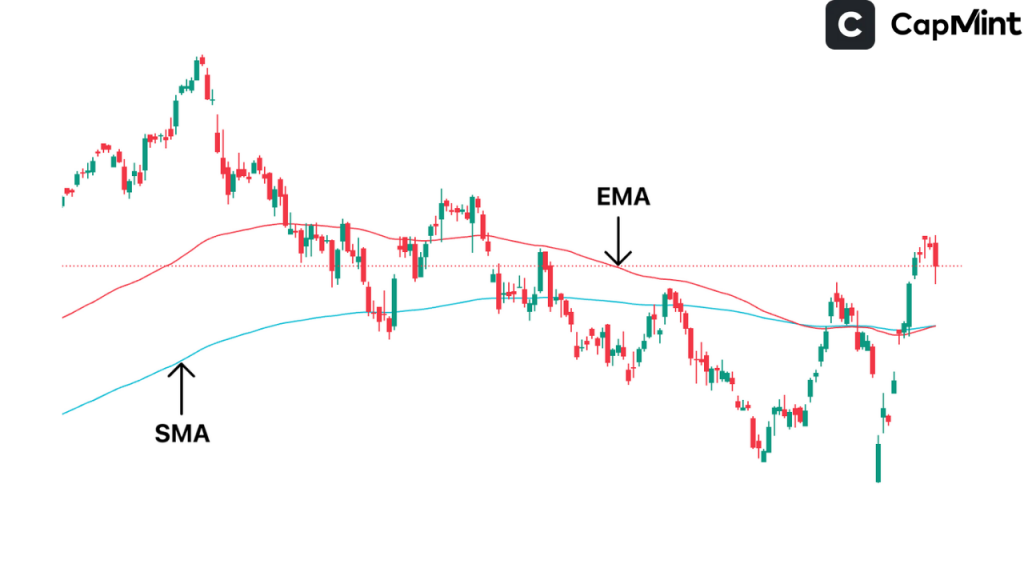
The SMA gives equal weight to all data points in the period, while the EMA gives more weight to recent prices, making it more responsive to current price action. For intraday traders on Indian markets, the 9-EMA and 20-EMA on 15-minute charts are commonly used for quick trend identification on Bank Nifty and Nifty options trading. For swing and positional traders, the 50-day and 200-day SMAs on daily charts are the most widely watched levels.
The 200-day SMA, in particular, serves as a widely recognised dividing line between bullish and bearish territory. When a stock trades above its 200-day SMA, the long-term trend is generally considered positive, and vice versa. The “golden cross” (50-day SMA crossing above the 200-day SMA) and “death cross” (50-day crossing below) are among the most discussed moving average signals, though by the time these crossovers occur, a significant portion of the trend has typically already played out.
Relative Strength Index (RSI)
RSI is a momentum oscillator that measures the speed and magnitude of recent price changes on a scale of 0 to 100. If it’s above 70, the stock may be overbought; if it’s below 30, it may be oversold.
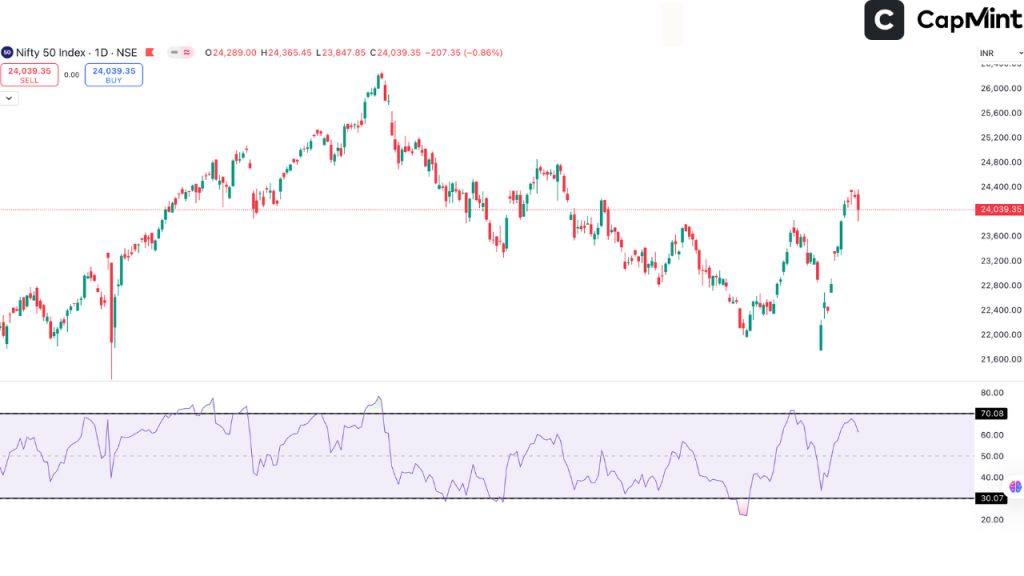
Beyond the basic overbought/oversold readings, RSI divergence is one of the more useful signals the indicator provides. If a stock makes a new high but RSI makes a lower high, it suggests that the momentum behind the uptrend is weakening, even though the price is still rising. This bearish divergence doesn’t guarantee an immediate reversal, but it serves as an early warning that the trend’s strength is fading. Similarly, bullish divergence, where price makes a lower low but RSI makes a higher low, can signal that selling pressure is exhausting itself.
The standard 14-period setting works well on daily charts for most Indian stocks. Shorter periods (7 or 9) make the indicator more sensitive and are preferred by intraday traders, while longer periods (21) smooth out noise for positional analysis.
MACD
The MACD (Moving Average Convergence Divergence) is a trend-following momentum indicator that reveals the relationship between two moving averages, typically the 12-period and 26-period EMAs. The MACD line is the difference between these two, and a 9-period EMA of the MACD line serves as the signal line.
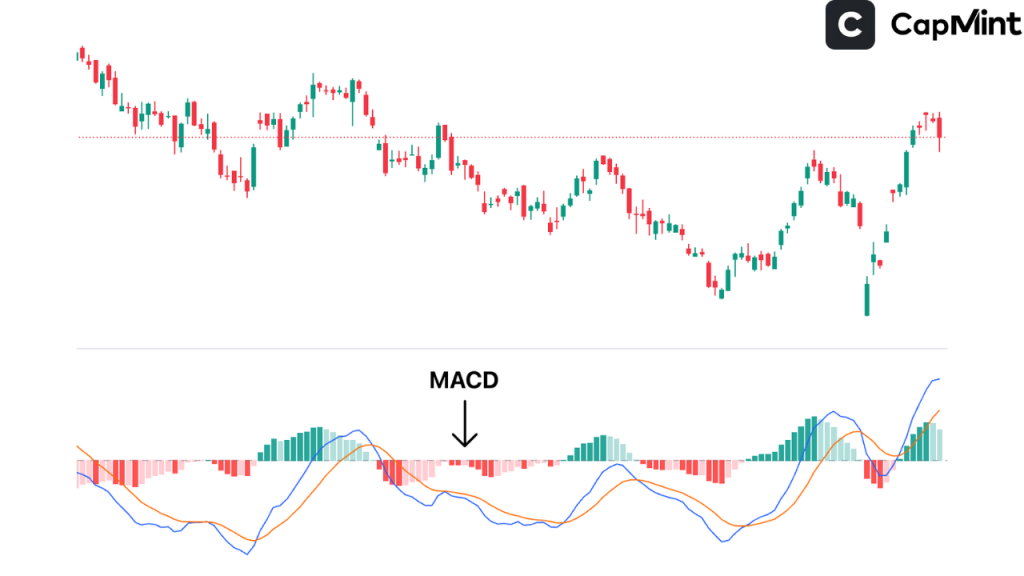
MACD is particularly useful for identifying potential buy or sell signals through crossovers and divergences. When the MACD line crosses above the signal line, it generates a bullish signal; when it crosses below, a bearish one. The MACD histogram, which shows the distance between the MACD line and the signal line, provides a visual representation of momentum strength.
One limitation worth noting: MACD can produce frequent whipsaw signals during sideways or choppy markets, generating alternating buy and sell crossovers that result in small losses on each trade. Filtering MACD signals by only acting on crossovers that align with the broader trend direction, determined by a longer-term moving average, significantly reduces these false signals.
Bollinger Bands
Bollinger Bands consist of a middle band (typically a 20-period SMA) and two outer bands set at two standard deviations above and below the middle band. They measure price volatility and expand or contract based on market conditions.
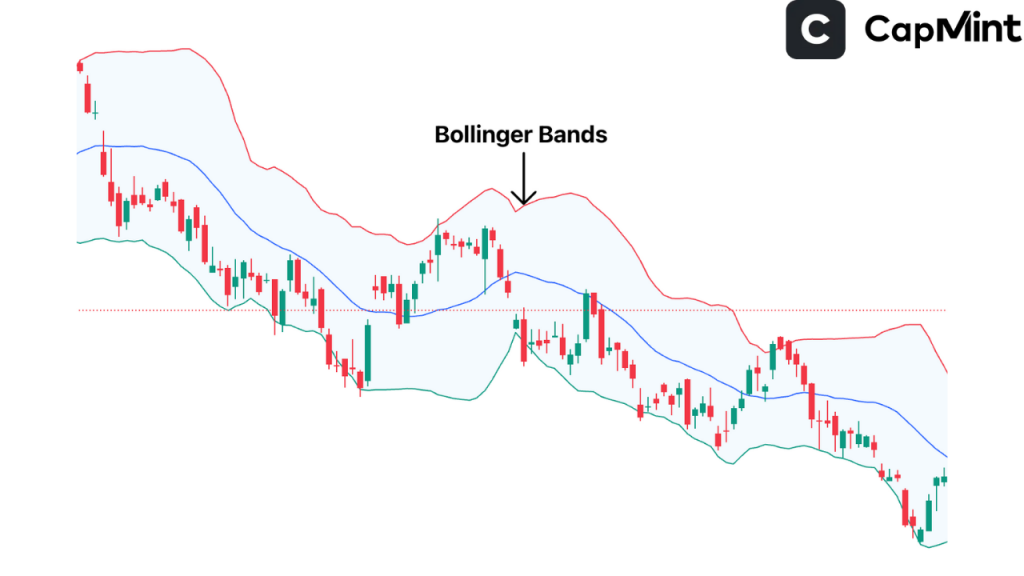
When the bands widen, it means volatility is increasing. When they narrow, often called a “Bollinger squeeze,” it typically precedes a significant move in either direction. The squeeze itself doesn’t indicate direction; it signals that a breakout is likely. Traders watch for which side the price breaks out from and then look for volume confirmation to validate the move.
A common misapplication is treating the upper band as automatic resistance and the lower band as automatic support. In trending markets, the price can “walk the band,” staying near or beyond the upper band for extended periods during an uptrend or hugging the lower band during a downtrend. Bollinger Bands work best as a volatility and mean-reversion tool in range-bound conditions, not as overbought/oversold boundaries during trending phases.
Stochastic Oscillator
The Stochastic Oscillator compares a stock’s closing price to its price range over a specific period, typically 14 periods. It produces two lines, %K and %D, both oscillating between 0 and 100. Readings above 80 suggest overbought conditions, while readings below 20 suggest oversold conditions.
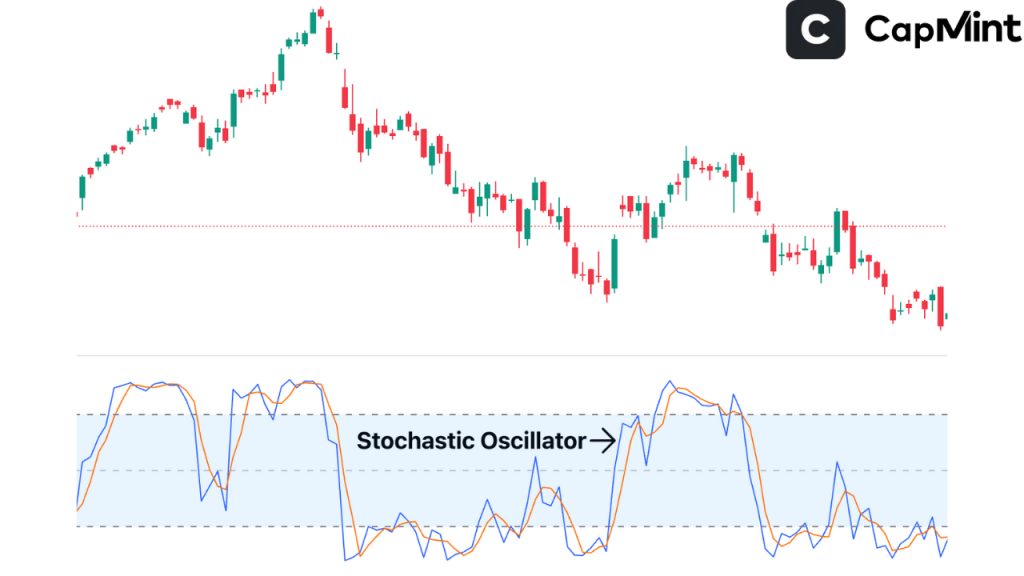
The Stochastic tends to generate more frequent signals than RSI because it is more sensitive to price changes. This makes it useful for shorter-term trading and for identifying entry points during pullbacks within a larger trend. However, the increased sensitivity also means more false signals, particularly during strong directional moves.
A practical application for Indian market traders: in a confirmed uptrend (identified by a rising 50-day moving average, for instance), buying when the Stochastic dips below 20 and then crosses back above it can provide favourable entry points during temporary pullbacks. This approach uses the Stochastic as a timing tool within a trend established by a separate indicator, rather than as a standalone signal.
VWAP (Volume Weighted Average Price)
While not listed in the original categories above, VWAP deserves mention because of its widespread use among intraday traders on Indian exchanges. VWAP calculates the average price a stock has traded at throughout the day, weighted by volume. It gives a sense of whether the current price is above or below the day’s average transaction price.
Institutional traders often use VWAP as a benchmark for execution quality, and many algorithmic strategies are designed to execute at or near VWAP. For retail intraday traders, VWAP serves as a dynamic support and resistance level. Prices above VWAP suggest bullish intraday sentiment, while prices below suggest bearish sentiment. On liquid Nifty 50 stocks, VWAP tends to act as a meaningful reference level throughout the session, particularly during the 10 AM to 2 PM window when volume is deepest.
How to Use Technical Indicators Effectively
While technical indicators for the share market can be powerful tools, they’re most effective when used with a clear strategy:
Combine Multiple Indicators
Using a combination of indicators together (e.g., MACD with RSI) allows traders to validate trading signals from different perspectives. This confirmation process helps filter out noise and reduce the chances of acting on false signals. The key is to combine indicators that measure different things. Using RSI and Stochastic together, for instance, provides limited additional insight because both measure momentum. Pairing a trend indicator (moving average) with a momentum indicator (RSI) and a volume indicator (OBV) covers three distinct dimensions of market behaviour and produces more robust signals.
Avoid Overloading Your Chart
Cluttering your chart with too many indicators can lead to confusion and conflicting signals. It becomes harder to focus on price action and may cause indecision. Two to three indicators, each serving a distinct purpose, is generally sufficient for most trading setups. Adding a fourth or fifth indicator rarely improves decision quality and often introduces contradictory signals that delay action.
Match Indicators to Market Conditions
Trend indicators perform best in trending markets, while oscillators like RSI and Stochastic are more useful in range-bound environments. Recognising which phase the market is in before selecting which indicators to prioritise is a practical habit that improves signal quality. A simple check: if the 50-day moving average is rising and the price is above it, treat the market as trending and give more weight to trend-following signals. If the price is oscillating around a flat moving average, treat it as range-bound and give more weight to oscillator readings.
Test Your Strategy
Before applying any strategy to a live account, it’s essential to test it thoroughly. Use demo trading platforms or backtesting software to analyse how your chosen indicators perform under different market conditions. This helps identify strengths, weaknesses, and potential adjustments. Many Indian brokers now offer backtesting tools within their platforms, allowing traders to test indicator-based strategies against historical Nifty and stock data before committing real capital.
Adjust Parameters to the Timeframe
Default indicator settings (14-period RSI, 20-period Bollinger Bands, 12-26-9 MACD) are designed for daily charts. When using indicators on intraday charts (5-minute, 15-minute), these default settings may need adjustment. Shorter lookback periods make indicators more responsive on lower timeframes, while longer periods are appropriate for weekly or monthly analysis. There is no universally correct setting; the goal is to find parameters that produce signals aligning with the holding period and trading style being used.
Limitations of Technical Indicators
While technical indicators offer valuable insights, they come with inherent drawbacks that traders must be aware of:
False Signals
Technical indicators can generate misleading signals, especially in sideways or low-volatility markets. In such conditions, indicators may frequently suggest potential breakouts or trend reversals that fail to materialise, leading to potential losses if trades are executed based solely on these cues. On Indian mid-cap stocks with lower liquidity, false signals are more common because erratic price movements and thin order books can produce indicator readings that don’t reflect genuine shifts in supply and demand.
Lag Time
Many popular indicators, such as moving averages and MACD, are lagging in nature, meaning they follow price movements rather than predict them. This delay can result in missed opportunities or late entries and exits, particularly during fast-moving markets. The lag is inherent to the calculation method and cannot be eliminated without making the indicator so sensitive that it generates excessive noise. Accepting this trade-off between responsiveness and reliability is part of using indicators effectively.
Over-Reliance
Depending too heavily on technical indicators can create a tunnel vision effect, where traders ignore broader market conditions, news events, or fundamental data that may impact price movement. Without considering the bigger picture, even a technically sound setup can be undermined by real-world events. A perfect MACD bullish crossover on a stock means very little if the company is about to report a significant earnings miss or is facing regulatory action. Indicators read price and volume history; they do not read news, balance sheets, or management quality.
Indicator Redundancy
Using multiple indicators that measure the same underlying data (for instance, RSI and Stochastic together, or SMA and EMA together) creates the illusion of confirmation without adding genuine informational value. When both signal the same thing, it’s not independent confirmation; it’s two calculations built on the same price data arriving at similar conclusions. True confirmation comes from indicators measuring different market dimensions: trend, momentum, volume, and volatility.
These limitations highlight why many experienced traders integrate technical analysis with fundamental analysis and real-time market context to form a more comprehensive trading approach. Indicators are most useful when treated as one input among several, not as the sole basis for trading decisions.
Conclusion
Technical indicators are practical tools for traders who want to make more structured, data-driven decisions. Whether you’re analysing trends with Moving Averages, spotting momentum shifts with RSI, or gauging volatility with Bollinger Bands, these indicators can enhance your market insight and provide a framework for disciplined trading.
But no indicator guarantees success. The key lies in using them wisely, understanding what each indicator measures and what it does not, combining complementary tools rather than redundant ones, and constantly refining your approach as you gain experience. The traders who benefit most from indicators are those who treat them as decision-support tools rather than decision-makers.
Frequently Asked Questions (FAQs)
What is the best technical indicator for beginners?
The Relative Strength Index (RSI) and Moving Averages are practical starting points due to their simplicity and effectiveness. They help identify trends and overbought or oversold conditions with minimal complexity. Beginning with a 50-day SMA to identify trend direction and a 14-period RSI to gauge momentum gives a beginner two distinct and complementary perspectives on price behaviour without overwhelming the chart.
Can I trade using only one indicator?
You can, but combining indicators typically provides more reliable signals and reduces risk. Using multiple tools helps confirm trends, identify reversals more clearly, and protect against misleading information from a single source. If you choose to use only one, a moving average is arguably the most versatile single indicator, as it provides both trend direction and dynamic support/resistance levels.
Are technical indicators accurate?
They can be useful, but they are not foolproof. Indicators perform best when used in the right market conditions, supplemented with strong trading discipline and contextual awareness. No indicator maintains the same accuracy across all market phases. An indicator that performs well during trending markets may generate repeated false signals during consolidation, and vice versa. Tracking the win rate of your indicator signals over time helps develop realistic expectations.
How many indicators should I use?
Most successful traders use 2–3 complementary indicators to avoid conflicting signals and chart clutter. The ideal combination covers different dimensions: one for trend, one for momentum, and optionally one for volume or volatility. Using too many can overwhelm analysis, while too few might miss important context.
Which are the best technical indicators for day trading?
For day trading, indicators that focus on momentum and trend confirmation work best. Moving Averages (particularly short-period EMAs), RSI, MACD, VWAP, and Bollinger Bands are widely used together to identify entry points, exit levels, and intraday price strength. VWAP is especially relevant for intraday work because it resets each day and provides a real-time volume-weighted reference price that many institutional algorithms also use, making it a natural level around which intraday support and resistance develop.
Disclaimer: This content is for educational purposes only and does not constitute financial or investment advice. Investments in securities or other financial instruments are subject to market risk, including partial or total loss of capital. Past performance is not indicative of future results. Always consider your financial situation carefully and consult a licensed financial advisor before making investment or trading decisions.
Engineered for the obsessed. Built for traders.

Purpose-built terminals.
Zero compromise.
Built for speed.
Plot No 1290, 2nd Floor, 17th Cross, 5th Main, Sector-7, HSR Layout, Bangalore 560102
Follow us on
Mintcap Brokers Private Limited
CIN – U66110KA2023PTC178706 | Registered Address: Plot No 1290, Second Floor, 17th Cross, 5th Main, Sector-7, HSR Layout, Bangalore 560102 | Tel: 080 – 49552310 | Email ID: compliance@capmint.com | SEBI registered Stock Broker: INZ000322732 | NSE Cash/F&O Member ID: 90430 | BSE Cash/F&O Member ID: 6903 | MCX Member ID: 57400 | NCDEX Member ID: 1312 | SEBI registered Depository Participant: IN-DP-806-2025 | CDSL DP ID: 12102300 | NSE Clearing Member code: M70108 | AMFI-Registered Mutual Fund Distributor: ARN-289109 (Valid upto 28-Feb-2027) | Category II Execution Only Platform : E6903
Details of Client Bank Account
Compliance Officer: Ms. Shridevi Vungarala | Email ID: compliance@capmint.com | Tel no. + 91 9035330126 | Grievance Redressal Officer (GRO) – Ms. Shikha Gupta | Email ID: Grievance@capmint.com | Tel no: 9035331595.
Procedure to file a complaint on SEBI SCORES: Register on SCORES portal. Mandatory details for filing complaints on SCORES: Name, PAN, Address, Mobile Number, E-mail ID. Benefits: Effective Communication, Speedy redressal of the grievances. You may refer the website https://scores.sebi.gov.in/ for more information. You may also download the SEBI Scores app to log a complaint Android: https://play.google.com > store > apps > sebiscores iOS: https://apps.apple.com > app > sebiscores
Disclaimer
Investment in the securities market are subject to market risks, read all the related documents carefully before investing. Brokerage will not exceed the SEBI prescribed limit.
Mutual fund investments are subject to market risks, read all scheme related documents carefully before investing. Mutual Funds are not exchange-traded products.
Attention Investor:
- Stock Brokers can accept securities as margin from clients only by way of pledge in the depository system w.e.f. September 1, 2020.
- Update your mobile number & email Id with your stock broker/depository participant and receive OTP directly from depository on your email id and/or mobile number to create pledge.
- Pay 20% as upfront margin of the transaction value to trade in cash market segment.
- Investors may please refer to the Exchange’s Frequently Asked Questions (FAQs) issued vide circular reference NSE/INSP/45191 dated July 31, 2020 and NSE/INSP/45534 dated August 31, 2020 and other guidelines issued from time to time in this regard.
- Check your Securities /MF/ Bonds in the consolidated account statement issued by NSDL/CDSL every month.