
Link copied!
Stochastic Oscillator
The Stochastic Oscillator is a momentum indicator used in technical analysis that compares a stock’s closing price to its price range over a specific period. These Indicators help traders identify potential overbought and oversold conditions in the market.
Key Takeaways
- The stochastic oscillator is a tool that compares the current closing price of a stock to its recent price range. It helps traders find out if a stock might be overbought or oversold.
- When the value goes above 80, it may mean the stock is overbought. When it goes below 20, it may be oversold. These are signs to be cautious, but not guaranteed signals to buy or sell.
- The indicator uses two lines, %K and %D. When these lines cross, it can show a possible change in momentum and help traders decide entry or exit points.
- The stochastic oscillator is helpful but not perfect. It can give false signals, especially in sideways markets. That’s why it’s better to use it with other tools like support/resistance, RSI, or trendlines.
What is the Stochastic Oscillator?
George C. Lane developed the stochastic oscillator in the 1950s. The idea is to compare the closing price of an asset to the range of its prices over a specific period, typically 14 periods (days, hours, etc., depending on the chart). It’s primarily used to identify overbought and oversold conditions and to anticipate potential price reversals.
The stochastic oscillator ranges between 0 and 100. A reading above 80 means the asset is near the top of its recent range, possibly overbought. A reading below 20 means it’s near the bottom, possibly oversold.
Formula And Components Of the Stochastic Oscillator
The core idea of the Stochastic Oscillator is relative positioning, where today’s closing price stands compared to the recent high-low range.
Here’s how it works:
%K = [(Current Close – Lowest Low) / (Highest High – Lowest Low)] × 100
Where:
- Current Close = latest closing price
- Lowest Low = lowest price over the lookback period (e.g., 14 days)
- Highest High = the highest price over the same period
This produces a value between 0 and 100:
- If the price closed at the highest point of the range – %K = 100
- If the price closed at the lowest point of the range – %K = 0
- If it closed midway – %K = 50
What Is %D and Why It Matters
- %K is known as the fast stochastic line – it reacts quickly to price changes.
- %D is the slow stochastic line – it’s simply a 3-day simple moving average of %K.
This smoothing of %K into %D helps filter out market noise and provides better, more stable signals.
Roles of %K and %D in Analysis:
- Signal Line Crossover:
- When %K crosses above %D, it can signal a buy opportunity.
- When %K crosses below %D, it may indicate a sell opportunity.
- These are most powerful when occurring in overbought (>80) or oversold (<20) zones.
- Identifying Divergences:
- If the price is making new highs but the Stochastic (%K/%D) is not, it shows a bearish divergence, and momentum is weakening.
- If price is making new lows, but Stochastic is rising, it’s a bullish divergence, a reversal could be near.
How to Read Stochastic Signals?
A stochastic indicator is a momentum indicator that shows the overbought and oversold signals in the market or index. Here is how to read them:
Overbought and Oversold Levels
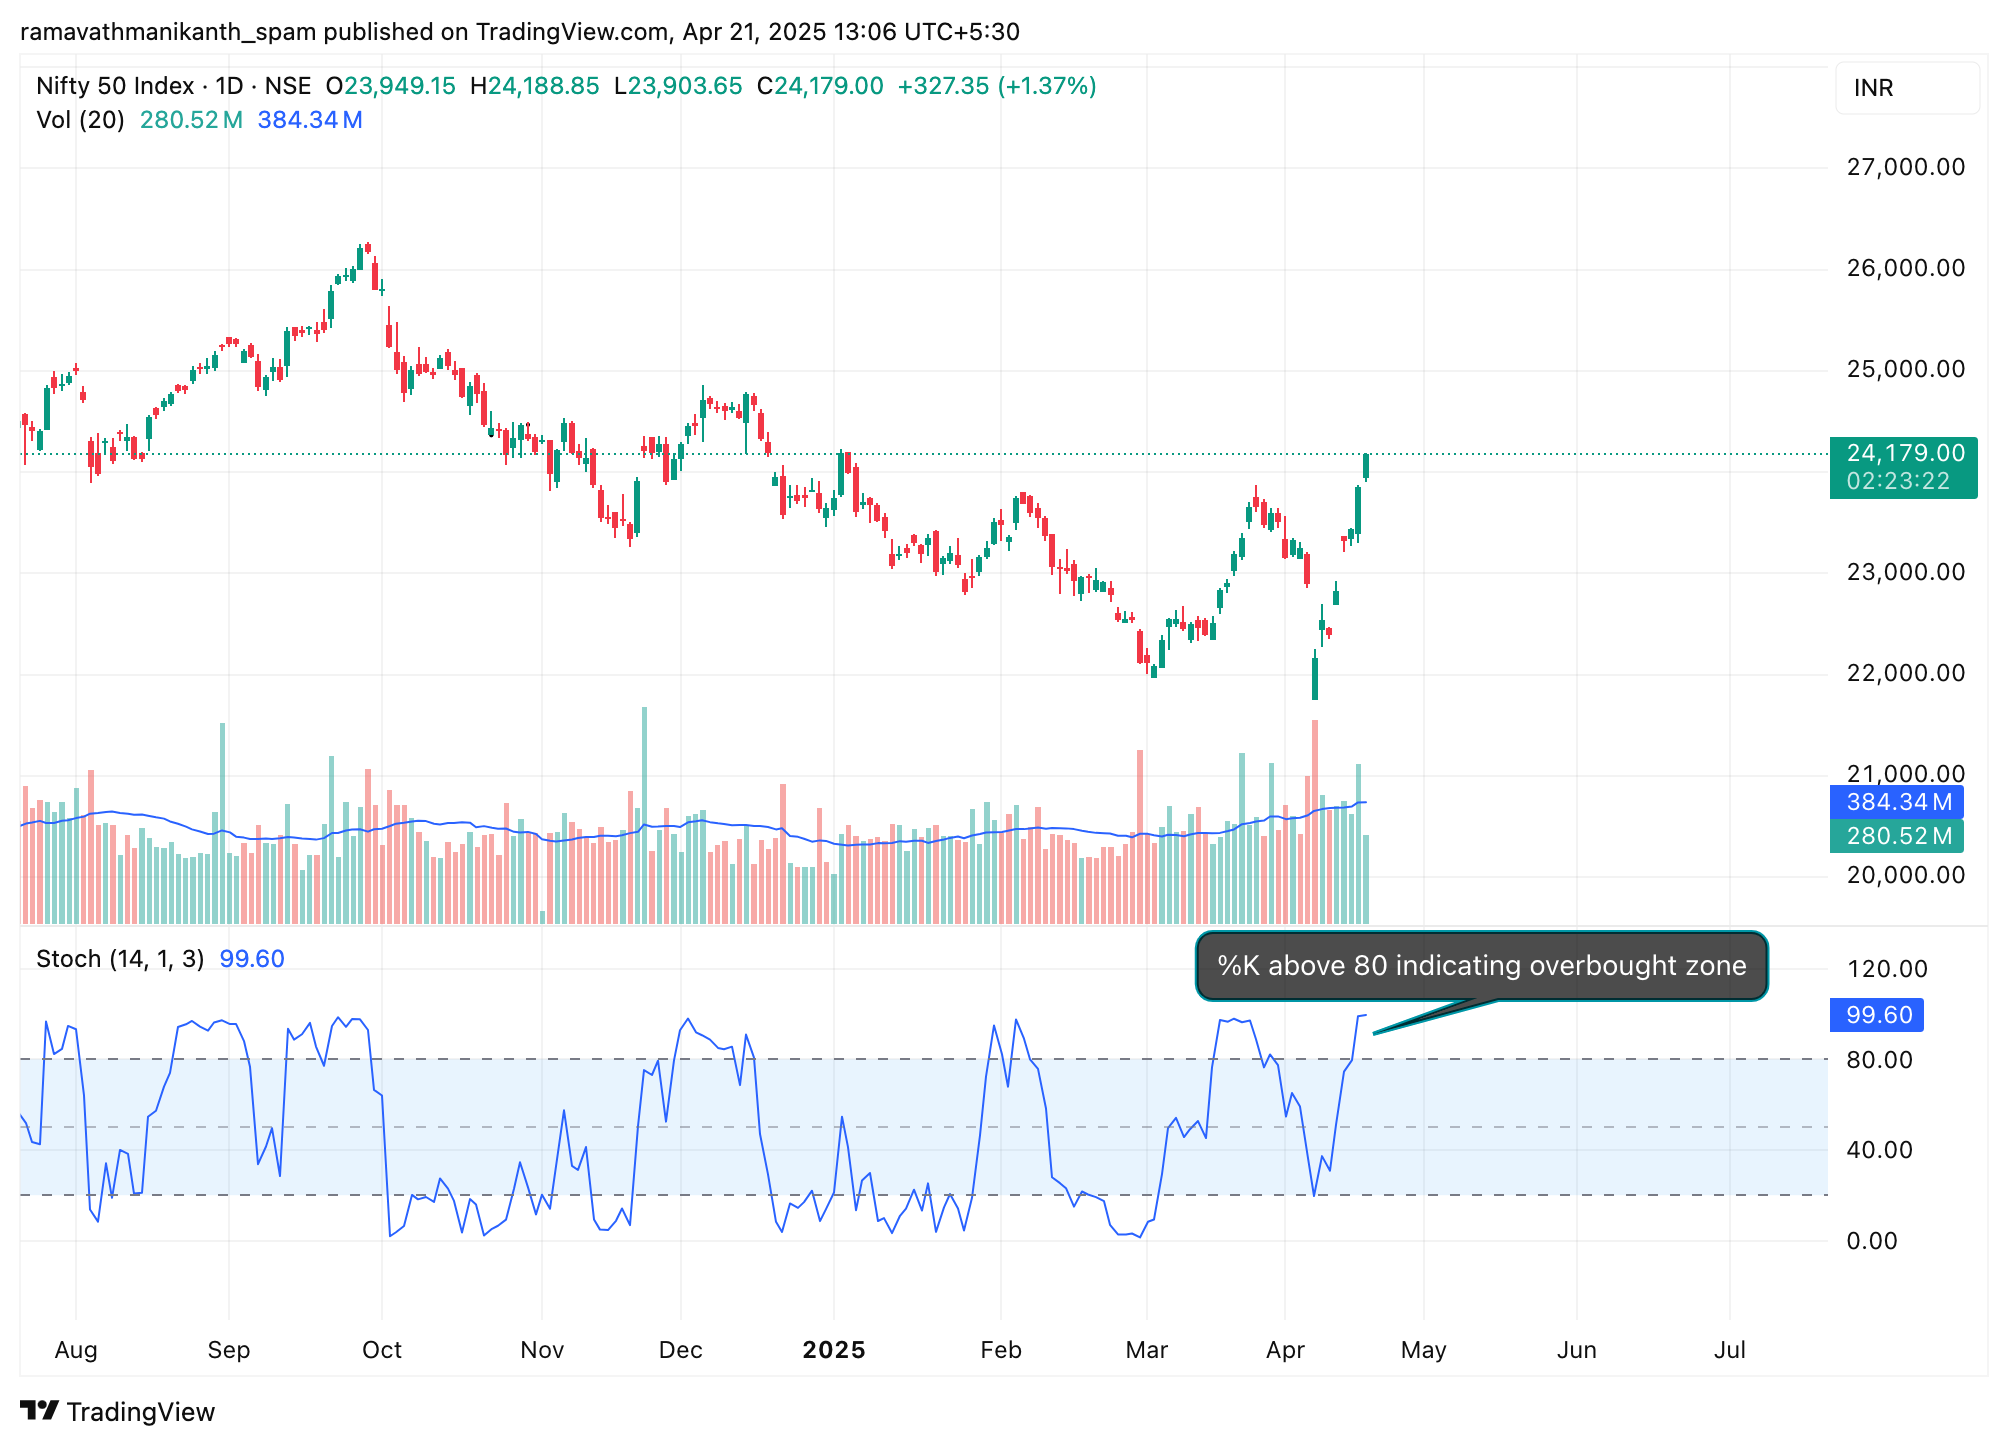
Overbought: When the %K value is above 80, the asset is considered overbought, meaning it’s trading near the top of its recent price range. For example, in the below graph of Nifty, a value above 80 indicates that the index is in the overbought zone.
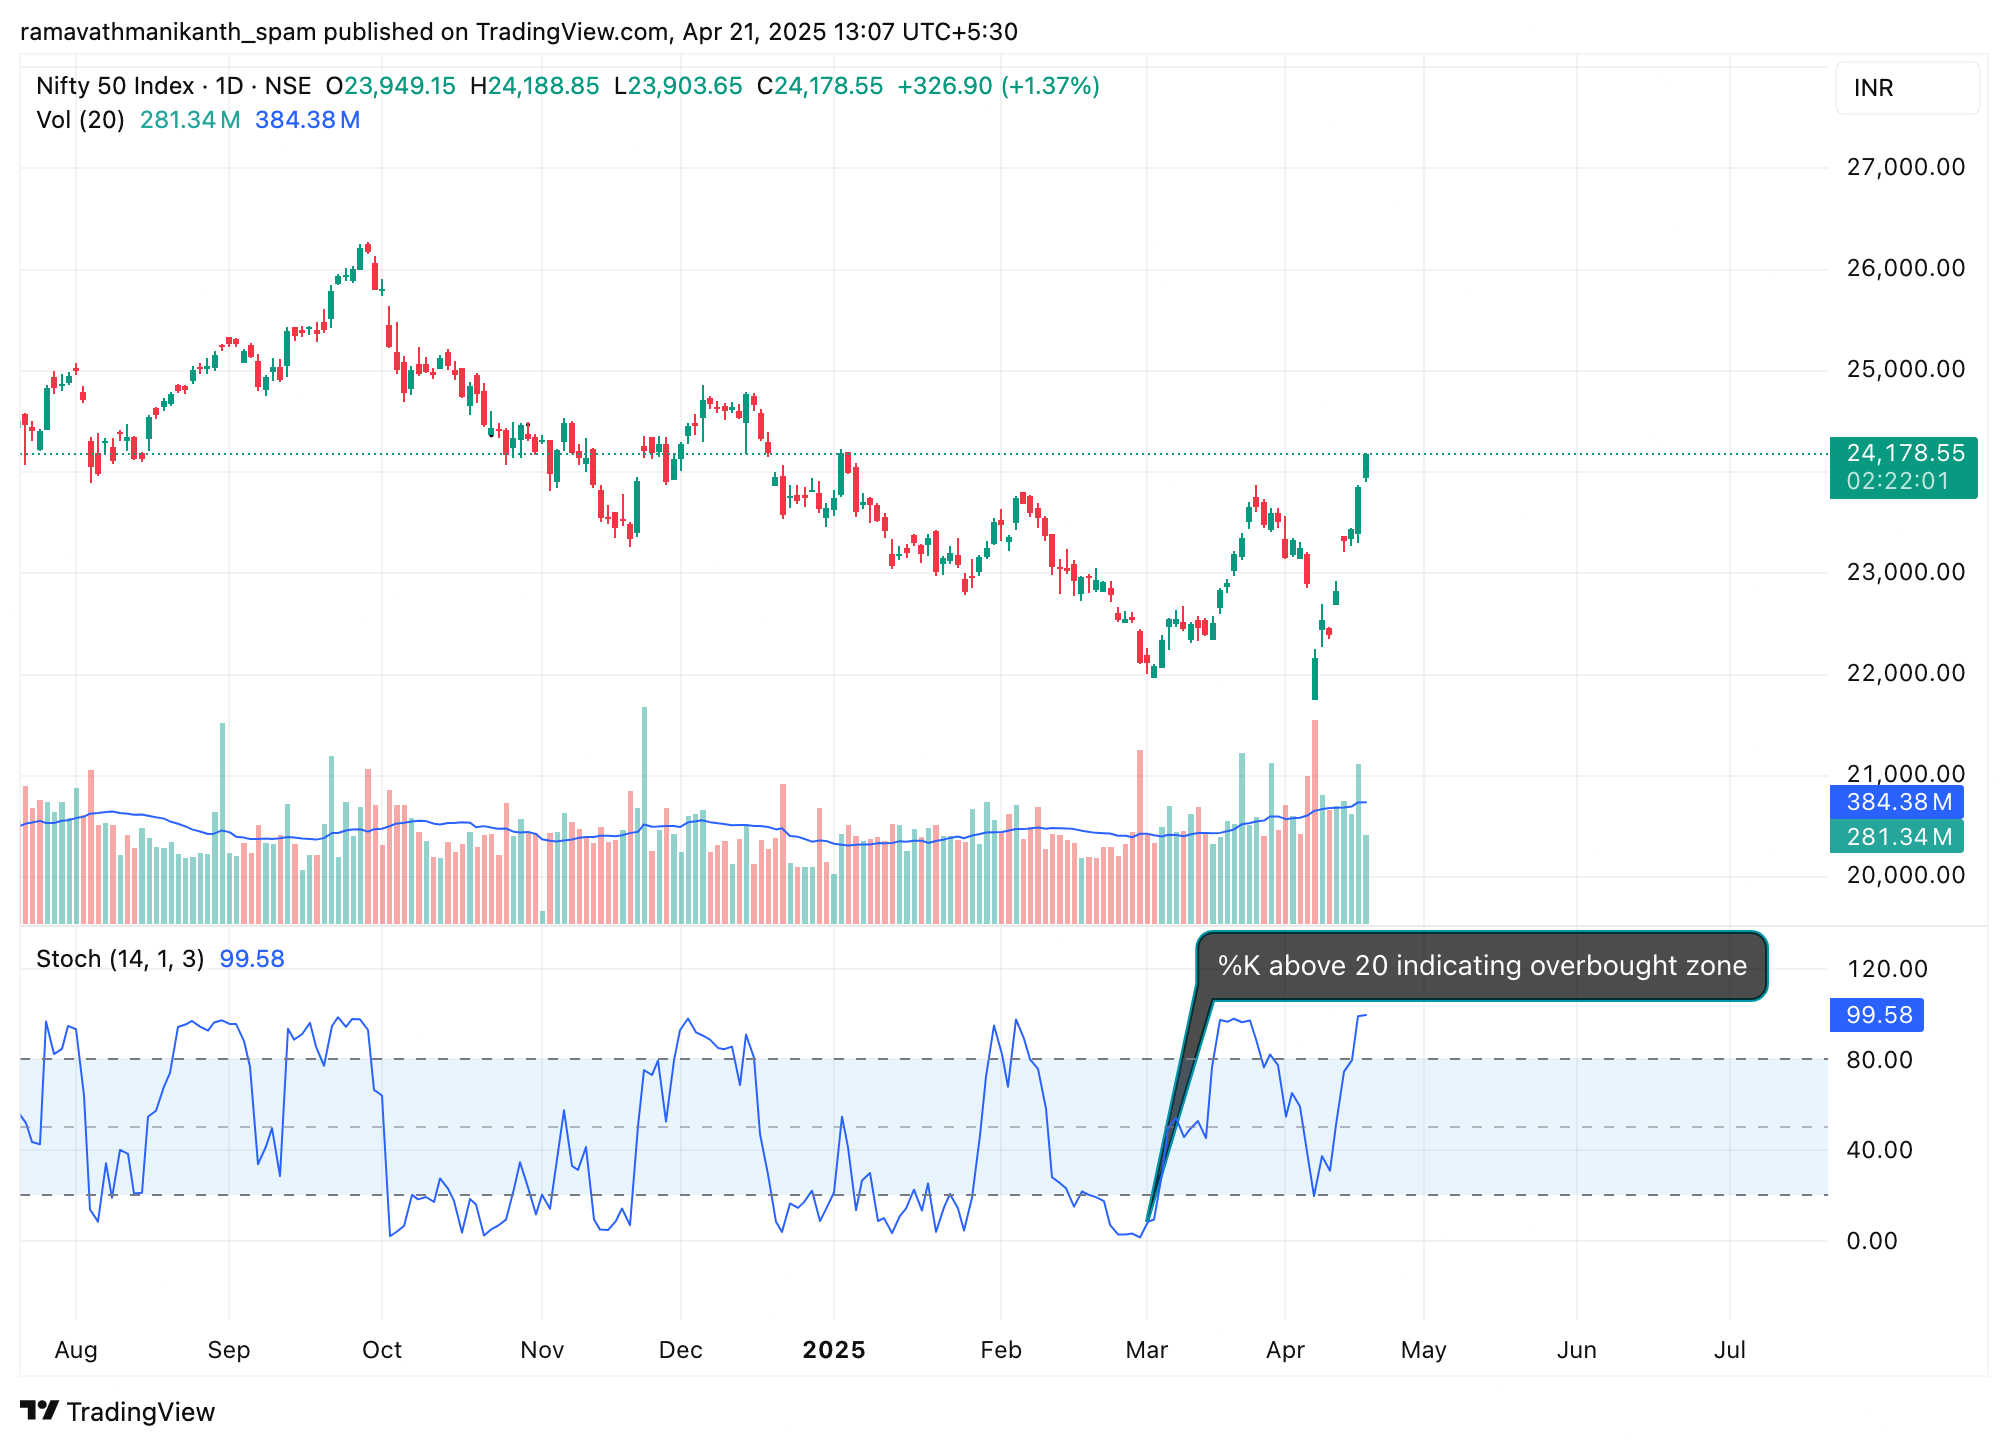
Oversold: When the %K falls below 20, the asset is seen as oversold, trading near the bottom of its recent range. Nifty is trading below 20, indicating an oversold zone.
Just because an asset is overbought doesn’t mean you should sell it, and just because it’s oversold doesn’t mean you should buy it. These levels only suggest that the price has moved too far in one direction; they don’t guarantee that the price will reverse.
Bullish and Bearish Crossovers
There is also another line in the stochastic oscillator called the %D line. It is a slower, smoothed version of the %K line and is usually calculated using a 3-period simple moving average. When the %K line crosses the %D line, it can give potential entry or exit signals in a stock or index.
Bullish Divergence: When %K crosses above %D in the oversold zone, it shows that momentum is shifting from negative to positive, and buyers are starting to step in. That’s why it’s often seen as an early sign to buy.
Bearish Divergence: When %K crosses % D below in the overbought zone, momentum slows down after a strong move up. Sellers might be entering, or buyers are losing strength, a possible sign to sell or take profits.
For example, in the chart of Asian Paints, the stock moved up after a bullish divergence and fell after a bearish divergence.
Limitations Of the Stochastic Oscillator
Here are the downsides of using the stochastic oscillator:
Gives Too Many Signals in Sideways Markets
In choppy or range-bound markets, the oscillator can give frequent buy and sell signals, many of which may be false or unhelpful.
Does Not Predict Trend Direction
It tells you whether a stock is overbought or oversold, but it doesn’t say whether the trend will continue or reverse. Overbought stocks can stay overbought for a long time in a strong uptrend.
Lagging Nature
Since it’s based on past prices, the signals can sometimes come after the move has already started, especially in fast-moving markets.
Conclusion
The stochastic oscillator is a simple and useful tool that helps traders understand momentum in the market. It shows whether a stock or index is potentially overbought or oversold by comparing its current closing price to its recent price range. While it gives helpful signals, it’s important to remember that no indicator is perfect. The stochastic oscillator can sometimes give false signals, especially in sideways or fast-moving markets. That’s why it’s always better to use it along with other tools like trendlines, RSI, or support and resistance zones.
Understanding how to read %K and %D crossovers and paying attention to market context can make this indicator much more effective. In the end, it’s not just about spotting buy or sell zones, but about improving your overall decision-making with a clearer view of momentum. When used wisely, the stochastic oscillator can become a valuable part of any trading strategy.
Frequently Answered Questions FAQs
What does a Stochastic Oscillator tell you?
The stochastic oscillator tells you how strong or weak the market is by showing where the current price is compared to its recent high and low. If the price is near the top of the range, it may be overbought. If it’s near the bottom, it may be oversold. This helps traders decide when to enter or exit a trade.
What does Stochastic 5-3-3 mean?
Stochastic 5-3-3 is a setting used in the indicator.
- The first number (5) is the number of periods used to calculate the %K line (like 5 days).
- The second number (3) smooths the %K line (like a short moving average).
- The third number (3) is used to create the %D line, which is an average of the smoothed %K line.
In simple words, it controls how sensitive the indicator is to price changes.
What are the Stochastic Oscillator Settings?
The standard settings are 14, 3, 3—14 periods for %K, 3-period smoothing for %K, and 3-period moving average for %D. These settings balance sensitivity and reliability, helping traders identify overbought and oversold conditions effectively.
What is the best timeframe for a stochastic oscillator?
The stochastic oscillator works across all timeframes. Short-term traders prefer 5–15 minute charts, while swing traders use daily charts. Higher timeframes generally provide more reliable signals with fewer false positives.
Disclaimer: This content is for educational purposes only and does not constitute financial or investment advice. Investments in securities or other financial instruments are subject to market risk, including partial or total loss of capital. Past performance is not indicative of future results. Always consider your financial situation carefully and consult a licensed financial advisor before making investment or trading decisions.
Engineered for the obsessed. Built for traders.

Purpose-built terminals.
Zero compromise.
Built for speed.
Plot No 1290, 2nd Floor, 17th Cross, 5th Main, Sector-7, HSR Layout, Bangalore 560102
Follow us on
Mintcap Brokers Private Limited
CIN – U66110KA2023PTC178706 | Registered Address: Plot No 1290, Second Floor, 17th Cross, 5th Main, Sector-7, HSR Layout, Bangalore 560102 | Tel: 080 – 49552310 | Email ID: compliance@capmint.com | SEBI registered Stock Broker: INZ000322732 | NSE Cash/F&O Member ID: 90430 | BSE Cash/F&O Member ID: 6903 | MCX Member ID: 57400 | NCDEX Member ID: 1312 | SEBI registered Depository Participant: IN-DP-806-2025 | CDSL DP ID: 12102300 | NSE Clearing Member code: M70108 | AMFI-Registered Mutual Fund Distributor: ARN-289109 (Valid upto 28-Feb-2027) | Category II Execution Only Platform : E6903
Details of Client Bank Account
Compliance Officer: Ms. Shridevi Vungarala | Email ID: compliance@capmint.com | Tel no. + 91 9035330126 | Grievance Redressal Officer (GRO) – Ms. Shikha Gupta | Email ID: Grievance@capmint.com | Tel no: 9035331595.
Procedure to file a complaint on SEBI SCORES: Register on SCORES portal. Mandatory details for filing complaints on SCORES: Name, PAN, Address, Mobile Number, E-mail ID. Benefits: Effective Communication, Speedy redressal of the grievances. You may refer the website https://scores.sebi.gov.in/ for more information. You may also download the SEBI Scores app to log a complaint Android: https://play.google.com > store > apps > sebiscores iOS: https://apps.apple.com > app > sebiscores
Disclaimer
Investment in the securities market are subject to market risks, read all the related documents carefully before investing. Brokerage will not exceed the SEBI prescribed limit.
Mutual fund investments are subject to market risks, read all scheme related documents carefully before investing. Mutual Funds are not exchange-traded products.
Attention Investor:
- Stock Brokers can accept securities as margin from clients only by way of pledge in the depository system w.e.f. September 1, 2020.
- Update your mobile number & email Id with your stock broker/depository participant and receive OTP directly from depository on your email id and/or mobile number to create pledge.
- Pay 20% as upfront margin of the transaction value to trade in cash market segment.
- Investors may please refer to the Exchange’s Frequently Asked Questions (FAQs) issued vide circular reference NSE/INSP/45191 dated July 31, 2020 and NSE/INSP/45534 dated August 31, 2020 and other guidelines issued from time to time in this regard.
- Check your Securities /MF/ Bonds in the consolidated account statement issued by NSDL/CDSL every month.