
Link copied!
Pullback Trading
Pullback trading is a strategy where traders enter a trade after the price temporarily moves against the main trend (a “pullback”) and then shows signs of continuing in the original direction.
Key Takeaways
- Pullback trading focuses on entering trades during temporary dips or pauses within a strong ongoing trend, offering better entry prices with reduced risk.
- Successful pullback trades require confirmation through technical indicators like moving averages,RSI, or candlestick patterns to avoid mistaking reversals for pullbacks.
- Volume plays a critical role; pullbacks usually occur on low volume, while trend continuation or reversals typically show a noticeable volume shift.
- Risk management is essential: use stop-loss orders, proper position sizing, and a favourable risk-reward ratio to maintain consistent long-term profitability.
Understanding Pullback Trading
Pullback trading is a strategy used by traders to take advantage of temporary pauses or dips in a trend. When a stock or asset is moving steadily in one direction—either up or down—it often doesn’t move in a straight line. Instead, it makes small moves in the opposite direction before continuing. These short-term reversals are called “pullbacks.” In an uptrend, a pullback might look like a small dip in price; in a downtrend, it could be a brief bounce.
Traders using the pullback strategy wait for these dips to happen and then enter the trade when they see signs that the original trend is about to resume. This allows them to buy at a relatively lower price in an uptrend (or sell at a higher price in a downtrend) while still aligning with the broader market direction. Pullback trading is popular because it focuses on low-risk, high-reward entries within existing trends rather than trying to predict trend reversals.
Understanding Pullbacks
To trade pullbacks effectively, it’s important to recognise what they are and what they are not. Misjudging a reversal as a pullback can lead to losses. Here’s how to identify and understand them clearly:
Characteristics
Pullbacks are short-term price movements that go against the current trend. In an uptrend, this means a brief dip; in a downtrend, a temporary bounce. They often occur due to profit-taking, small corrections, or minor reactions to news, while the broader trend remains intact.
Distinguishing from Reversals
The key difference is duration and intention. A pullback is temporary; the price pauses before continuing in the original trend direction. A reversal, on the other hand, signals a potential end to the existing trend and the beginning of a new one. Volume often drops during pullbacks, while reversals are typically accompanied by a strong surge in volume, indicating a shift in stock market control.
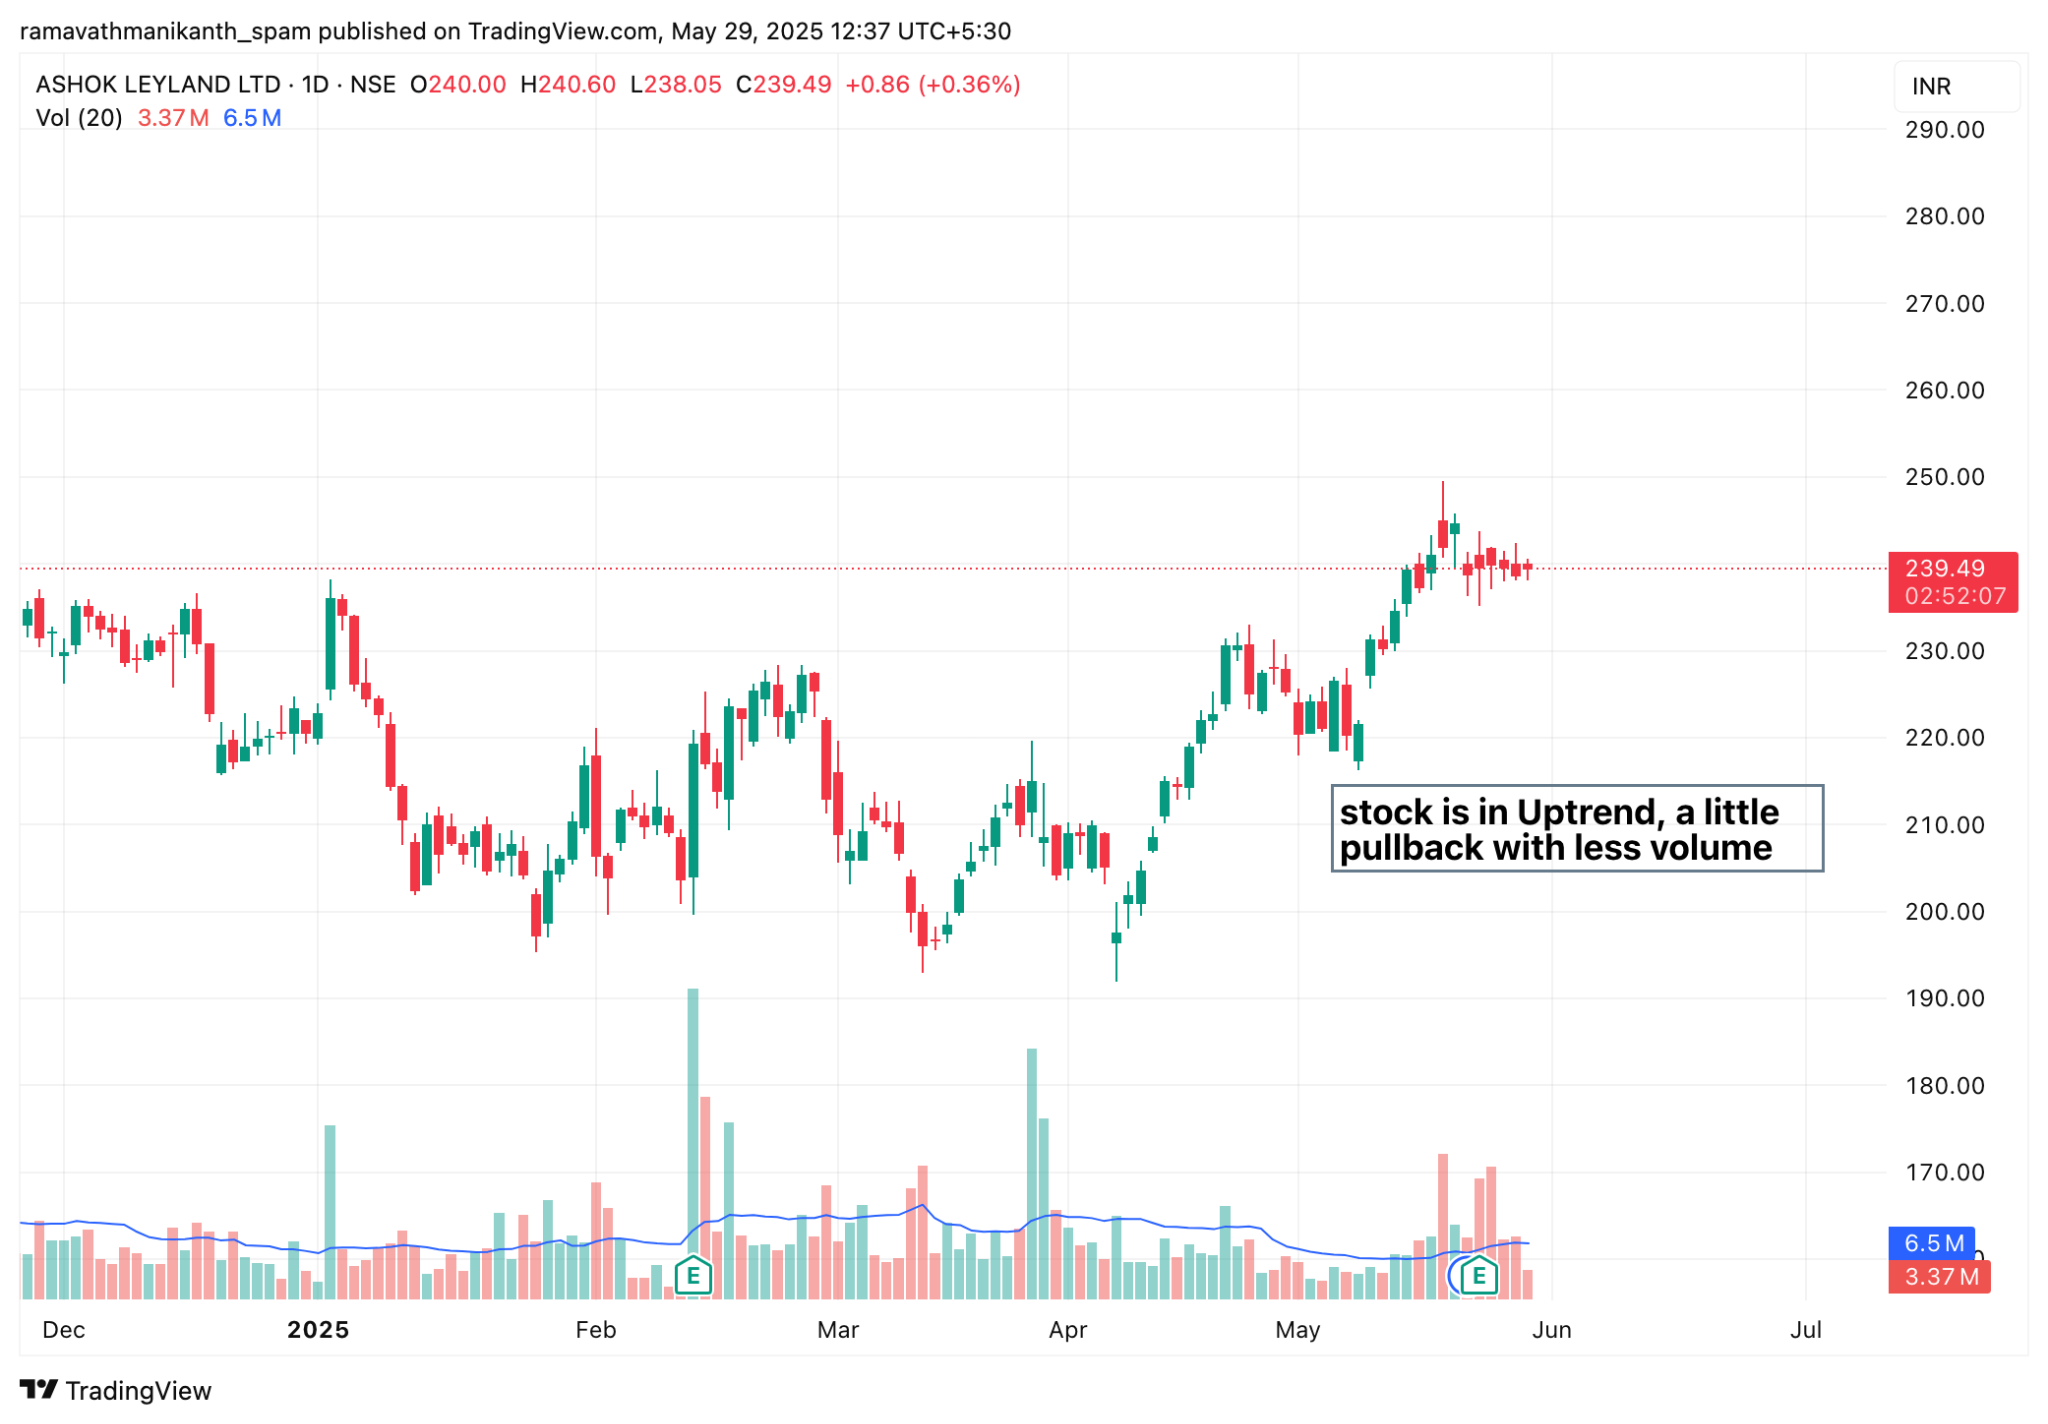
In the Ashok Leyland chart, the stock is in a strong uptrend and recently showed a minor pullback. The dip occurred on low volume, suggesting temporary profit-taking rather than a trend reversal.
Steps in Pullback Trading Strategy
Pullback trading is not about guessing tops or bottoms; it’s about entering at the right moment within a trend. To improve timing and reduce risk, here’s a step-by-step process to follow:
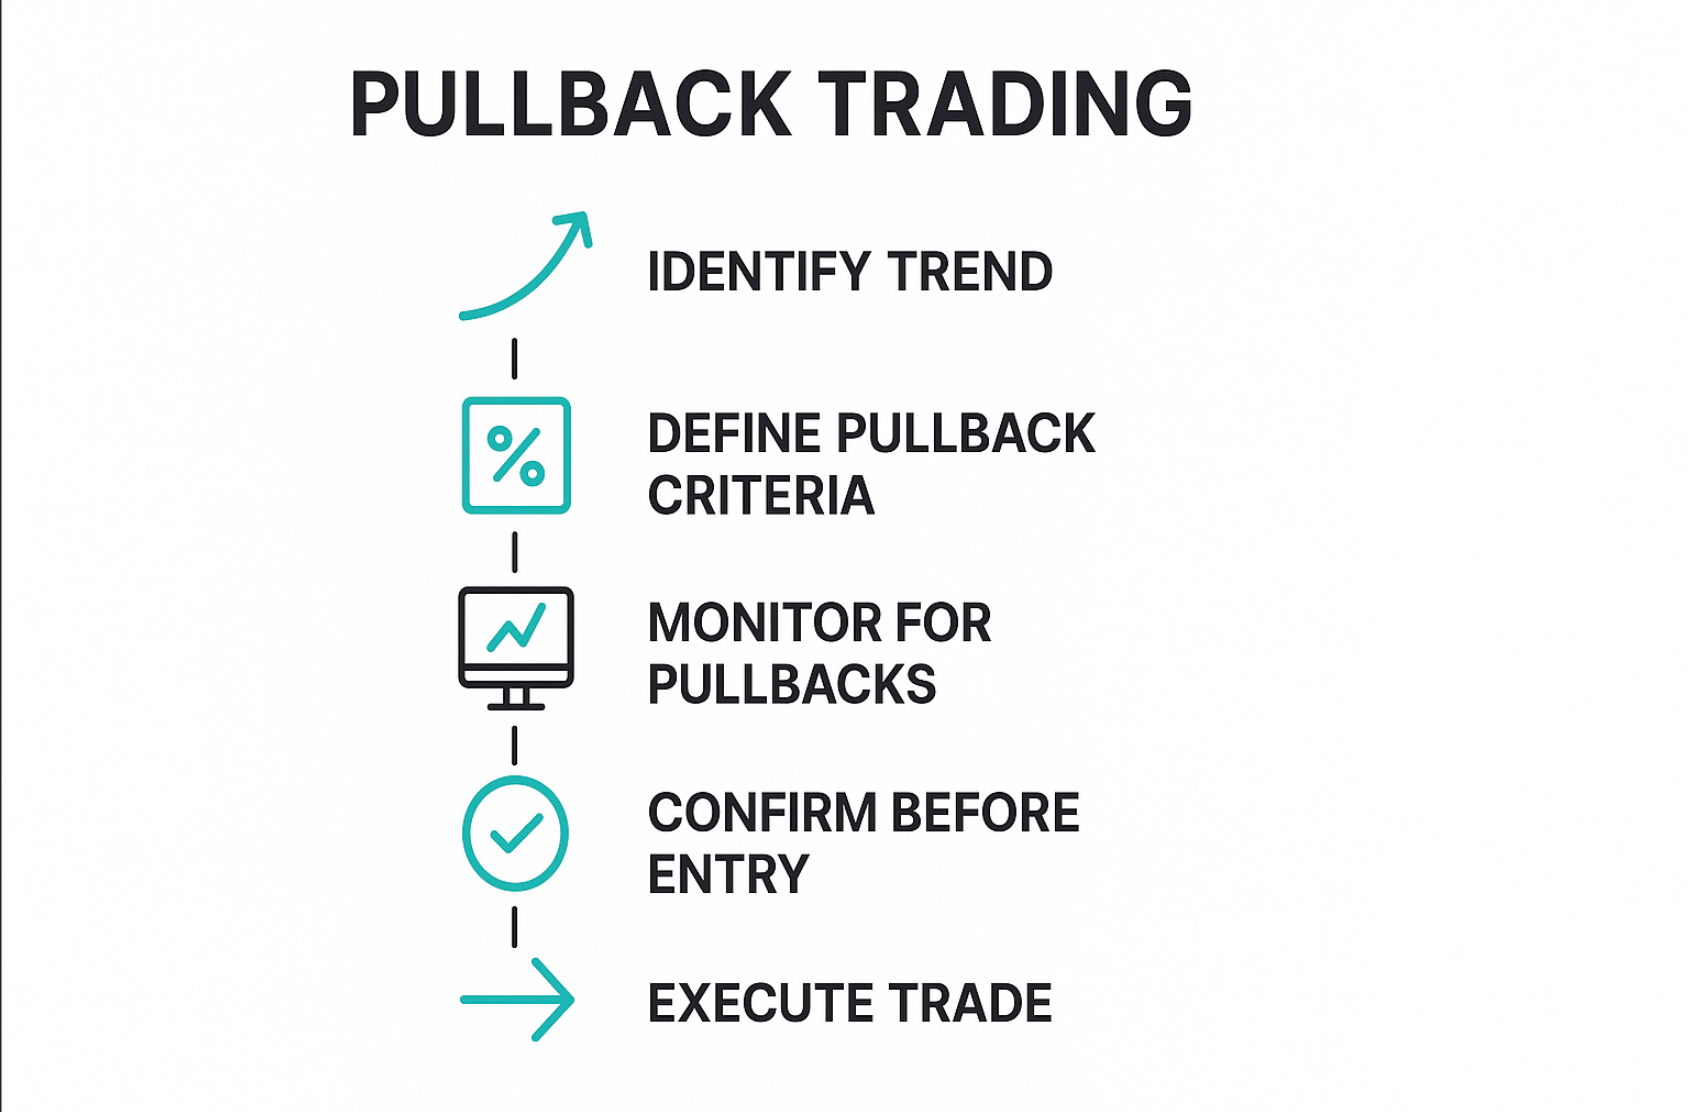
Identify the Trend
Use tools like moving averages, trendlines, or price structure to confirm whether the market is in a clear uptrend or downtrend.
Define Pullback Criteria
Set specific parameters for what qualifies as a pullback, such as a percentage retracement (e.g., 38–50%) or a move toward a key support/resistance zone.
Monitor for Pullbacks
Actively watch the chart for price movements that align with your defined pullback criteria, avoiding impulsive entries.
Confirm Before Entry
Use technical indicators like RSI, MACD, or candlestick reversal patterns like the hammer candlestick pattern and other engulfing patterns to confirm that the pullback is ending.
Execute the Trade
Once confirmation is in place, enter the trade in the direction of the original trend with a pre-defined stop-loss and target.
Advantages of Pullback Trading
Pullback trading is widely preferred among trend-followers because it provides more structured and strategic trade entries:
Better Entry Prices
Traders can enter the market at a lower price within an uptrend or a higher price within a downtrend, avoiding the risk of chasing the move.
Lower Risk Exposure
Pullbacks allow for tighter stop-loss placement near support or resistance zones, helping minimise potential losses.
Stronger Reward-to-Risk Ratio
Since entries are made after a temporary correction, the remaining trend move can yield higher gains relative to risk.
Reduces Emotional Trading
The strategy encourages patience and confirmation instead of taking random entries based on fear of missing out.
Momentum Continuation Advantage
In a strong trend, pullbacks often lead to renewed momentum, giving traders confidence in the trade direction.
Limitations of Pullback Trading
While pullback trading can be effective, it comes with challenges that traders must be cautious about:
No Guarantee of Pullback
Strong trends may continue without any correction, causing traders to miss potential opportunities.
Risk of Trend Reversal
A pullback may signal the beginning of a deeper reversal, creating false confidence and resulting in losses.
Requires High Discipline
Traders must wait for clear setups, which can be mentally challenging during volatile market movements.
Difficult Pattern Identification
Distinguishing a valid pullback from a trend breakdown requires experience, timing, and technical knowledge.
Not Suitable in Range-Bound Markets
When the market lacks clear direction, pullbacks become unreliable and lead to frequent stop-outs.
Pullback Trading Strategies
Here are some commonly used approaches traders follow during pullbacks:
Moving Average Pullback Strategy
Traders wait for the price to retrace to key moving averages like the 20 EMA or 50 SMA before entering trades in the direction of the trend.
Learn how Exponential Moving Averages (EMA) and Simple Moving Averages (SMA) help traders identify market trends and price momentum.
Fibonacci Retracement Pullback Strategy
Traders use Fibonacci Retracement levels such as 38.2%, 50%, and 61.8% to identify potential pullback entry points within an ongoing market trend.
Support and Resistance Pullback Strategy
Traders buy near previous support levels or sell near previous resistance levels once a pullback shows signs of reversal.
Trendline Pullback Strategy
Price correction toward a drawn trendline acts as an opportunity to enter in the direction of the main trend.
Breakout-Retest Pullback Strategy
After a breakout, traders wait for the price to retest the breakout level before entering a continuation trade.
Risk Management in Pullback Trading
Even with a strong setup, pullback trading can fail without proper risk control. Managing risk ensures that one bad trade doesn’t wipe out the gains from several good ones. Here are the key principles to follow:
Stop-Loss Orders
Always place a stop-loss just below the nearest support in an uptrend or above resistance in a downtrend. This protects you from larger losses if the pullback turns into a reversal.
Position Sizing
Proper position sizing helps traders manage risk by limiting each trade to a small portion of their total capital, usually around 1–2% of the trading account. This helps keep potential losses manageable, even during losing streaks.
Risk-Reward Ratio
Only take trades where the potential reward is at least double the risk. For example, if your stop-loss is ₹10, aim for a target of ₹20 or more. This helps maintain profitability over the long run, even with a lower win rate.
Conclusion
Pullback trading is a disciplined approach that leverages temporary market weakness within a strong trend. It’s not about chasing price or calling tops and bottoms, it’s about recognising opportunity where others see hesitation. By focusing on trend confirmation, volume analysis, and technical cues, traders can time entries with precision and reduced risk. The real edge in pullback trading lies in patience: waiting for the market to come to you, not forcing trades. When combined with strict risk controls and a clear exit plan, pullback trading can deliver asymmetric returns while keeping emotional decision-making out of the equation.
Frequently Asked Questions
What is a pullback in trading?
A pullback is a temporary price movement against the prevailing trend. In an uptrend, it’s a short dip; in a downtrend, it’s a brief rise, often seen as a pause before the trend resumes.
What is the pullback method?
The pullback method involves entering a trade during a short-term price dip (in an uptrend) or bounce (in a downtrend), after confirming that the main trend is still intact. Traders use this strategy to get better entry prices with reduced risk.
How do you identify pullbacks?
Pullbacks can be identified using trendlines, moving averages, or retracement levels like Fibonacci. Look for a pause or dip in price with lower volume, followed by technical confirmation (e.g., RSI bounce, reversal candle) that the trend is resuming.
| Related Topics | |
|---|---|
| Momentum Trading | Intraday Trading |
| Pivot Point | Scalping |
Disclaimer: This content is for educational purposes only and does not constitute financial or investment advice. Investments in securities or other financial instruments are subject to market risk, including partial or total loss of capital. Past performance is not indicative of future results. Always consider your financial situation carefully and consult a licensed financial advisor before making investment or trading decisions.
Engineered for the obsessed. Built for traders.

Purpose-built terminals.
Zero compromise.
Built for speed.
Plot No 1290, 2nd Floor, 17th Cross, 5th Main, Sector-7, HSR Layout, Bangalore 560102
Follow us on
Mintcap Brokers Private Limited
CIN – U66110KA2023PTC178706 | Registered Address: Plot No 1290, Second Floor, 17th Cross, 5th Main, Sector-7, HSR Layout, Bangalore 560102 | Tel: 080 – 49552310 | Email ID: compliance@capmint.com | SEBI registered Stock Broker: INZ000322732 | NSE Cash/F&O Member ID: 90430 | BSE Cash/F&O Member ID: 6903 | MCX Member ID: 57400 | NCDEX Member ID: 1312 | SEBI registered Depository Participant: IN-DP-806-2025 | CDSL DP ID: 12102300 | NSE Clearing Member code: M70108 | AMFI-Registered Mutual Fund Distributor: ARN-289109 (Valid upto 28-Feb-2027) | Category II Execution Only Platform : E6903
Details of Client Bank Account
Compliance Officer: Ms. Shridevi Vungarala | Email ID: compliance@capmint.com | Tel no. + 91 9035330126 | Grievance Redressal Officer (GRO) – Ms. Shikha Gupta | Email ID: Grievance@capmint.com | Tel no: 9035331595.
Procedure to file a complaint on SEBI SCORES: Register on SCORES portal. Mandatory details for filing complaints on SCORES: Name, PAN, Address, Mobile Number, E-mail ID. Benefits: Effective Communication, Speedy redressal of the grievances. You may refer the website https://scores.sebi.gov.in/ for more information. You may also download the SEBI Scores app to log a complaint Android: https://play.google.com > store > apps > sebiscores iOS: https://apps.apple.com > app > sebiscores
Disclaimer
Investment in the securities market are subject to market risks, read all the related documents carefully before investing. Brokerage will not exceed the SEBI prescribed limit.
Mutual fund investments are subject to market risks, read all scheme related documents carefully before investing. Mutual Funds are not exchange-traded products.
Attention Investor:
- Stock Brokers can accept securities as margin from clients only by way of pledge in the depository system w.e.f. September 1, 2020.
- Update your mobile number & email Id with your stock broker/depository participant and receive OTP directly from depository on your email id and/or mobile number to create pledge.
- Pay 20% as upfront margin of the transaction value to trade in cash market segment.
- Investors may please refer to the Exchange’s Frequently Asked Questions (FAQs) issued vide circular reference NSE/INSP/45191 dated July 31, 2020 and NSE/INSP/45534 dated August 31, 2020 and other guidelines issued from time to time in this regard.
- Check your Securities /MF/ Bonds in the consolidated account statement issued by NSDL/CDSL every month.