
Link copied!
Relative Strength Index (RSI)
RSI is a tool that shows whether a stock is overbought or oversold. It gives a score between 0 and 100. If it’s above 70, the stock may be overbought; if it’s below 30, it may be oversold.
Key Takeaways
- RSI helps spot when a stock is overbought or oversold
RSI (Relative Strength Index) gives a value between 0 and 100. If it’s above 70, the stock may be overbought. If it’s below 30, it might be oversold. This helps traders decide when to buy or sell. - It works best in sideways markets.
RSI is most useful when prices are not trending strongly. It helps identify possible turning points when prices have been going up or down too much for too long. - Simple to use with basic rules: Traders buy when RSI rises above 30 and sell when it drops below 70. It becomes more powerful when used with other tools like candlestick patterns or MACD for confirmation.
What is RSI- Relative Strength Index?
The Relative Strength Index (RSI), created by J. Welles Wilder, is a momentum-based indicator used to detect overbought and oversold conditions in the market. It helps traders anticipate possible trend reversals by analysing recent price movements. RSI values range from 0 to 100, and the current reading provides insight into potential market direction.
RSI is particularly useful when stocks are moving within a sideways or range-bound market. Since stock markets often lack strong trends, identifying potential reversal zones becomes essential, making RSI a valuable tool during such phases.
RSI Calculation with Formula
The calculation of RSI is based on the following formula:
Formula for RSI
RSI = 100 – [100 / (1 + Average Gain / Average Loss)]
Example of RSI Calculation
Let’s calculate with an example to help us better understand.
|
Sl No |
Closing Price |
Points Gain |
Points Lost |
|---|---|---|---|
|
1 |
120 |
0 |
0 |
|
2 |
123 |
3 |
0 |
|
3 |
119 |
0 |
4 |
|
4 |
122 |
3 |
0 |
|
5 |
121 |
0 |
1 |
|
6 |
124 |
3 |
0 |
|
7 |
122 |
0 |
2 |
|
8 |
125 |
3 |
0 |
|
9 |
128 |
3 |
0 |
|
10 |
127 |
0 |
1 |
|
11 |
126 |
0 |
1 |
|
12 |
130 |
4 |
0 |
|
13 |
132 |
2 |
0 |
|
14 |
135 |
3 |
0 |
In the table above, the points gained or lost refer to the difference between today’s closing price and the previous day’s close. For example, if today’s close is 104 and yesterday’s was 100, the gain is 4, and the loss is 0. On the other hand, if today’s close is 104 and yesterday’s was 107, the gain is 0, and the loss is 3. Note that losses are treated as positive values for calculation purposes.
For this calculation, we’ve used 14 data points, which is the standard default period known as the ‘look-back period.’ This means 14 days for daily charts or 14 hours for hourly charts. The first key step in calculating RSI is finding the RS (Relative Strength), which is the ratio of the average gains to the average losses over this period.
Average points gained = 24/14
Average points loss = 10/14
relative strength (RS) = 1.714/0.643 = 2.667
Plugging in the value of RS into the RSI formula:
RSI = 100 – 100/1+2.667
RSI = 100 – 100/3.67
RSI = 100-27.7273
RSI = 72.727
The overbought region occurs when the RSI shows significant buying pressure compared to recent trends. This often signals that the upward momentum may soon slow down. Conversely, the oversold region indicates intense selling pressure, suggesting that the downward trend might be nearing its end.
How To Trade the Relative Strength Index?
Trading with the relative strength index (RSI) is straightforward. The RSI ranges from 0 to 100, and technical analysts typically use the 30 and 70 levels as thresholds for generating buy and sell signals.
- Buy signal: Go long when the RSI moves from below to above the oversold line of 30.
- Sell signal: Go short when the RSI moves from above to below the overbought line of 70
On a trading terminal, RSI will look like this.
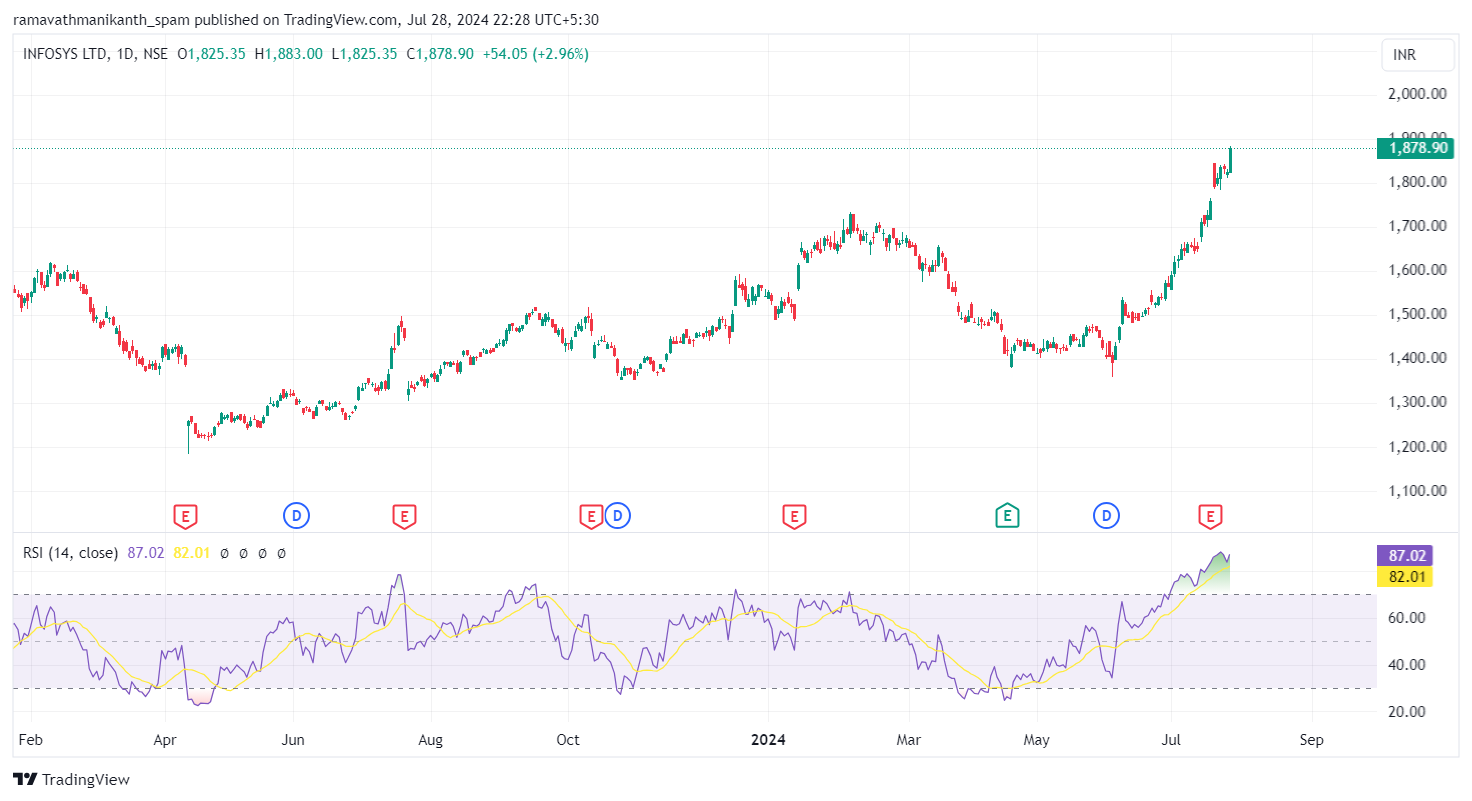
If Infosys has an RSI value nearing 90, it suggests the stock may be overbought. One should consider shorting opportunities, but it’s essential to confirm this with other analyses, like single or multiple candlestick patterns or other technical indicators.
Difference between RSI and MACD
MACD is one of the popular technical indicators; here is a table that shows the differences between them:
|
MACD |
RSI |
|---|---|
|
Shows trend direction and momentum |
Identifies overbought and oversold conditions |
|
Based on the difference between the two EMAs |
Based on average gains vs. losses over time |
|
Trending markets |
Sideways or range-bound markets |
|
Two lines + histogram |
Single line oscillating between 0 and 100 |
|
Crossovers with signal/zero line |
70 = Overbought, 30 = Oversold |
Conclusion
RSI is a simple yet powerful tool that helps traders identify overbought and oversold zones. It’s especially useful in sideways markets and can improve trading decisions when combined with other indicators. Understanding how to read RSI can give traders an edge in spotting potential trend reversals early.
Frequently Asked Questions on the RSI
What RSI is good to buy?
Traders often look for an RSI below 30 as a potential buying zone, as it suggests the stock may be oversold. However, it should always be confirmed with price action or other indicators.
Is RSI 100% accurate?
No. RSI is helpful, but it can give false signals during strong trends. It works best when combined with other tools rather than used alone.
Is high RSI bullish or bearish?
A high RSI (above 70) typically signals overbought conditions, which can mean the trend is strong but may be due for a pullback. It’s not automatically bearish; context matters.
How to analyse the RSI indicator?
Check whether RSI is above 70 (overbought) or below 30 (oversold), watch for divergences between price and RSI, and consider the strength of the trend before acting on any signal.
What is the best RSI setting?
The standard 14-period RSI is widely used and effective for most traders. Some short-term traders use 7 or 9 periods for faster signals, while long-term traders may prefer 21 periods for smoother readings.
Disclaimer: This content is for educational purposes only and does not constitute financial or investment advice. Investments in securities or other financial instruments are subject to market risk, including partial or total loss of capital. Past performance is not indicative of future results. Always consider your financial situation carefully and consult a licensed financial advisor before making investment or trading decisions.
Engineered for the obsessed. Built for traders.

Purpose-built terminals.
Zero compromise.
Built for speed.
Plot No 1290, 2nd Floor, 17th Cross, 5th Main, Sector-7, HSR Layout, Bangalore 560102
Follow us on
Mintcap Brokers Private Limited
CIN – U66110KA2023PTC178706 | Registered Address: Plot No 1290, Second Floor, 17th Cross, 5th Main, Sector-7, HSR Layout, Bangalore 560102 | Tel: 080 – 49552310 | Email ID: compliance@capmint.com | SEBI registered Stock Broker: INZ000322732 | NSE Cash/F&O Member ID: 90430 | BSE Cash/F&O Member ID: 6903 | MCX Member ID: 57400 | NCDEX Member ID: 1312 | SEBI registered Depository Participant: IN-DP-806-2025 | CDSL DP ID: 12102300 | NSE Clearing Member code: M70108 | AMFI-Registered Mutual Fund Distributor: ARN-289109 (Valid upto 28-Feb-2027) | Category II Execution Only Platform : E6903
Details of Client Bank Account
Compliance Officer: Ms. Shridevi Vungarala | Email ID: compliance@capmint.com | Tel no. + 91 9035330126 | Grievance Redressal Officer (GRO) – Ms. Shikha Gupta | Email ID: Grievance@capmint.com | Tel no: 9035331595.
Procedure to file a complaint on SEBI SCORES: Register on SCORES portal. Mandatory details for filing complaints on SCORES: Name, PAN, Address, Mobile Number, E-mail ID. Benefits: Effective Communication, Speedy redressal of the grievances. You may refer the website https://scores.sebi.gov.in/ for more information. You may also download the SEBI Scores app to log a complaint Android: https://play.google.com > store > apps > sebiscores iOS: https://apps.apple.com > app > sebiscores
Disclaimer
Investment in the securities market are subject to market risks, read all the related documents carefully before investing. Brokerage will not exceed the SEBI prescribed limit.
Mutual fund investments are subject to market risks, read all scheme related documents carefully before investing. Mutual Funds are not exchange-traded products.
Attention Investor:
- Stock Brokers can accept securities as margin from clients only by way of pledge in the depository system w.e.f. September 1, 2020.
- Update your mobile number & email Id with your stock broker/depository participant and receive OTP directly from depository on your email id and/or mobile number to create pledge.
- Pay 20% as upfront margin of the transaction value to trade in cash market segment.
- Investors may please refer to the Exchange’s Frequently Asked Questions (FAQs) issued vide circular reference NSE/INSP/45191 dated July 31, 2020 and NSE/INSP/45534 dated August 31, 2020 and other guidelines issued from time to time in this regard.
- Check your Securities /MF/ Bonds in the consolidated account statement issued by NSDL/CDSL every month.