
Link copied!
On-Balance Volume (OBV)
On-Balance Volume (OBV) is a simple indicator that shows whether more people are buying or selling a stock by adding volume on up days and subtracting it on down days. If OBV goes up, buyers are in control; if it goes down, sellers are stronger.
Key Takeaways
- OBV helps track whether buying or selling pressure is increasing by using volume and price direction.
- Volume usually moves before price, so OBV can signal upcoming trend changes early.
- When OBV rises or falls with price, it confirms the trend; when it moves differently, it warns of a reversal.
- OBV works better when combined with other technical indicators to avoid false signals.
What is an OBV Indicator?
On-Balance Volume (OBV) was created to help traders see the hidden “money flow” behind price movements, meaning whether big investors are buying or selling without it being obvious in the price yet. It measures buying and selling pressure by tracking volume: it adds the day’s volume when the price closes higher and subtracts it when the price closes lower.
Over time, this running total shows whether demand (buying) or supply (selling) is building up. A rising OBV means intense buying pressure, even if the price hasn’t moved much yet. A falling OBV signals that sellers are gaining control, which could lead to price drops. Traders often use OBV to confirm trends, spot divergences, and predict possible reversals early.
How OBV Is Calculated?
OBV has three different values depending on the opening and closing prices. OBV is designed to measure whether buyers or sellers are in control based on price movement direction and trading volume.
- If today’s closing price > yesterday’s closing price: OBV = Previous OBV + Today’s Volume
- If today’s closing price < yesterday’s closing price: OBV = Previous OBV – Today’s Volume
- If today’s closing price = yesterday’s closing price: OBV = Previous OBV (no change)
Why is OBV Important?
On-Balance Volume (OBV) is important because it works on the idea that “volume precedes price.” This means changes in trading volume often happen before actual price movements. Big investors usually start buying or selling quietly before a major move, and OBV helps spot this hidden activity. By tracking whether volume is flowing in or out of a stock, OBV can give early signals about trend strength or possible reversals even before the price shows it clearly.
When OBV rises while the price is flat or moving slowly upward, it indicates strong buying pressure building up behind the scenes. When OBV falls during a flat or rising price, it warns that selling pressure is increasing quietly. This makes OBV a powerful tool to confirm trends, predict breakouts, and avoid getting trapped in weak rallies or false signals.
How to Read and Interpret OBV?
When OBV is rising, it means buying pressure is stronger, more volume is happening on up days, which usually supports a price move upward. A falling OBV means selling pressure is stronger, more volume is happening on down days, which often signals weakness and a possible price decline. Simply put, if OBV moves in the same direction as price, it confirms the strength of the trend.
For example, in the chart below, Nifty fell OBV and flat after that, and the Nifty price fell.
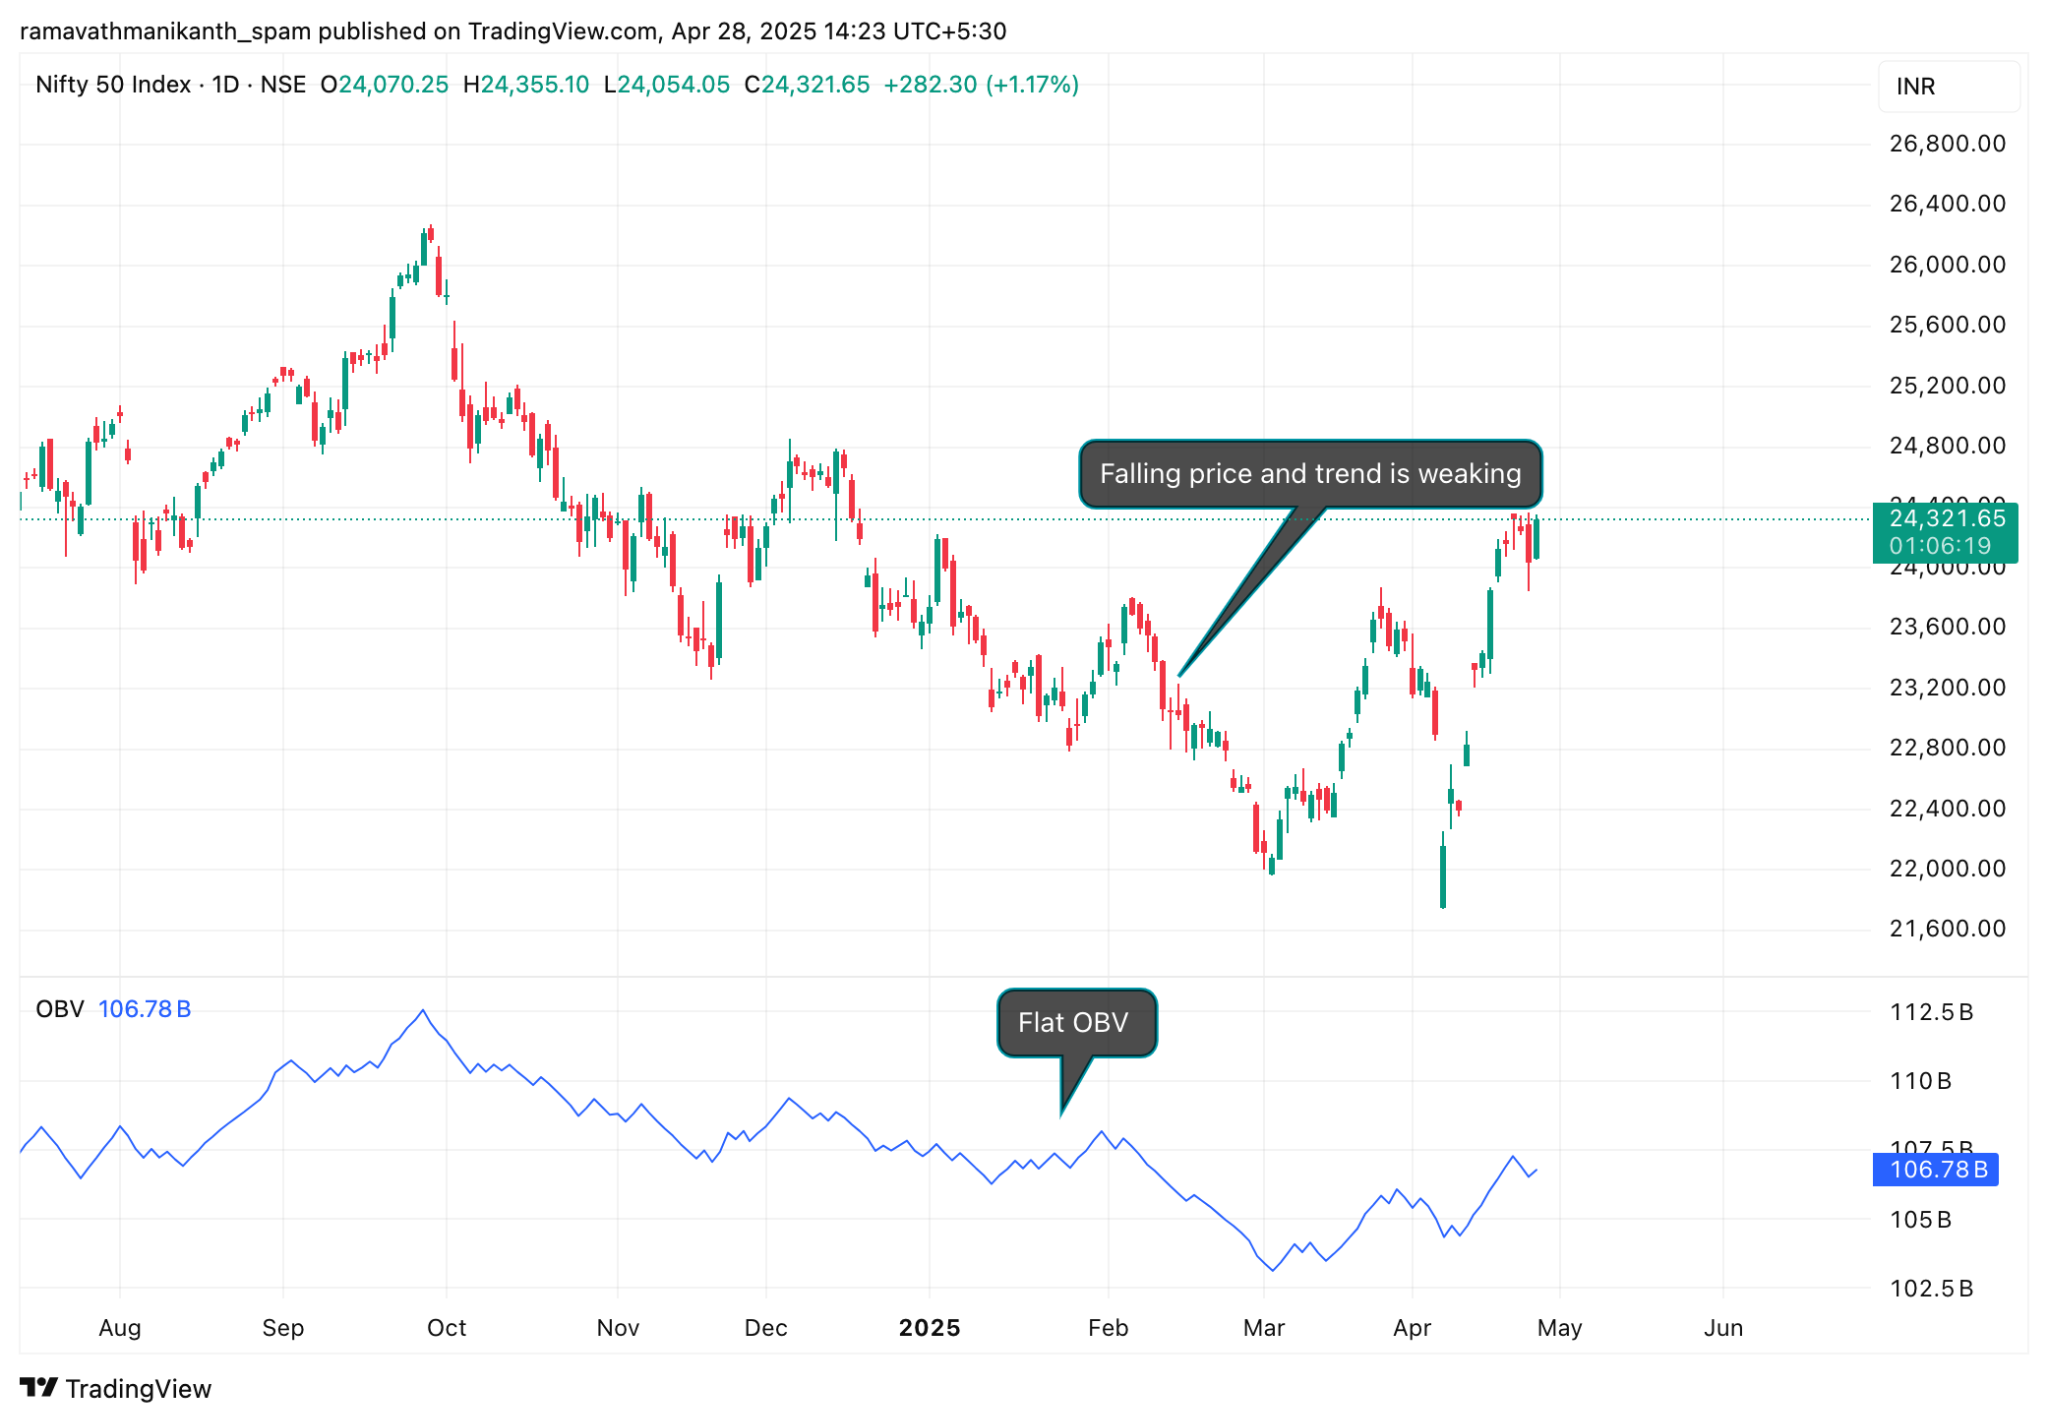
(Source: Nifty,28th April 25)
Divergences between OBV and price
If the price is making new highs but OBV isn’t following (or is falling), it suggests that the rally might be weak and could reverse. Similarly, if the price is falling but OBV is rising, it could hint that smart money is quietly buying, and a price recovery might happen soon. Traders observe these divergences to spot early signs of trend changes.
How to Use the OBV Indicator?
Now that we know what OBV tells us, let’s see how smart traders actually use it in real trades.
Trend Confirmation
Traders use OBV to confirm if a price trend is strong. If both the price and OBV are rising together, it supports a bullish trend. If both are falling, it confirms a bearish trend.
Read more about Trend Analysis.
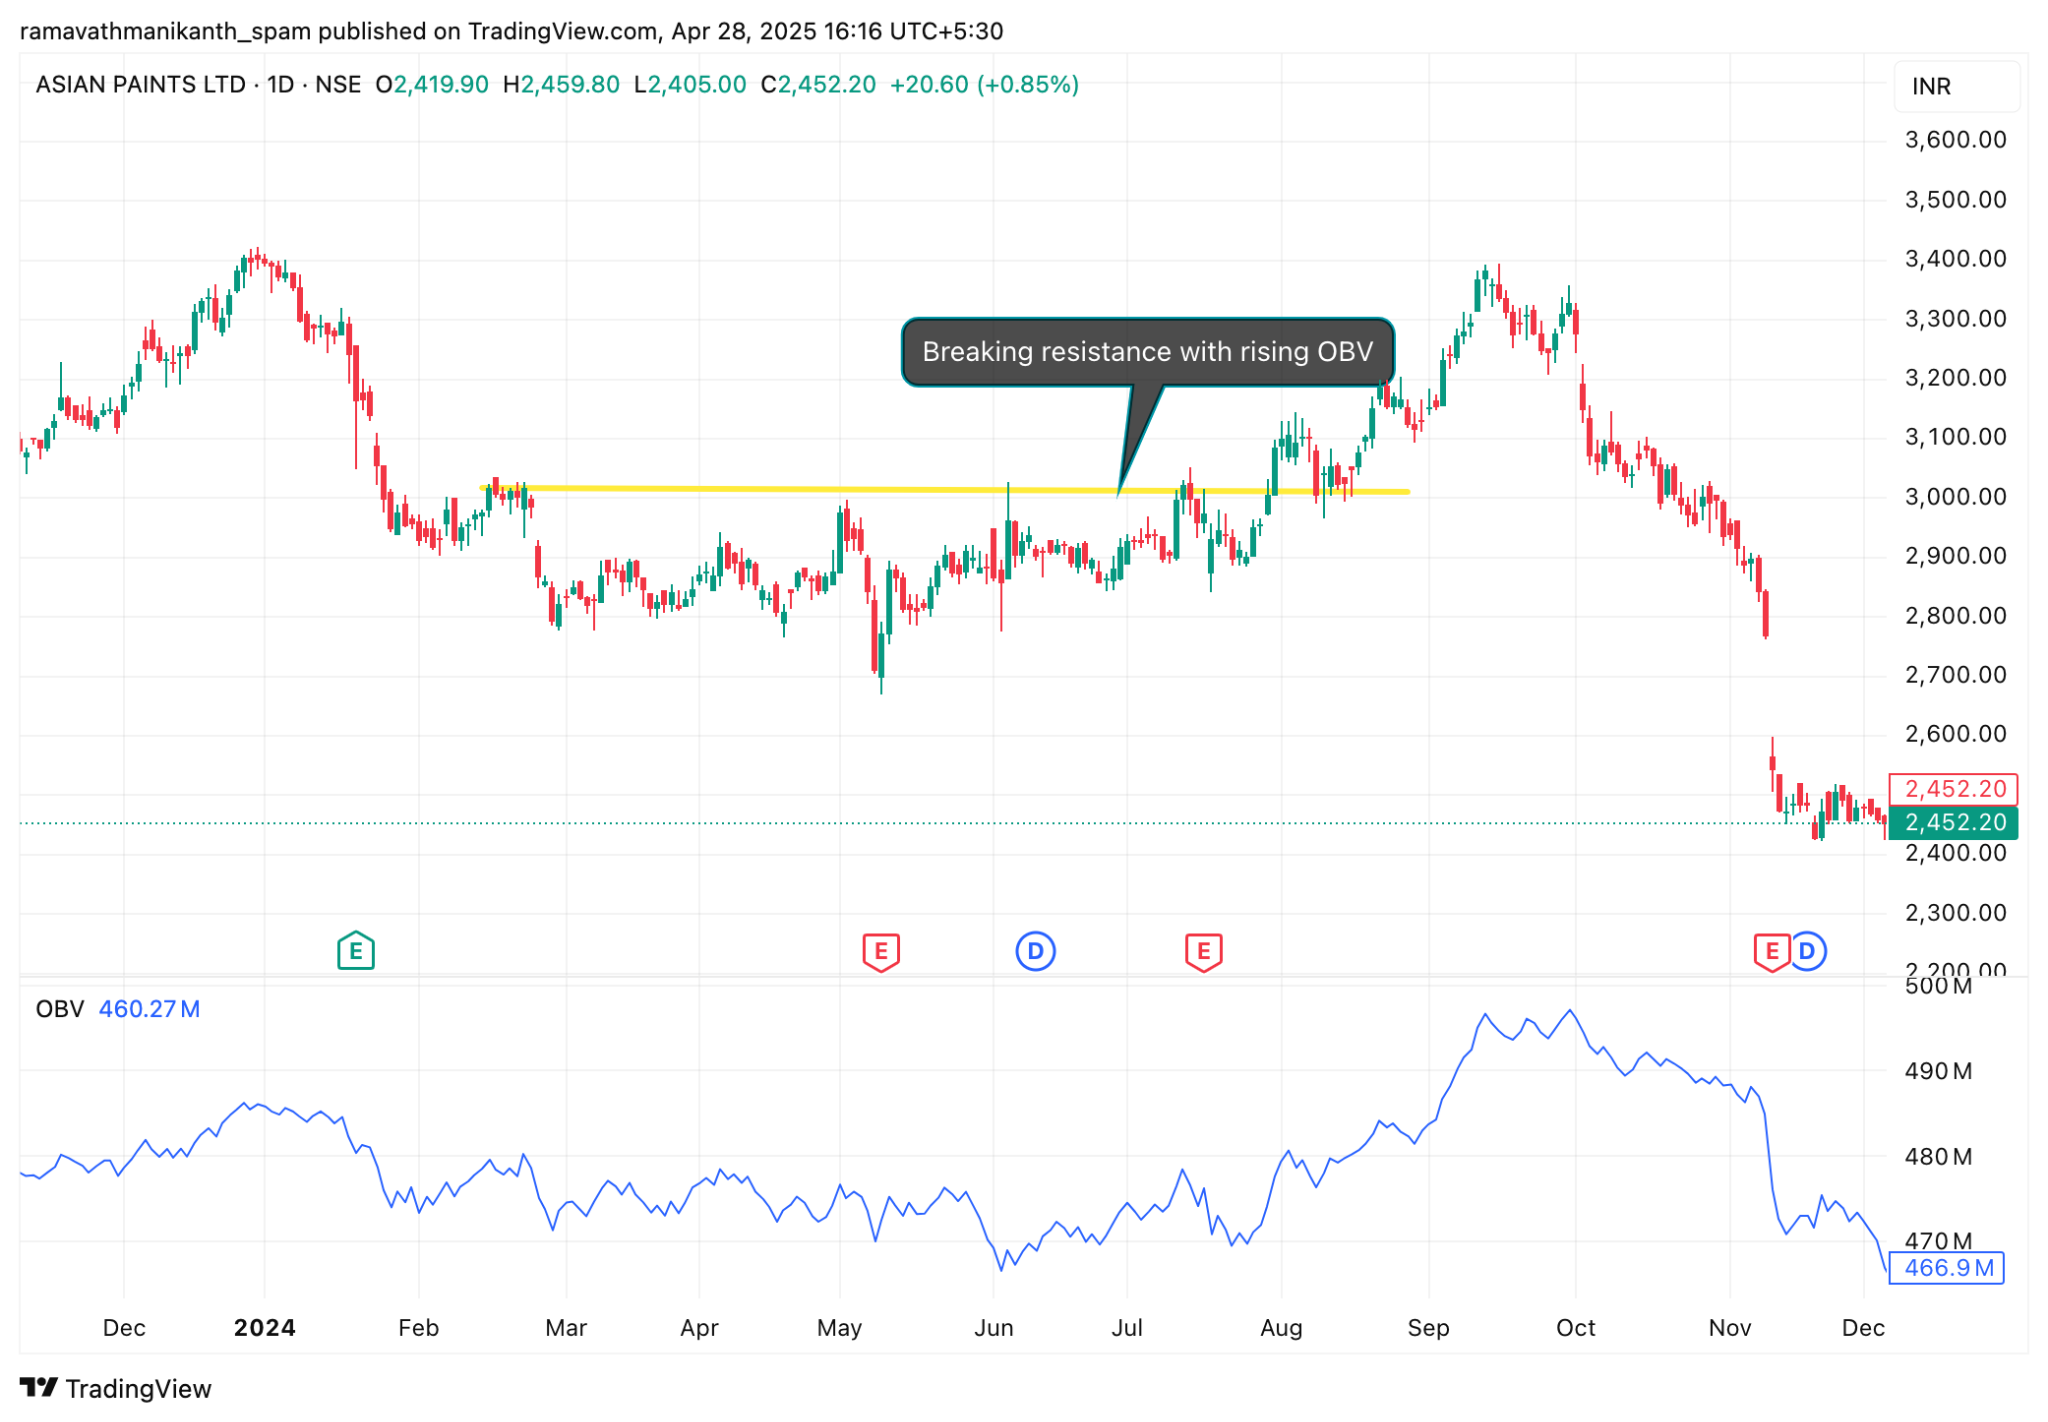
Breakout Validation
When a stock breaks out of a key level, a rising OBV helps validate that the breakout is backed by strong volume, making it more reliable.
For example, in the chart below of Asian Paints, it has broken resistance. With rising OBV, this stock has successfully rallied since then.
Strengths and Limitations Of OBV
Here are some strengths and weaknesses of OBV in a table:
|
Strengths of OBV |
Limitations of OBV |
|---|---|
|
Simplicity and Effectiveness: Easy to understand and use even for beginners; quickly shows buying or selling pressure without complicated formulas. |
False Signals in Sideways Markets: OBV can give misleading signals when the price is moving sideways without a clear trend. |
|
Reveals Institutional Activity: Helps spot whether big investors (smart money) are quietly buying or selling before major price moves. |
Needs Confirmation: OBV should be used along with other indicators (like Moving Averages,RSI, MACD) for more reliable decisions. |
Conclusion
On-Balance Volume (OBV) is a powerful yet simple tool that helps traders understand the real buying or selling pressure behind price movements. It uses volume and price direction to show whether demand or supply is increasing. While OBV can confirm trends and signal early warnings, it works best when combined with other indicators for stronger confirmation. Traders should also be careful in sideways markets where OBV can give false signals. Overall, learning how to read OBV properly can make trading decisions smarter and help identify stronger opportunities in the market.
Frequently Asked Questions
Is OBV a good indicator?
Yes, OBV is a good indicator for spotting real buying or selling pressure behind price moves.
It’s simple, easy to use, and can give early hints about trend strength or reversals. However, for the best results, it should be used along with other indicators.
What is the difference between VWAP and on-balance volume?
VWAP (Volume Weighted Average Price) shows the average price at which a stock is traded during the day, based on both volume and price.
OBV, on the other hand, tracks whether buying or selling pressure is building up over time by adding or subtracting volume based on price direction. Simply put, VWAP is about price levels, OBV is about volume trends.
How do you read OBV?
If OBV is rising, it shows strong buying pressure, supporting higher prices. If OBV is falling, it shows selling pressure and warns of possible price drops. Traders also watch for divergences between OBV and price to catch early signs of a trend reversal.
How to use OBV for intraday?
In intraday trading, use OBV to confirm breakouts and trend direction. If a stock breaks out with a rising OBV, the move is likely strong. Also, if OBV diverges from price during the day, it can signal a possible reversal. Always combine OBV with price action for better accuracy.
Disclaimer: This content is for educational purposes only and does not constitute financial or investment advice. Investments in securities or other financial instruments are subject to market risk, including partial or total loss of capital. Past performance is not indicative of future results. Always consider your financial situation carefully and consult a licensed financial advisor before making investment or trading decisions.
Engineered for the obsessed. Built for traders.

Purpose-built terminals.
Zero compromise.
Built for speed.
Plot No 1290, 2nd Floor, 17th Cross, 5th Main, Sector-7, HSR Layout, Bangalore 560102
Follow us on
Mintcap Brokers Private Limited
CIN – U66110KA2023PTC178706 | Registered Address: Plot No 1290, Second Floor, 17th Cross, 5th Main, Sector-7, HSR Layout, Bangalore 560102 | Tel: 080 – 49552310 | Email ID: compliance@capmint.com | SEBI registered Stock Broker: INZ000322732 | NSE Cash/F&O Member ID: 90430 | BSE Cash/F&O Member ID: 6903 | MCX Member ID: 57400 | NCDEX Member ID: 1312 | SEBI registered Depository Participant: IN-DP-806-2025 | CDSL DP ID: 12102300 | NSE Clearing Member code: M70108 | AMFI-Registered Mutual Fund Distributor: ARN-289109 (Valid upto 28-Feb-2027) | Category II Execution Only Platform : E6903
Details of Client Bank Account
Compliance Officer: Ms. Shridevi Vungarala | Email ID: compliance@capmint.com | Tel no. + 91 9035330126 | Grievance Redressal Officer (GRO) – Ms. Shikha Gupta | Email ID: Grievance@capmint.com | Tel no: 9035331595.
Procedure to file a complaint on SEBI SCORES: Register on SCORES portal. Mandatory details for filing complaints on SCORES: Name, PAN, Address, Mobile Number, E-mail ID. Benefits: Effective Communication, Speedy redressal of the grievances. You may refer the website https://scores.sebi.gov.in/ for more information. You may also download the SEBI Scores app to log a complaint Android: https://play.google.com > store > apps > sebiscores iOS: https://apps.apple.com > app > sebiscores
Disclaimer
Investment in the securities market are subject to market risks, read all the related documents carefully before investing. Brokerage will not exceed the SEBI prescribed limit.
Mutual fund investments are subject to market risks, read all scheme related documents carefully before investing. Mutual Funds are not exchange-traded products.
Attention Investor:
- Stock Brokers can accept securities as margin from clients only by way of pledge in the depository system w.e.f. September 1, 2020.
- Update your mobile number & email Id with your stock broker/depository participant and receive OTP directly from depository on your email id and/or mobile number to create pledge.
- Pay 20% as upfront margin of the transaction value to trade in cash market segment.
- Investors may please refer to the Exchange’s Frequently Asked Questions (FAQs) issued vide circular reference NSE/INSP/45191 dated July 31, 2020 and NSE/INSP/45534 dated August 31, 2020 and other guidelines issued from time to time in this regard.
- Check your Securities /MF/ Bonds in the consolidated account statement issued by NSDL/CDSL every month.