
Link copied!
Supertrend Indicator
Supertrend is a technical indicator used to identify the direction of the market and signal buy or sell opportunities. It moves along with the price and is based on two things: the Average True Range (ATR) and a multiplier.
Key Takeaways
- Supertrend is a technical indicator that helps traders find the direction of the market and gives buy or sell signals based on price movement.
- It uses two main things for calculation: the Average True Range (ATR), which shows how much the price moves, and a multiplier, which controls how sensitive the signals are.
- The indicator works best in trending markets, where prices move strongly in one direction, and gives clear entry and exit signals by changing colour.
- Supertrend is easy to use and useful for intraday or short-term trading, but it can give false signals in sideways markets, so it’s better to use it with other tools.
What is a Supertrend Indicator?
Supertrend is a technical analysis indicator that helps traders identify market trends. The Supertrend Indicator combines the Average True Range (ATR) with a multiplier to calculate its value. It uses the above two as inputs for its calculation.
Formula to Calculate Supertrend Indicator
The formula for the super trend indicator
Supertrend = (High+Low)/2 + (Multiplier) × (ATR)
Components:
ATR, or the Average True Range
It measures an asset’s average price movement over a period, indicating its volatility. It helps super trend indicators, enhancing their sensitivity and accuracy in detecting trends.
The formula for ATR is ATR = [(Prior ATR x 13) + Current TR] / 14
Multiplier
It is a constant value that traders and investors employ to push the indicator to be more or less sensitive to price movements.
We can also see a period as an input in the super trend indicator, which is used to calculate ATR, affecting its sensitivity and signal frequency. Short periods increase sensitivity and signals; more extended periods provide fewer but more reliable signals.
How to Use Supertrend Indicators?
We can find super-trend indicators in any trading terminal. In the indicators section, if we apply it to our chart, it looks like the chart below.
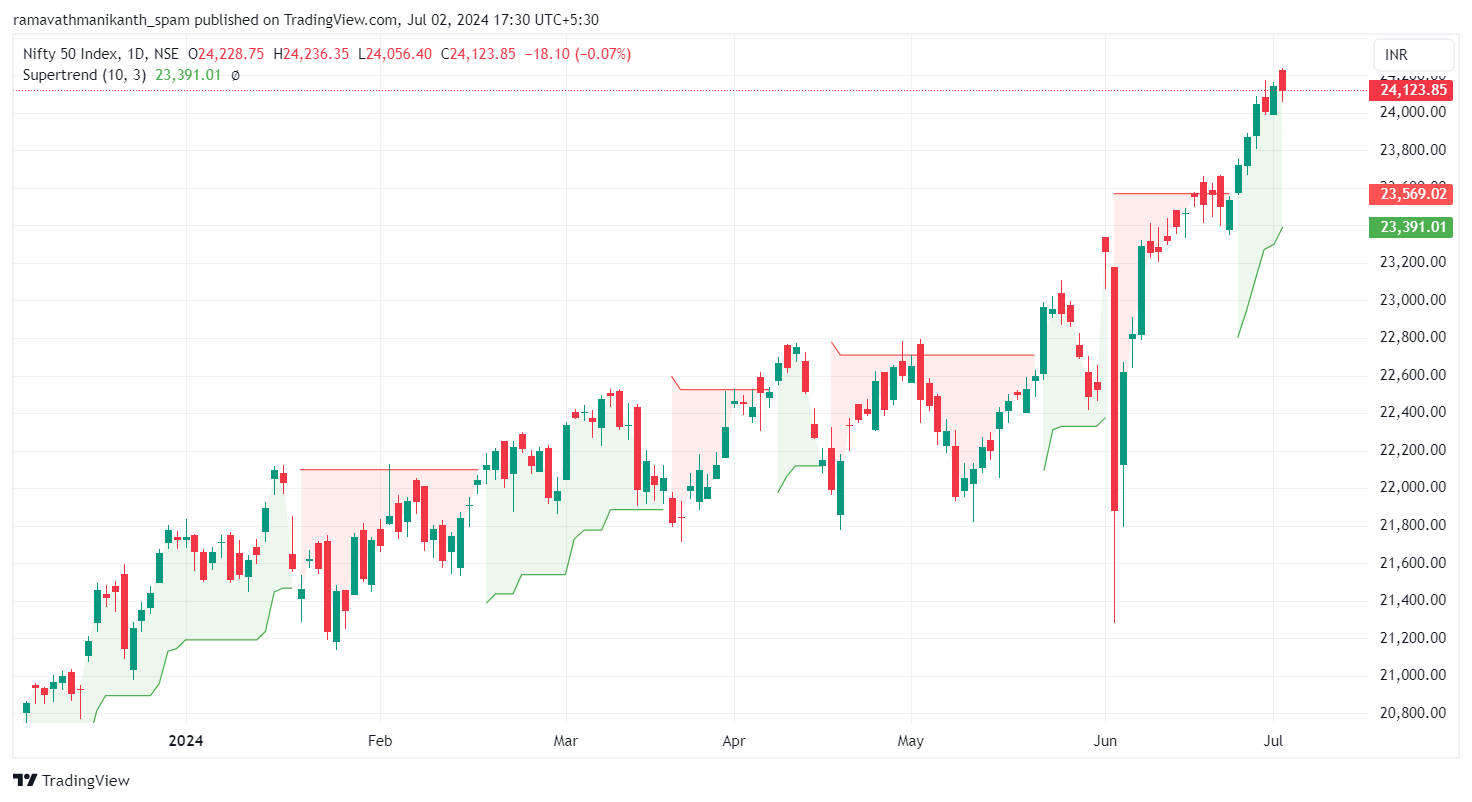
We can see in the above chart that there are lines just below the candlesticks. We can find the buying and selling signals with the help of a super trend indicator.
- When the super trend goes below the closing price, it is green in colour, indicating a bullish trend; we can go long on the position.
- When the Supertrend goes above the closing price, it is red, indicating a bearish trend; we can go short on the position.
Use the Supertrend indicator during solid uptrends or downtrends to effectively identify market trends and make informed trading decisions. The super trend indicator is not suitable for sideways markets because price trades in a narrow range and can generate false signals or “whipsaws” in sideways or choppy markets, leading to potential losses.
Super trend is best suited for day trading because it provides timely entry and exit signals. This is crucial for intraday traders who need to make quick decisions to capitalise on short-term market movements. It also helps identify the prevailing market trend.
Entry for the long position
- When the super trend indicator turns green, buy the stock at its closing price of that particular day.
- Keeping the line of the super trend as the stop loss, and as the price moves, the super trend line adjusts accordingly.
- If the super trend line turns from green to red, it may be considered a signal to exit the extended position.
Entry for the short position
- When the Supertrend indicator turns red, sell the stock at the opening price of that particular day.
- Set the stop loss at the Supertrend line, and as the price moves, the Supertrend line adjusts accordingly.
- If the super trend line turns from green to red, it may be considered a signal to exit the extended position.
Significance Of the Supertrend Indicator
Having understood the basics of the Supertrend indicator, it’s important to explore its practical relevance in trading. The following points highlight why this indicator is widely used and how it can support more informed trading decisions.
Effective in Trending Markets
Supertrend performs best in markets that have clear upward or downward momentum, helping traders stay in the trend longer and avoid premature exits. It minimises the noise from short-term fluctuations and keeps you focused on the broader direction. This makes it especially useful for swing and positional traders who want to ride trends with more confidence.
Volatility-Based Filtering
Since it uses the Average True Range (ATR), Supertrend adjusts itself based on market volatility. This makes it more adaptive than fixed indicators and reduces the chances of reacting to minor price noise.
Reliable Entry and Exit Points
By generating buy signals when the price moves above the indicator and sell signals when it moves below, Supertrend offers clearly defined points for entering and exiting trades.
Importance of Supertrend Indicators
The Supertrend indicator plays an important role in helping traders understand market direction and make better trading decisions.
One of its biggest advantages is that it provides clear buy and sell signals, making it easy for traders to identify entry and exit points. When the indicator changes colour, it gives a straightforward signal without much confusion.
It also helps in following the trend. Instead of exiting too early, traders can stay in a trade as long as the trend continues, which improves the chances of capturing larger price moves.
Another key benefit is risk management. Since the Supertrend line can act as a dynamic stop-loss, it helps traders limit losses and protect profits as the price moves.
Limits of Supertrend Indicators
Not effective in sideways markets
Frequent trend changes can lead to multiple false signals and whipsaws.
Lagging in nature
Since it is based on past price and ATR, signals may come late during sudden market moves.
Depends on settings
An incorrect ATR period or multiplier can make the indicator too sensitive or too slow.
Can give false signals in volatile markets
Sharp price fluctuations may trigger misleading buy or sell signals.
Not reliable as a standalone tool
It should be used with other indicators or price action for better accuracy.
Conclusion
The Supertrend indicator is a simple yet powerful tool that helps traders understand market direction and make better decisions. It works well in trending markets by filtering out small, unnecessary price movements and showing clear buy or sell signals. Since it adjusts with volatility, it stays relevant in different market conditions. While it’s easy to use and beginner-friendly, it should not be used alone. Combining it with other indicators or patterns can improve its accuracy. Overall, supertrends are useful in any trading strategy, especially for those looking to trade with trends and manage risk effectively.
Frequently Asked Questions (FAQs)
How accurate is the Supertrend indicator?
Supertrend is fairly accurate in trending markets. It works well when the price is moving clearly in one direction. However, in sideways or choppy markets, it may give false signals. So, it’s best to use it with other tools like support-resistance or volume to improve accuracy.
What is 7 and 3 in Supertrend?
In Supertrend, 7 is the period used to calculate the ATR (Average True Range), and 3 is the multiplier. These values control how sensitive the indicator is. Smaller numbers give more signals but can be less reliable, while larger numbers give fewer but stronger signals.
How to use the Supertrend indicator?
Apply the Supertrend to your chart from the indicator section.
- When the line turns green and is below the price, it’s a buy signal.
- When the line turns red and is above the price, it’s a sell signal.
Use it mainly in trending markets and always add a stop-loss near the Supertrend line to manage risk.
How can you avoid false Signals with the Supertrend Indicator?
Avoid false signals by using Supertrend in trending markets and combining it with indicators like RSI, moving averages, or support and resistance. Also, use higher timeframes to reduce noise and avoid trading in sideways conditions.
What is the Best Technical Indicator to use with the Supertrend Indicator?
Indicators like RSI, moving averages, and ADX work well with Supertrend. RSI helps confirm momentum, moving averages confirm trend direction, and ADX shows trend strength. Combining them improves accuracy and reduces false signals.
Disclaimer: This content is for educational purposes only and does not constitute financial or investment advice. Investments in securities or other financial instruments are subject to market risk, including partial or total loss of capital. Past performance is not indicative of future results. Always consider your financial situation carefully and consult a licensed financial advisor before making investment or trading decisions.
Engineered for the obsessed. Built for traders.

Purpose-built terminals.
Zero compromise.
Built for speed.
Plot No 1290, 2nd Floor, 17th Cross, 5th Main, Sector-7, HSR Layout, Bangalore 560102
Follow us on
Mintcap Brokers Private Limited
CIN – U66110KA2023PTC178706 | Registered Address: Plot No 1290, Second Floor, 17th Cross, 5th Main, Sector-7, HSR Layout, Bangalore 560102 | Tel: 080 – 49552310 | Email ID: compliance@capmint.com | SEBI registered Stock Broker: INZ000322732 | NSE Cash/F&O Member ID: 90430 | BSE Cash/F&O Member ID: 6903 | MCX Member ID: 57400 | NCDEX Member ID: 1312 | SEBI registered Depository Participant: IN-DP-806-2025 | CDSL DP ID: 12102300 | NSE Clearing Member code: M70108 | AMFI-Registered Mutual Fund Distributor: ARN-289109 (Valid upto 28-Feb-2027) | Category II Execution Only Platform : E6903
Details of Client Bank Account
Compliance Officer: Ms. Shridevi Vungarala | Email ID: compliance@capmint.com | Tel no. + 91 9035330126 | Grievance Redressal Officer (GRO) – Ms. Shikha Gupta | Email ID: Grievance@capmint.com | Tel no: 9035331595.
Procedure to file a complaint on SEBI SCORES: Register on SCORES portal. Mandatory details for filing complaints on SCORES: Name, PAN, Address, Mobile Number, E-mail ID. Benefits: Effective Communication, Speedy redressal of the grievances. You may refer the website https://scores.sebi.gov.in/ for more information. You may also download the SEBI Scores app to log a complaint Android: https://play.google.com > store > apps > sebiscores iOS: https://apps.apple.com > app > sebiscores
Disclaimer
Investment in the securities market are subject to market risks, read all the related documents carefully before investing. Brokerage will not exceed the SEBI prescribed limit.
Mutual fund investments are subject to market risks, read all scheme related documents carefully before investing. Mutual Funds are not exchange-traded products.
Attention Investor:
- Stock Brokers can accept securities as margin from clients only by way of pledge in the depository system w.e.f. September 1, 2020.
- Update your mobile number & email Id with your stock broker/depository participant and receive OTP directly from depository on your email id and/or mobile number to create pledge.
- Pay 20% as upfront margin of the transaction value to trade in cash market segment.
- Investors may please refer to the Exchange’s Frequently Asked Questions (FAQs) issued vide circular reference NSE/INSP/45191 dated July 31, 2020 and NSE/INSP/45534 dated August 31, 2020 and other guidelines issued from time to time in this regard.
- Check your Securities /MF/ Bonds in the consolidated account statement issued by NSDL/CDSL every month.