
Table of Content
- Key Takeaways
- What Are Pivot Points in Trading?
- Calculation of Pivot Points
- Example of Pivot Point
- Types of Pivot Points
- Interpretation of Pivot Points
- Market Sentiment Based on Pivot Point
- Applications of Pivot Points in Trading
- Combining Pivot Points with Other Tools
- Limitations of Pivot Points
- Conclusion
- Frequently Asked Questions (FAQs)
Link copied!
Pivot Points
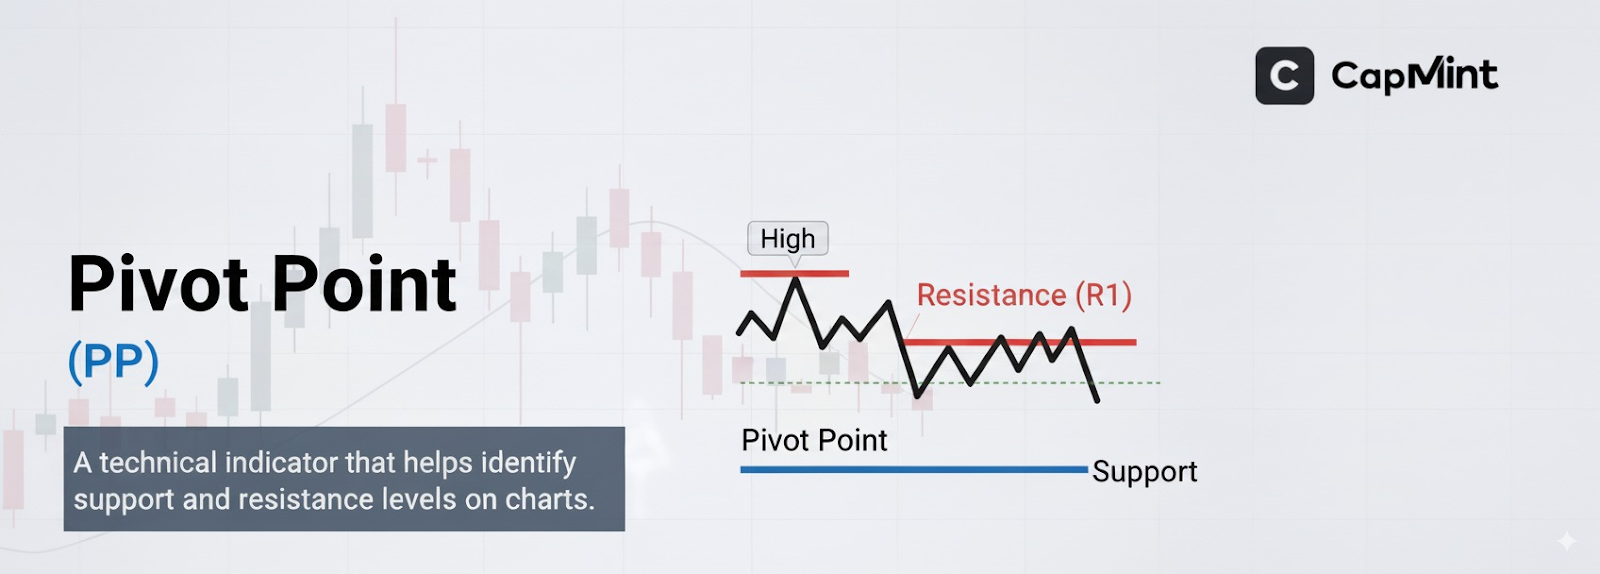
Pivot Point
The pivot point is a technical indicator that helps identify support and resistance levels on charts. They are calculated as the average of the high, low, and closing prices from the previous trading period.
Key Takeaways
- What is a Pivot Point: A pivot point is a technical tool that helps traders find possible support (price floor) and resistance (price ceiling) levels. It is calculated using the high, low, and closing prices of the previous day.
- How It Helps in Trading: Pivot points guide traders in identifying trend direction and planning entry, exit, and stop-loss levels more confidently during intraday trading.
- Understanding Market Sentiment: If the price stays above the pivot point, the market is likely in an uptrend (bullish). If it’s below, the trend may be downward (bearish).
- Know the Limitations: Pivot points are based on past data and stay fixed throughout the day. They work best in sideways markets but may not be reliable during big market moves or news events.
What Are Pivot Points in Trading?
Day traders and short-term investors mainly use pivot points to identify support and resistance levels in the market. They help determine the overall market trend over different time frames (daily, weekly, monthly). The pivot point acts as a reference level, meaning if the market price is trading above the pivot point, it’s generally seen as bullish (uptrend). If it’s below, it’s seen as bearish (downtrend).
One of the most valuable uses of pivot points in technical analysis is their ability to predict potential support and resistance levels. These are zones where the price is likely to pause, reverse, or break out. Traders use these levels to make fast, confident trading decisions without over-analysis. On Indian markets, pivot points are particularly popular among Bank Nifty and Nifty options traders, where the intraday session is short and having pre-calculated levels before the opening bell saves valuable decision-making time during fast-moving sessions.
Calculation of Pivot Points
For the calculation of pivot points, the High, Low, and Close of the previous candlestick are needed. The central pivot point is calculated first:
Pivot Point (PP) = (High + Low + Close) / 3
Using the pivot point, further levels of support and resistance are derived:
- First Resistance (R1) = (2 × PP) – Low
- First Support (S1) = (2 × PP) – High
- Second Resistance (R2) = PP + (High – Low)
- Second Support (S2) = PP – (High – Low)
Some traders also calculate a third level of support (S3) and resistance (R3) for days when volatility is expected to be higher than normal, such as budget day, RBI policy announcements, or monthly F&O expiry sessions. The formulas are:
- Third Resistance (R3) = High + 2 × (PP – Low)
- Third Support (S3) = Low – 2 × (High – PP)
These extended levels serve as outer boundaries and are reached less frequently, but they can be useful for setting wider stop-losses or identifying extreme intraday targets on unusually volatile days.
Example of Pivot Point
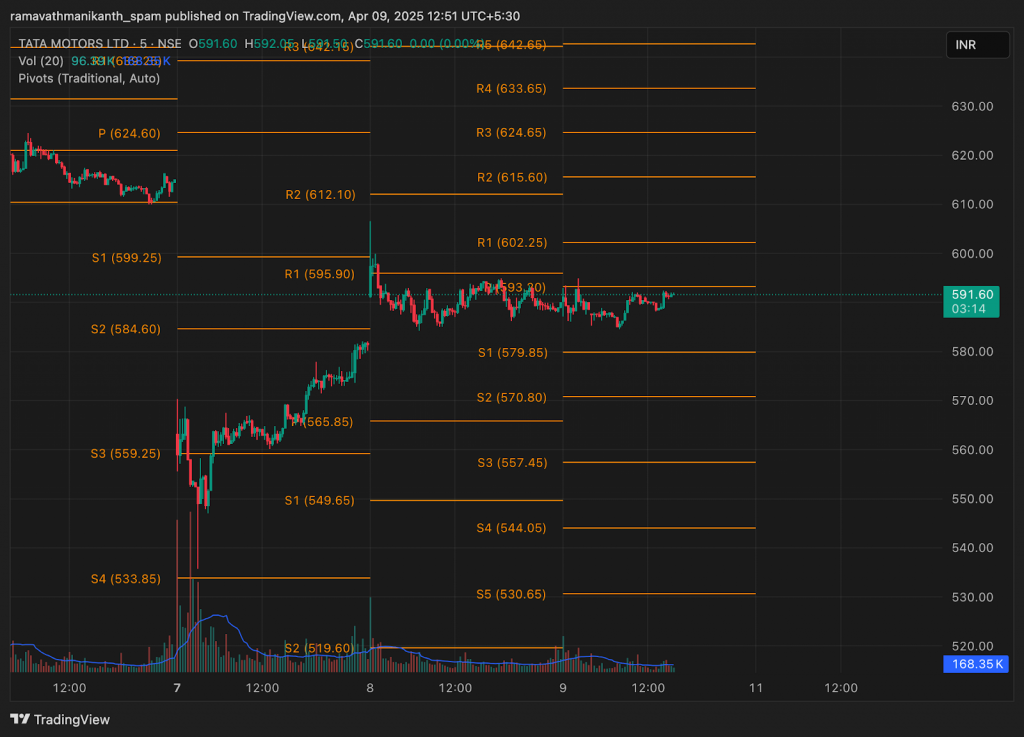
Let’s assume the following data from the previous trading day for Tata Motors:
- High = ₹950
- Low = ₹910
- Close = ₹930
Step 1: Calculate Pivot Point (PP)
PP = (High + Low + Close) / 3 PP = (950 + 910 + 930) / 3 = 2,790 / 3 = ₹930
Step 2: Calculate Support and Resistance Levels
- First Resistance (R1) = (2 × PP) − Low = (2 × 930) − 910 = ₹950
- First Support (S1) = (2 × PP) − High = (2 × 930) − 950 = ₹910
- Second Resistance (R2) = PP + (High − Low) = 930 + (950 − 910) = ₹970
- Second Support (S2) = PP − (High − Low) = 930 − (950 − 910) = ₹890
In this example, note that R1 (₹950) coincides with the previous day’s high and S1 (₹910) matches the previous day’s low. This is not a coincidence; it happens whenever the close falls exactly at the midpoint of the day’s range. When pivot levels align with the prior session’s high or low, those levels tend to carry additional significance because they represent a confluence of two independently derived reference points.
Types of Pivot Points
The standard pivot point formula described above is the most widely used, but there are several other calculation methods that traders should be aware of:
Woodie’s Pivot Points
This method gives more weight to the closing price by using the formula PP = (High + Low + 2 × Close) / 4. Because of the heavier emphasis on the close, Woodie’s pivot tends to shift closer to where the price ended the session, which some intraday traders find more responsive to recent sentiment.
Camarilla Pivot Points
Camarilla uses a set of four support and four resistance levels that are closer to the current price compared to standard pivots. The levels are derived using multipliers applied to the previous day’s range. These tighter levels are favoured by scalpers and very short-term traders who work with narrow targets of ₹5–15 on liquid stocks.
Fibonacci Pivot Points
This method applies Fibonacci retracement percentages (38.2%, 61.8%, and 100%) to the previous day’s range to derive support and resistance levels around the central pivot. Traders who already use Fibonacci retracements in their analysis often prefer this method for consistency across their technical framework.
Most trading platforms on Indian brokers like Zerodha, Groww, and Angel One allow users to switch between these pivot types in the chart settings. There is no universally “best” method; each suits a different trading style and timeframe preference.
Interpretation of Pivot Points
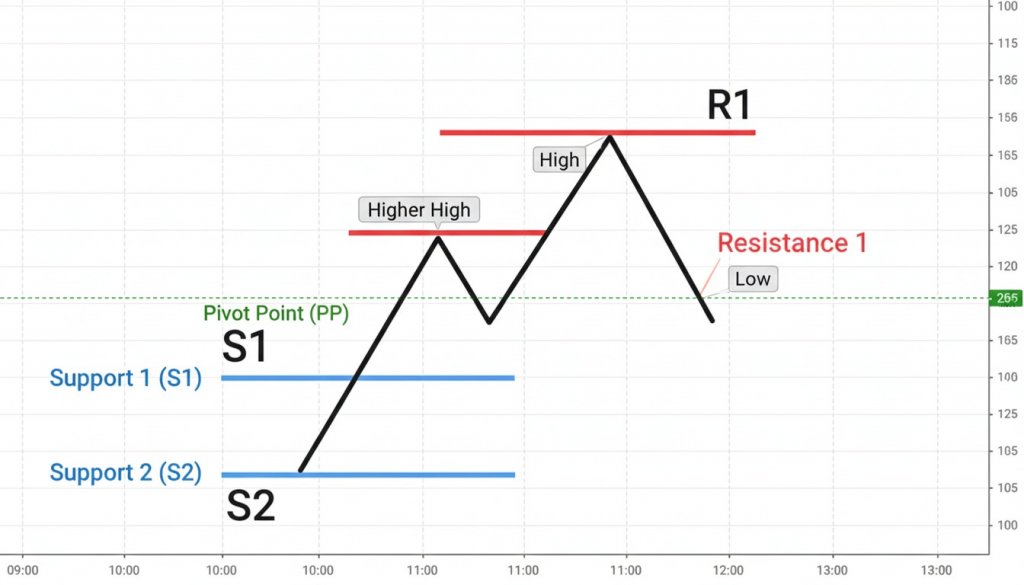
Pivot points mainly give us the resistance (R1, R2) and support levels (S1, S2) that can help us trade. Here is the interpretation of them:
Support Levels
S1 (First Support) is usually the closest support level below the pivot point. It indicates a mild or initial level of buying interest. If the price pulls back slightly, S1 is where traders expect it might bounce. On most normal trading days for Nifty 50 stocks, the price action tends to stay within the S1–R1 range, making these the most frequently tested levels.
S2 (Second Support) lies further below S1 and represents a stronger support level. If S1 is broken, S2 may act as the next significant area where buyers could step in with more conviction. A move from the pivot all the way to S2 within a single session typically indicates a day with above-average selling pressure, often triggered by negative news or broader market weakness.
Resistance Levels
R1 (First Resistance) is the nearest resistance level above the pivot point. It’s where traders often expect the price to face initial selling pressure or hesitation to go higher.
R2 (Second Resistance) is positioned higher than R1 and serves as a stronger resistance level. If the price breaks through R1, R2 becomes the next likely zone where more significant selling might occur. A clean break above R2 with strong volume usually signals a trending day where the stock may not respect the calculated levels as neatly, and traders should be prepared to manage their positions with trailing stops rather than fixed targets.
Market Sentiment Based on Pivot Point
Price above Pivot Point (P): Signals bullish momentum. Traders expect moves toward R1 and R2 and often look for long (buy) opportunities.
Price below Pivot Point (P): Signals bearish momentum. The market may head toward S1 and S2, where traders usually prefer short (sell) setups or avoid buying.
The first 15–20 minutes after market open are critical for establishing which side of the pivot the price settles on. A stock that opens above the pivot, dips to test it within the first few candles, and then bounces back above it provides a stronger bullish signal than one that simply gaps up and stays above the pivot without testing it. The test and hold behaviour demonstrates that buyers are actively defending that level.
Applications of Pivot Points in Trading
By knowing where the market stands in relation to the pivot point, traders get a quick idea of the trend direction, a crucial element in effective trend analysis. But how exactly can they use this in real trades?
Intraday Trading
Day traders use pivot points to identify intraday support and resistance and mark these points based on the market outlook. They make entries and exits on the stocks or index.
Suppose Tata Motors is trading near R1. If the stock breaks above R1 with good volume, a day trader may enter a buy position, expecting the price to move toward R2. In this case, R2 will be the target (exit point), and the pivot or S1 can be kept as a stop-loss. The trend here is considered bullish because the price is moving above the pivot point.
On the other hand, if Tata Motors falls below the pivot point and breaks S1, a trader may take a sell position expecting the stock to go down further toward S2. In this case, S2 will be the target (exit point), and the pivot or R1 can be kept as a stop-loss. This setup indicates a bearish trend.
One practical consideration: placing the stop-loss exactly at the pivot or support/resistance level often results in premature exits, since prices frequently touch these levels briefly before reversing. Adding a small buffer of ₹2–5 beyond the level, depending on the stock’s typical intraday range, helps avoid getting stopped out by normal price noise around these zones.
Stop-Loss and Take-Profit Levels
Pivot points act as reliable reference levels for managing risk. Traders often place stop-loss orders just below support levels like S1 or S2 to limit downside and set take-profit targets near resistance levels like R1 or R2 to lock in gains when the price moves in their favour.
Pivot Points Help in Trend Identification
When the price consistently trades above the pivot point across multiple sessions, it indicates a strong bullish trend. Similarly, repeated trading below the pivot point signals bearish momentum. This helps traders align their positions with the prevailing market direction. Tracking the pivot point’s own trajectory over several days can also be informative. If each day’s pivot is higher than the previous day’s pivot, the underlying trend is constructive even if individual sessions show mixed price action.
Combining Pivot Points with Other Tools
Pivot points are most effective when used alongside other technical methods rather than in isolation. A common and practical combination is using pivot levels for target and stop-loss placement while using candlestick patterns or moving average crossovers for entry timing.
For example, if the price pulls back to S1 and simultaneously forms a bullish pin bar or hammer candle at that level, the trade setup carries more conviction than simply buying because the price touched S1. Similarly, if the pivot point for the day aligns closely with the 20-day or 50-day moving average, that level becomes a stronger reference point because two independent methods are pointing to the same zone.
Volume analysis also adds value. A break above R1 on volume that is 1.5 to 2 times the session average is more likely to follow through to R2 than one on below-average volume, which may reverse back toward the pivot.
Limitations of Pivot Points
Pivot points are one of the useful technical indicators for identifying support and resistance levels, but there are some downsides that every trader should know when using them.
Reliance on Historical Data
Pivot points are based on past prices and don’t adjust for unexpected news or events that can impact market direction. On days with a significant pre-market gap due to overnight global cues or domestic news, the pivot levels calculated from the previous session may be rendered irrelevant within the first few minutes of trading. When the opening price itself is beyond R2 or below S2, the standard levels lose most of their intraday utility.
Effectiveness in Range-Bound Markets
They work best in sideways or mildly trending markets, but can become less reliable during strong trends or breakouts. On trending days, where the price moves in one direction for most of the session, the pivot levels on the counter-trend side go untested, and the levels in the direction of the trend get broken in quick succession without acting as meaningful barriers.
Static Nature
Pivot points stay fixed throughout the trading day and don’t react to intraday market movements. Unlike indicators such as moving averages or Bollinger Bands that update with each new candle, pivot levels remain unchanged regardless of what happens during the session. This can be both an advantage, providing fixed reference points, and a limitation, since the market’s character can shift significantly between the morning and afternoon sessions.
Self-Fulfilling Nature
Because pivot points are widely used, especially by algorithmic trading systems, there is a degree of self-fulfilling prophecy in their effectiveness. Large clusters of orders tend to sit near these levels, which can cause the price to react at pivot levels even when there is no fundamental reason for it. While this can work in a trader’s favour, it also means that market makers and institutional participants are aware of these clusters and may occasionally use them to trigger stop-losses before reversing direction.
Conclusion
Pivot points are a simple yet practical tool that helps traders quickly identify potential support and resistance levels. They give a clear idea of market sentiment, whether it’s bullish or bearish, and assist in setting entry, exit, and stop-loss points.
While they are beneficial for intraday trading and trend identification, it’s important to remember that pivot points are based on historical data and remain fixed throughout the trading day. They work best in range-bound markets and should be used along with other indicators, candlestick patterns, or volume analysis for better decision-making.
On strongly trending or event-driven days, their reliability diminishes, and traders should be prepared to adjust their approach accordingly. Overall, they add structure and clarity to trading strategies, particularly for intraday participants who benefit from having pre-defined levels before the session begins.
Frequently Asked Questions (FAQs)
What do pivot points indicate?
Pivot points show possible support and resistance levels in the market where the price might change direction. They also indicate overall market sentiment: trading above the pivot suggests bullishness, while trading below it suggests bearishness.
What is the best pivot point for trading?
There isn’t one “best” pivot point. The standard pivot point is the most widely used, but Woodie’s, Camarilla, and Fibonacci pivot methods each suit different trading styles and timeframes. Scalpers often prefer Camarilla for its tighter levels, while swing traders may find standard or Fibonacci pivots more useful.
How to find a pivot in trading?
A pivot is calculated using the previous day’s high, low, and closing price. Most trading platforms on Indian brokers also provide it automatically in their charting tools, so manual calculation is rarely necessary. If you prefer to calculate manually, the data is available in the previous session’s daily candle on any standard charting platform.
Can pivot points be used for swing trading?
Yes. While pivot points are most commonly associated with intraday trading, weekly and monthly pivot points can serve as reference levels for swing and positional traders. Weekly pivots, calculated using the previous week’s high, low, and close, provide broader support and resistance zones that are useful for trades held over several days.
Do pivot points work on all stocks?
Pivot points work best on liquid stocks and indices where sufficient trading activity ensures that price reacts meaningfully at calculated levels. On thinly traded small-cap stocks, where daily volumes are low and price gaps are frequent, pivot levels may be breached without any significant reaction, reducing their practical usefulness.
Disclaimer: This content is for educational purposes only and does not constitute financial or investment advice. Investments in securities or other financial instruments are subject to market risk, including partial or total loss of capital. Past performance is not indicative of future results. Always consider your financial situation carefully and consult a licensed financial advisor before making investment or trading decisions.
Table of Content
- Key Takeaways
- What Are Pivot Points in Trading?
- Calculation of Pivot Points
- Example of Pivot Point
- Types of Pivot Points
- Interpretation of Pivot Points
- Market Sentiment Based on Pivot Point
- Applications of Pivot Points in Trading
- Combining Pivot Points with Other Tools
- Limitations of Pivot Points
- Conclusion
- Frequently Asked Questions (FAQs)
Engineered for the obsessed. Built for traders.

Purpose-built terminals.
Zero compromise.
Built for speed.
Plot No 1290, 2nd Floor, 17th Cross, 5th Main, Sector-7, HSR Layout, Bangalore 560102
Follow us on
Mintcap Brokers Private Limited
CIN – U66110KA2023PTC178706 | Registered Address: Plot No 1290, Second Floor, 17th Cross, 5th Main, Sector-7, HSR Layout, Bangalore 560102 | Tel: 080 – 49552310 | Email ID: compliance@capmint.com | SEBI registered Stock Broker: INZ000322732 | NSE Cash/F&O Member ID: 90430 | BSE Cash/F&O Member ID: 6903 | MCX Member ID: 57400 | NCDEX Member ID: 1312 | SEBI registered Depository Participant: IN-DP-806-2025 | CDSL DP ID: 12102300 | NSE Clearing Member code: M70108 | AMFI-Registered Mutual Fund Distributor: ARN-289109 (Valid upto 28-Feb-2027) | Category II Execution Only Platform : E6903
Details of Client Bank Account
Compliance Officer: Ms. Shridevi Vungarala | Email ID: compliance@capmint.com | Tel no. + 91 9035330126 | Grievance Redressal Officer (GRO) – Ms. Shikha Gupta | Email ID: Grievance@capmint.com | Tel no: 9035331595.
Procedure to file a complaint on SEBI SCORES: Register on SCORES portal. Mandatory details for filing complaints on SCORES: Name, PAN, Address, Mobile Number, E-mail ID. Benefits: Effective Communication, Speedy redressal of the grievances. You may refer the website https://scores.sebi.gov.in/ for more information. You may also download the SEBI Scores app to log a complaint Android: https://play.google.com > store > apps > sebiscores iOS: https://apps.apple.com > app > sebiscores
Disclaimer
Investment in the securities market are subject to market risks, read all the related documents carefully before investing. Brokerage will not exceed the SEBI prescribed limit.
Mutual fund investments are subject to market risks, read all scheme related documents carefully before investing. Mutual Funds are not exchange-traded products.
Attention Investor:
- Stock Brokers can accept securities as margin from clients only by way of pledge in the depository system w.e.f. September 1, 2020.
- Update your mobile number & email Id with your stock broker/depository participant and receive OTP directly from depository on your email id and/or mobile number to create pledge.
- Pay 20% as upfront margin of the transaction value to trade in cash market segment.
- Investors may please refer to the Exchange’s Frequently Asked Questions (FAQs) issued vide circular reference NSE/INSP/45191 dated July 31, 2020 and NSE/INSP/45534 dated August 31, 2020 and other guidelines issued from time to time in this regard.
- Check your Securities /MF/ Bonds in the consolidated account statement issued by NSDL/CDSL every month.