
Link copied!
Momentum Trading
Momentum trading is a trading strategy that involves buying stocks that have seen a surge in their prices recently. The core idea is to “buy high and sell higher”.
Key Takeaways
- Momentum traders look for stocks that are already moving significantly and aim to enter early in the trend to maximise profits.
- The main objective is to ride ongoing price strength until signs of weakness emerge, enabling profitable exits before reversals.
- Momentum trading relies heavily on technical tools like RSI, MACD, and volume to identify strong trends and manage risk efficiently.
What is the Momentum Trading Strategy?
Momentum stock trading works on the belief that assets moving strongly in one direction will continue in that direction until a significant shift occurs. This approach is deeply rooted in market psychology. When traders see a stock rapidly rising, a sense of fear of missing out (FOMO) can kick in, leading to more buying. This collective behaviour drives the price even higher, creating a self-reinforcing cycle. The opposite occurs in falling markets, too, where fear and panic accelerate the decline.
“Momentum is the lifeblood of trading. If a stock isn’t moving, you can’t make money. You want to be in the names that are moving with power and volume.”
— Mark Minervini, Momentum Masters
Volume plays a key role in confirming this behaviour; higher volume suggests stronger conviction behind the move. Traders interpret this as a sign that the trend is likely to continue.
Elements of Momentum Investing
The success of a momentum investing strategy depends on a structured approach that focuses on key elements. These factors are important for managing risk and making consistent decisions in a volatile market. Here are the core elements of momentum investing:
Selection of Equities
Momentum investing begins with choosing the right stocks. Identifying stocks that show strong price trends is the foundation of this strategy.
Timing and Risk Management
In momentum trading, timing plays a crucial role. Knowing when to enter and exit a trade helps maximise returns while reducing the risk caused by market fluctuations.
Entry Timing
Traders aim to enter positions early in a trend to capture maximum movement. This requires the ability to identify emerging opportunities and act quickly.
Position Management
Managing positions effectively involves monitoring factors such as bid-ask spreads and deciding the ideal holding period. The goal is to balance profit potential with proper risk control.
Exit Points
Setting clear exit levels is essential in momentum investing. Regular chart analysis helps traders decide when to book profits or limit losses.
By focusing on these elements, investors can better navigate market movements and improve their chances of achieving consistent returns.
How Does Momentum Trading Work?
Here’s a step-by-step breakdown:
Identify the Trend
Start by spotting assets with a clear directional movement, either upward or downward. Traders typically look for consistently higher highs in an uptrend or lower lows in a downtrend over a short to medium time frame.
Confirm Strength
Once a trend is identified, traders verify its momentum using technical indicators like RSI (Relative Strength Index), MACD (Moving Average Convergence Divergence), or volume analysis.
Enter the Position
Traders enter a trade when the trend shows signs of sustained strength. This could mean buying a stock that has just broken out of a resistance level with strong volume, or shorting a stock that has fallen through a support level.
Exit Before Reversal
Profits are taken before momentum fades. Traders often set predefined price targets or use trailing stop-loss orders that move with the price.
Example of Momentum Trading
A real-world example of momentum trading occurred with Tata Motors (NSE: TATAMOTORS) in late January 2024. On January 29, Tata Motors reported strong quarterly earnings, beating analyst expectations due to improved JLR performance and margin expansion. The news triggered a sharp price rally.
Traders who entered near the breakout level around ₹827 could have ridden the price move to ₹934+ over the next couple of trading sessions.
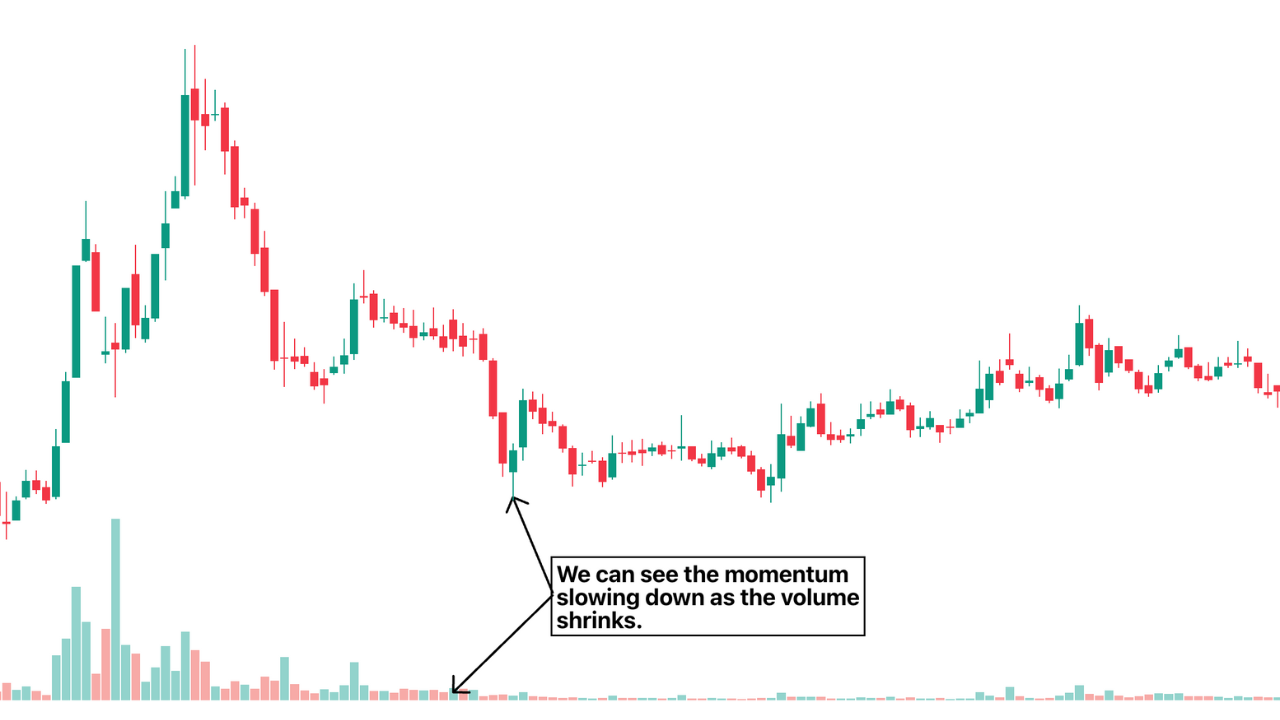
In the Image, around the ₹950 levels, we can see a formation of a doji candle and a closing below the doji candle in the next few sessions, suggesting a slowing of momentum.
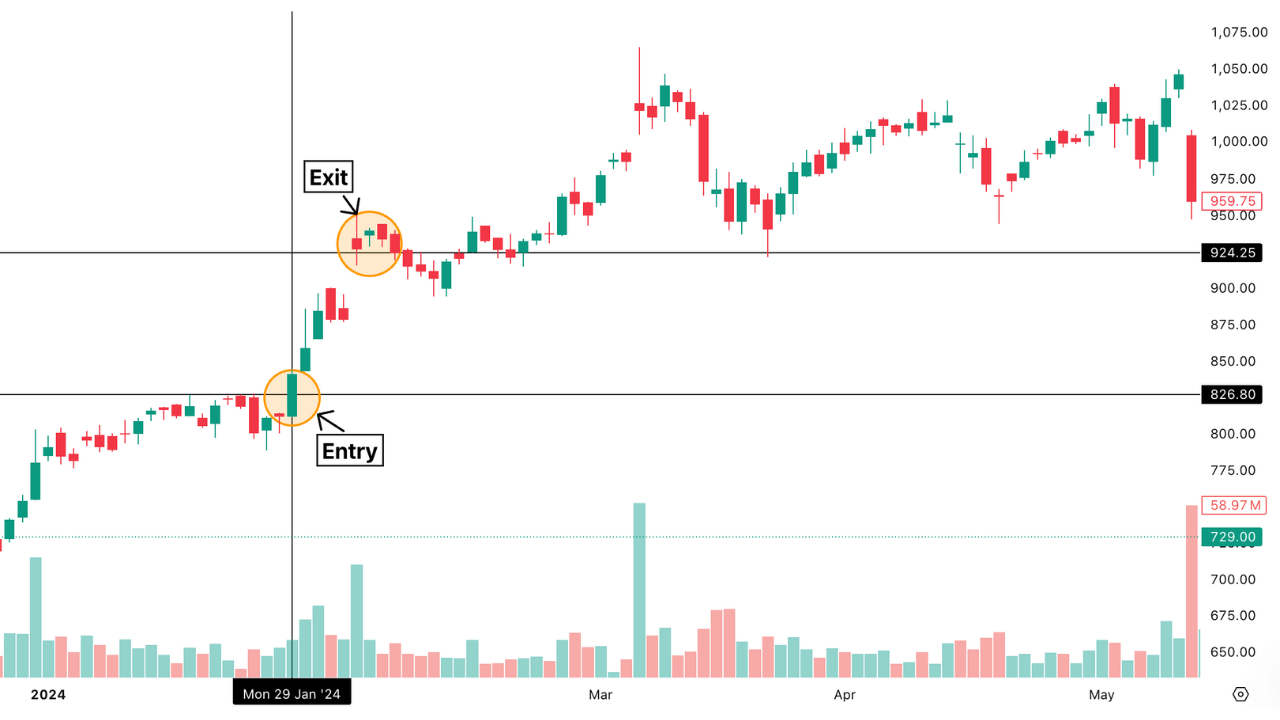
(source: Tata Motors Q3 FY 2023-24 result)
Indicators Used in Momentum Trading
Even though you might need a fundamental trigger for the momentum to carry, momentum traders rely heavily on technical indicators to time their entries and exits. These tools help assess trend strength, confirm price moves, and avoid false signals.
Relative Strength Index (RSI)
While the RSI is widely used to identify the oversold or the overbought region in momentum trading, RSI can also help assess the strength of a trend; values above 60 often indicate strong upside momentum, while values below 40 suggest strong downside momentum. This makes RSI valuable not just for entry signals but also for gauging how fierce a price move may be.
Moving Average Convergence Divergence (MACD)
This indicator tracks the relationship between two exponential moving averages (typically the 12-day and 26-day EMAs). A bullish crossover, when the MACD line crosses above the signal line, can indicate rising momentum, while a bearish crossover signals weakening momentum. The distance between the MACD and signal lines also provides insight into trend strength.
Volume
Volume represents the number of shares or contracts traded in a given period. High volume during a price move confirms market participation and the strength of the trend. Momentum traders often look for volume spikes as confirmation that a breakout or breakdown is likely to continue.
Benefits of Momentum Trading
Quick Profit Potential
Momentum trading allows traders to benefit from short-term price moves that happen quickly, especially after earnings announcements or economic news. These price moves can yield significant gains in just a few hours or days.
Works well in Volatile Conditions
High market volatility often presents excellent opportunities for momentum traders. Instead of avoiding volatility, they thrive on it by entering and exiting trades quickly to exploit rapid price changes.
Does not Rely on Deep Fundamental Analysis?
Since momentum trading is based on price action and volume, traders don’t have to study balance sheets or financial statements extensively. For instance, in the example of TATA Motors, we saw that a positive Q3 report on earnings alone triggered a momentum. This allows for faster decision-making and more flexibility.
Risks and Challenges of Momentum Trading
Momentum trading carries its own set of risks that traders must manage carefully. Understanding these challenges is critical for building a sustainable and profitable strategy.
False Breakouts Can Lead to Losses
In momentum trading, price breakouts may not always be reliable. A stock might temporarily rise above resistance but quickly fall back, trapping traders and resulting in unexpected losses if stop losses are not in place.
High Volatility Increases Unpredictability
While volatility offers profit potential, it also means price swings can be sharp and erratic. Traders may get whipsawed out of positions or face larger-than-expected losses due to sudden reversals or market overreactions.
Requires Strict Risk Management Discipline
Without well-defined stop-losses and position sizing, a few failed trades can wipe out gains. Momentum traders must act swiftly and not let emotions influence their trades, which takes practice and control.
Conclusion
Momentum trading can be rewarding, but it’s not for everyone. You should first determine what kind of trading style suits you. It demands fast decisions, deep technical knowledge, and unwavering discipline.
Momentum trading can be a highly profitable strategy for those who understand market trends and use the right tools. However, it demands discipline, a good understanding of technical indicators, and sound risk management. Traders should always backtest strategies and keep an eye on market sentiment.
Frequently Asked Questions (FAQs)
What is the main goal of momentum trading?
The goal of momentum trading is to profit from stocks or assets that are moving strongly in one direction. Traders aim to enter during the trend’s early phase and ride the price wave until signs of a slowdown or reversal appear. By acting quickly and following technical signals, momentum traders can capitalise on short-term market moves that may be missed by traditional investors.
Is momentum trading suitable for beginners?
Momentum trading is generally not ideal for beginners. It involves fast-paced decisions, in-depth use of technical analysis tools, and tight risk management practices. Without experience, it can be easy to enter trades too late, react emotionally, or misread signals, leading to losses. Beginners should first practice with virtual trading and learn how to manage risk before engaging in real momentum trades.
Which indicators work best for momentum trading?
The most effective indicators for momentum trading include RSI, MACD, moving averages, and volume. RSI helps assess whether a stock is overbought or oversold and signals the strength of momentum. MACD shows trend direction and potential reversals. Volume confirms the intensity behind a price move, while moving averages help spot trend changes and filter market noise.
Disclaimer: This content is for educational purposes only and does not constitute financial or investment advice. Investments in securities or other financial instruments are subject to market risk, including partial or total loss of capital. Past performance is not indicative of future results. Always consider your financial situation carefully and consult a licensed financial advisor before making investment or trading decisions.
Engineered for the obsessed. Built for traders.

Purpose-built terminals.
Zero compromise.
Built for speed.
Plot No 1290, 2nd Floor, 17th Cross, 5th Main, Sector-7, HSR Layout, Bangalore 560102
Follow us on
Mintcap Brokers Private Limited
CIN – U66110KA2023PTC178706 | Registered Address: Plot No 1290, Second Floor, 17th Cross, 5th Main, Sector-7, HSR Layout, Bangalore 560102 | Tel: 080 – 49552310 | Email ID: compliance@capmint.com | SEBI registered Stock Broker: INZ000322732 | NSE Cash/F&O Member ID: 90430 | BSE Cash/F&O Member ID: 6903 | MCX Member ID: 57400 | NCDEX Member ID: 1312 | SEBI registered Depository Participant: IN-DP-806-2025 | CDSL DP ID: 12102300 | NSE Clearing Member code: M70108 | AMFI-Registered Mutual Fund Distributor: ARN-289109 (Valid upto 28-Feb-2027) | Category II Execution Only Platform : E6903
Details of Client Bank Account
Compliance Officer: Ms. Shridevi Vungarala | Email ID: compliance@capmint.com | Tel no. + 91 9035330126 | Grievance Redressal Officer (GRO) – Ms. Shikha Gupta | Email ID: Grievance@capmint.com | Tel no: 9035331595.
Procedure to file a complaint on SEBI SCORES: Register on SCORES portal. Mandatory details for filing complaints on SCORES: Name, PAN, Address, Mobile Number, E-mail ID. Benefits: Effective Communication, Speedy redressal of the grievances. You may refer the website https://scores.sebi.gov.in/ for more information. You may also download the SEBI Scores app to log a complaint Android: https://play.google.com > store > apps > sebiscores iOS: https://apps.apple.com > app > sebiscores
Disclaimer
Investment in the securities market are subject to market risks, read all the related documents carefully before investing. Brokerage will not exceed the SEBI prescribed limit.
Mutual fund investments are subject to market risks, read all scheme related documents carefully before investing. Mutual Funds are not exchange-traded products.
Attention Investor:
- Stock Brokers can accept securities as margin from clients only by way of pledge in the depository system w.e.f. September 1, 2020.
- Update your mobile number & email Id with your stock broker/depository participant and receive OTP directly from depository on your email id and/or mobile number to create pledge.
- Pay 20% as upfront margin of the transaction value to trade in cash market segment.
- Investors may please refer to the Exchange’s Frequently Asked Questions (FAQs) issued vide circular reference NSE/INSP/45191 dated July 31, 2020 and NSE/INSP/45534 dated August 31, 2020 and other guidelines issued from time to time in this regard.
- Check your Securities /MF/ Bonds in the consolidated account statement issued by NSDL/CDSL every month.