
Link copied!
Volatility Indicators
Volatility is the rate at which the price of a security increases or decreases for a given set of returns. Technical tools like Bollinger bands, ATR, and VIX help to understand market volatility.
Key Takeaways
- Volatility means how much and how fast the price of a stock or asset moves. If prices change quickly, it’s a sign of high volatility. If they move slowly, volatility is low.
- Volatility indicators help traders understand market movement and risk. Tools like ATR, Bollinger Bands, and India VIX give useful signals to track how volatile the market is.
- These indicators are used for both spotting trading opportunities and managing risk. For example, they help in identifying breakout points and in setting smart stop-losses.
- They are not perfect and should be used with other tools. Indicators can give false signals in sideways markets, so it’s better to combine them with other analysis methods for better accuracy.
What are Volatility Indicators?
Volatility refers to how much and how quickly the price of a stock or any investment goes up or down. If prices jump around a lot in a short time, the market becomes highly volatile. On the other hand, if prices move slowly or stay stable, the market becomes less volatile.
To track and understand volatility, traders use certain tools called volatility indicators. Some of the most common ones include Bollinger Bands, which show how far the price is moving from its average; ATR (Average True Range), which measures the average size of recent price moves; and the VIX, also known as the “fear index,” which reflects the market’s expectations of future volatility. These tools help traders decide when to enter or exit a trade, manage risk better, and prepare for sudden price changes.
Types of Volatility Indicators
Here are some volatility indicators that traders often use to gauge volatility
India VIX
In the Indian context, India VIX performs a similar role using Nifty 50 options, offering insights into how volatile traders expect the Indian markets to be. Higher VIX values typically suggest heightened risk and caution in the market environment.
Average True Range (ATR)
The Average True Range is a widely used tool to measure market volatility by calculating the average price movement over a given period. Unlike indicators that focus on direction, ATR is purely focused on the degree of movement. Traders often use it to set more realistic stop-loss levels and to spot potential breakout setups, especially in volatile markets.
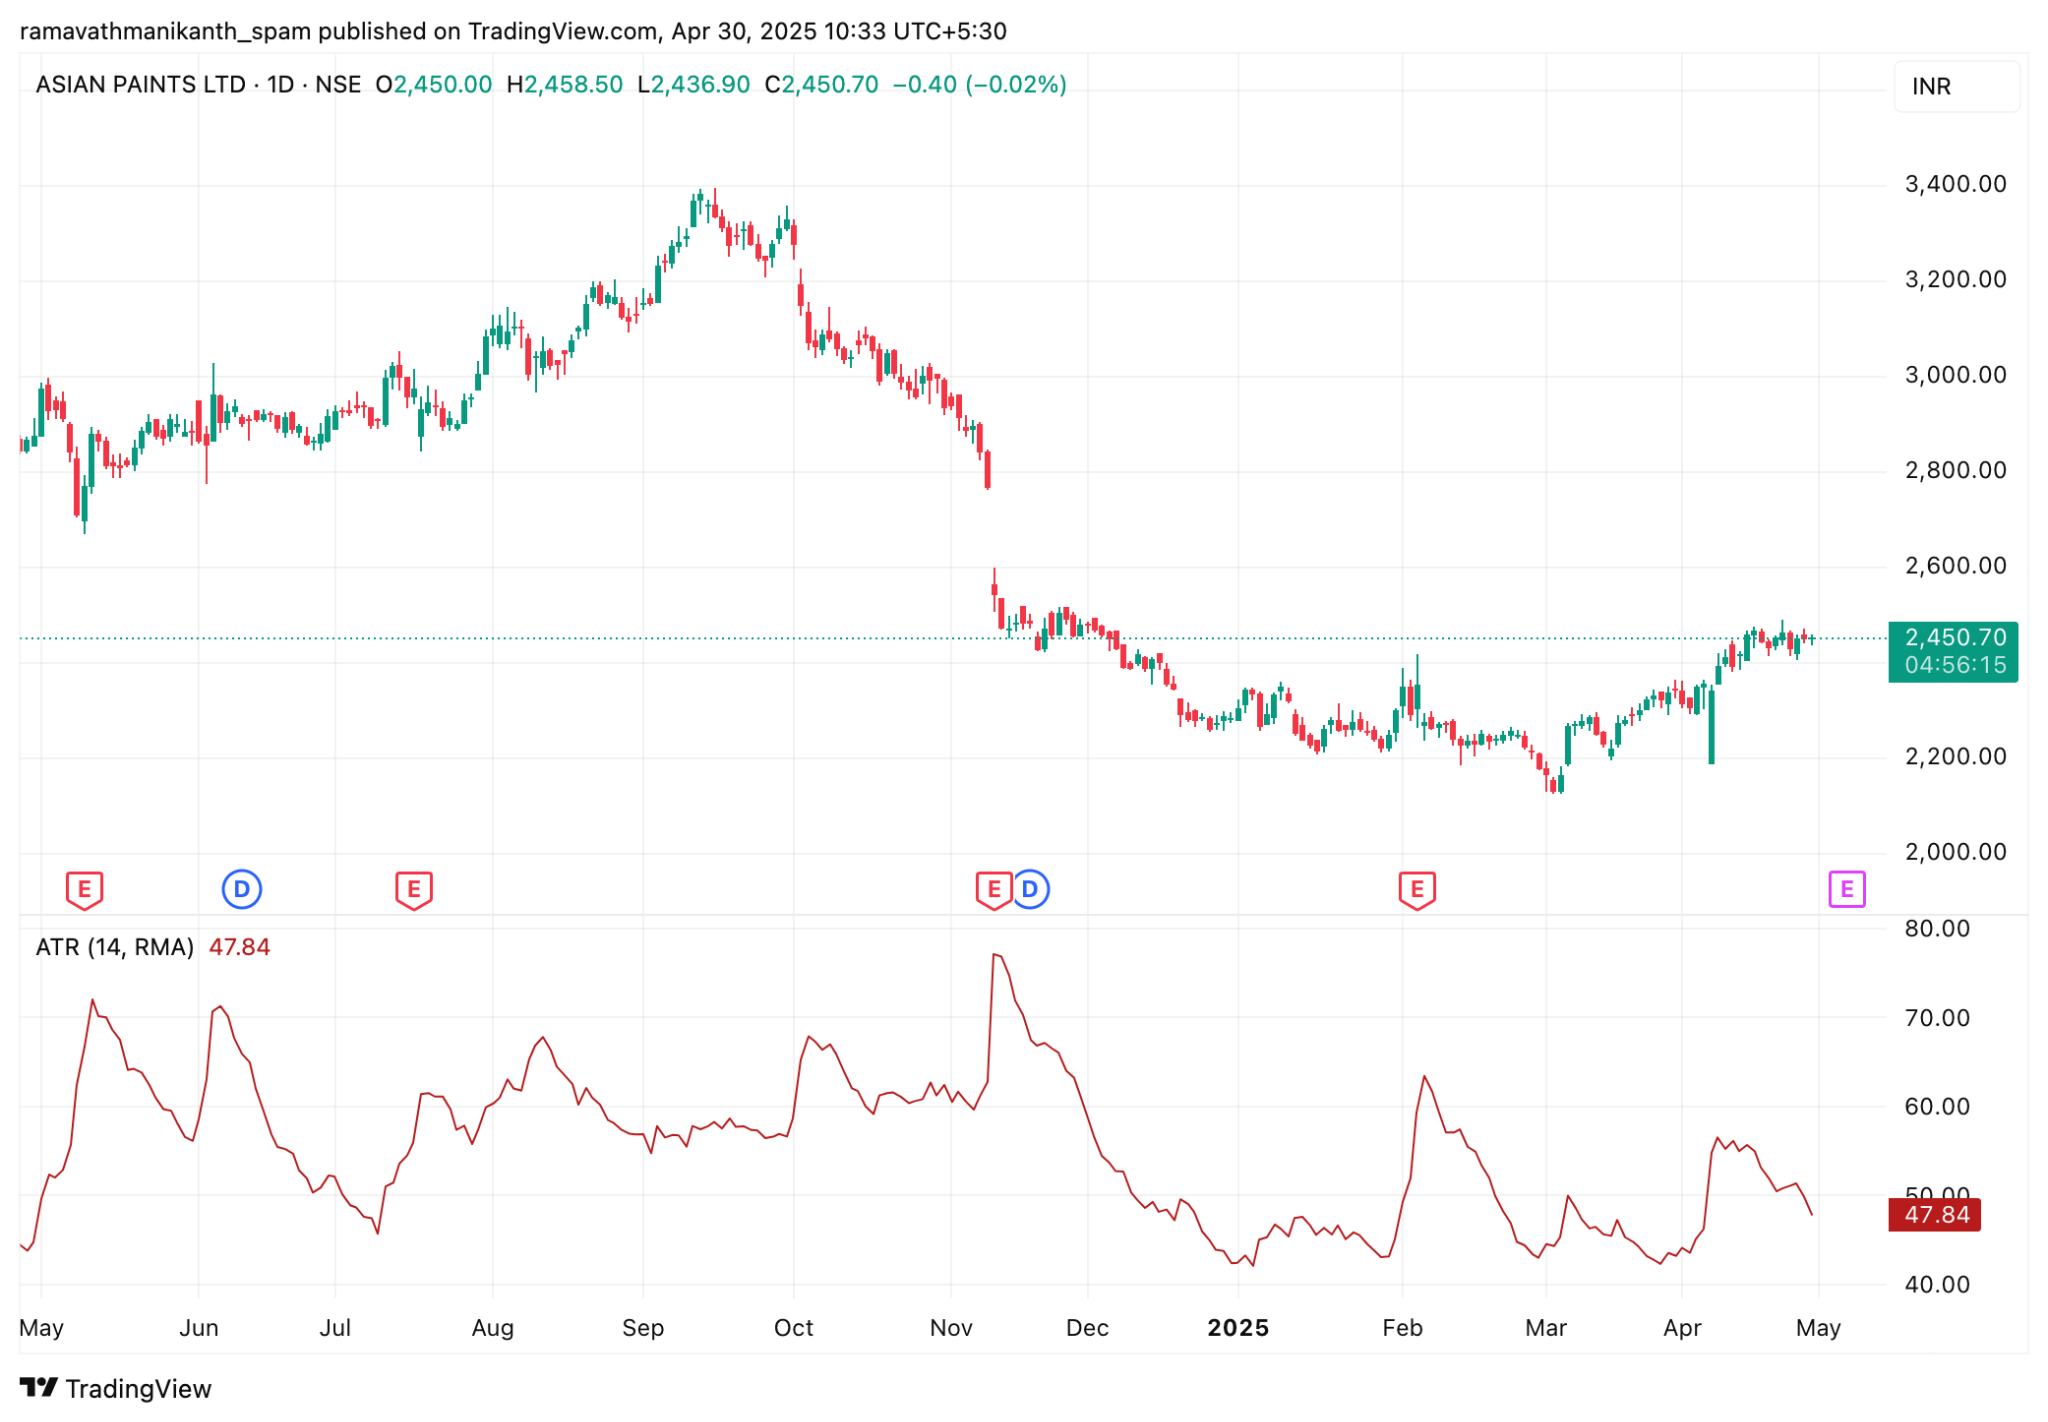
(Source: Nifty, TradingView,30 Apr- 25)
Bollinger Bands
Bollinger Bands consist of a central moving average flanked by two bands placed at a standard deviation above and below it. These bands expand and contract based on market volatility.
When prices move closer to or outside the bands, it can suggest that the asset is either overbought or oversold, making it a useful tool to identify potential reversal points.
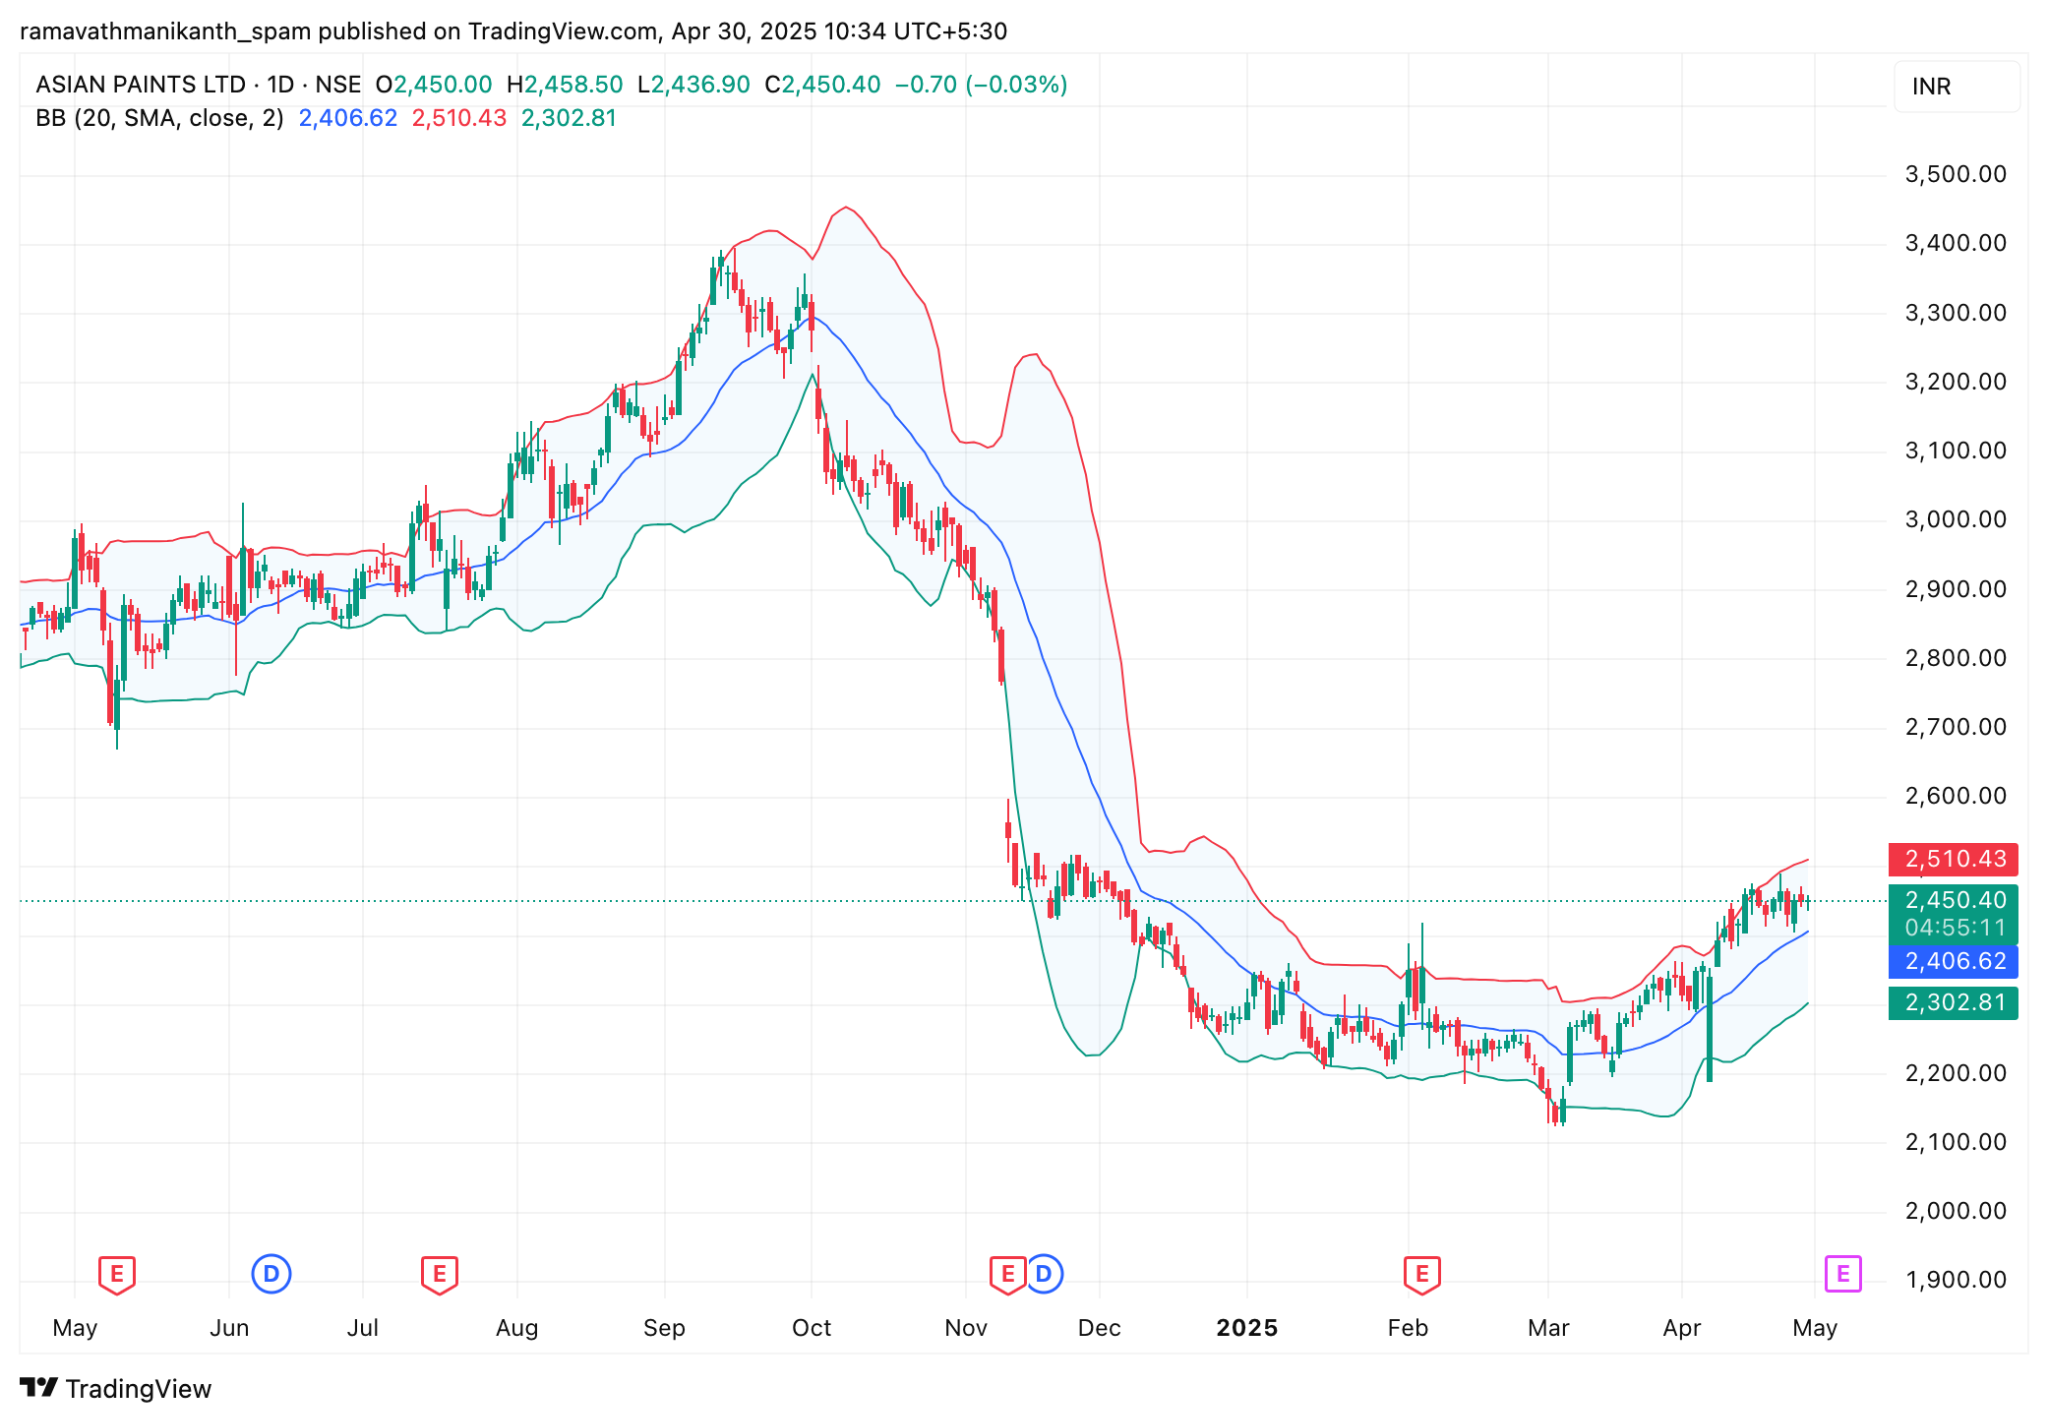
(Source: Nifty, TradingView,30 Apr- 25)
Chaikin Volatility Indicator
This indicator evaluates the difference between an asset’s high and low prices over time to assess market volatility. A sudden increase in this range may indicate an upcoming trend reversal or shift in market momentum. It’s beneficial for identifying periods of emotional extremes in the market, whether fear-driven selloffs or euphoric rallies.
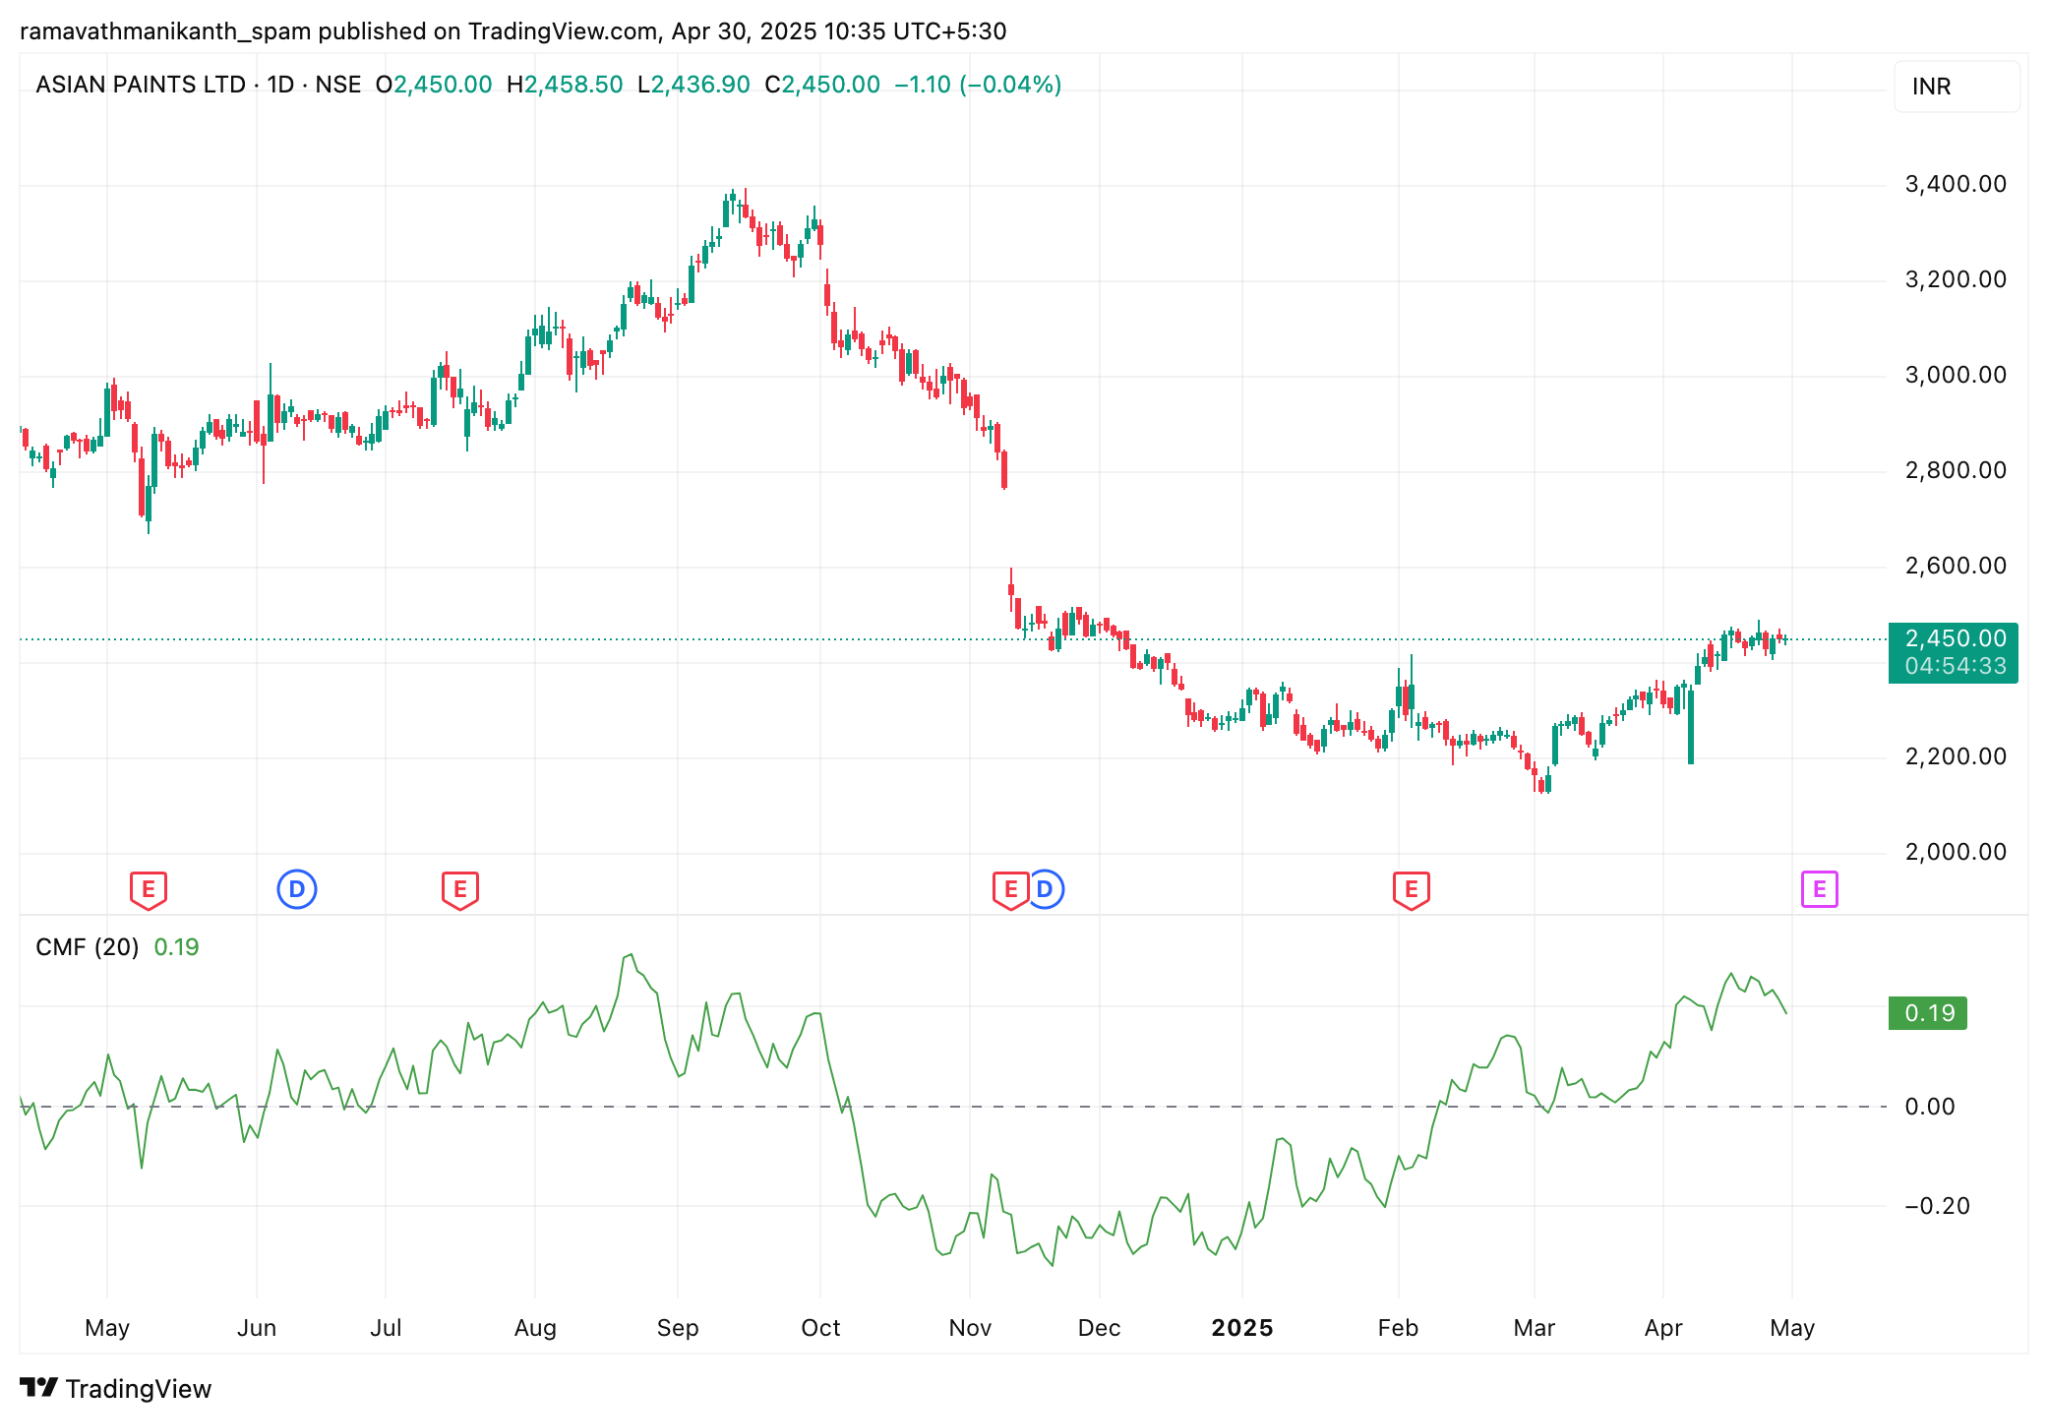
(Source: Nifty, TradingView,30 Apr- 25)
Volatility Ratio
The Volatility Ratio compares the Average True Range to the average price of a security, providing a normalised measure of how volatile an asset is relative to its own price. This makes it easier to compare volatility across different stocks or assets, regardless of whether their prices are high or low.
Keltner Channel Indicator
The Keltner Channel is a volatility-based indicator that uses three lines, a middle moving average and upper and lower bands. These bands expand and contract based on price movement. When the price moves above the upper band, it may indicate strength, while a move below the lower band may suggest weakness. Traders use it to identify trends and potential breakout points.

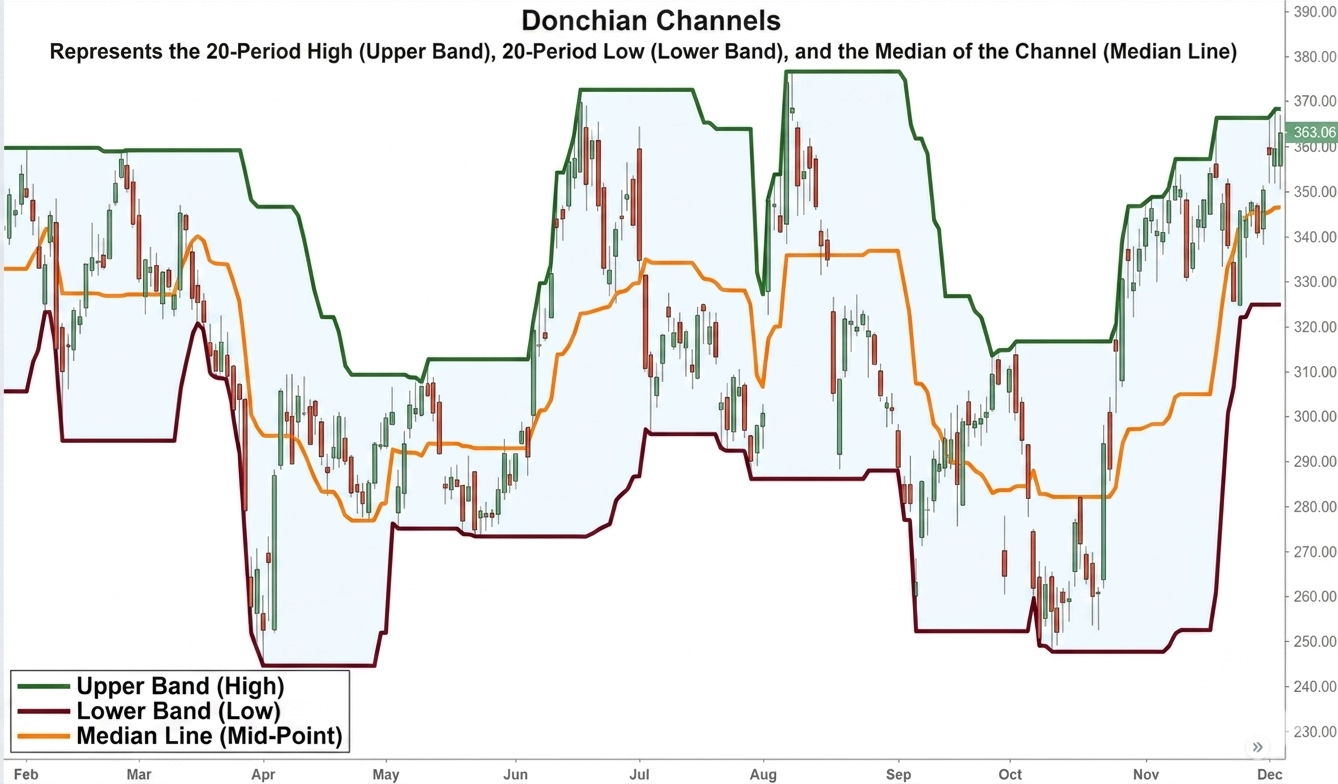
Donchian Channel Indicator
The Donchian Channel helps traders identify breakouts and trends. It consists of an upper band (highest price), a lower band (lowest price), and a middle line (average). When price breaks above the upper band, it may signal a bullish breakout, while a drop below the lower band can indicate a bearish move. It is widely used for trend-following strategies.
Twiggs Volatility Indicator
The Twiggs Volatility indicator measures market risk and price fluctuations over time. It is commonly used to track indices and individual stocks. Rising volatility levels indicate increasing market risk, while falling levels suggest stability. Traders use it to understand changing market conditions and adjust their strategies accordingly.
Relative Volatility Index (RVI)
The Relative Volatility Index (RVI) measures the direction of volatility rather than price. It ranges from 0 to 100, similar to RSI. Higher values indicate increasing volatility in upward price movements, while lower values suggest volatility in downward movements. Traders use it to confirm trends and assess market strength.
Implementing Volatility Indicators in Trading Strategies
Volatility indicators are also used in trading to find entries and in risk management techniques.
Breakout Trading
The goal is to identify moments when the price is about to move sharply beyond a defined support or resistance level. To do this effectively, you need indicators that detect rising volatility, trend strength, and volume confirmation.
For example, Bollinger bands can be used when the bands contract (squeeze), which signals low volatility. A sudden expansion often indicates that a breakout is about to happen. Traders can take entry when the price breaks above the upper band or below the lower band.
Risk Management
In trading, managing risk isn’t just about limiting losses; it’s about placing smart stop-losses that make sense for the market conditions. One way to do that is by using volatility-based indicators, which help you set stops that adapt to how much the price typically moves.
Take Average True Range (ATR) for instance. It shows the average range a stock moves each day. Instead of placing a fixed ₹5 or ₹10 stop-loss, a trader might look at the ATR — say it’s ₹6 and set the stop 1.5x ATR below the entry point. This way, you’re giving the trade enough room to breathe while still protecting yourself if the price swings too far. It’s a more dynamic and calculated way to manage downside risk.
Limitations Of Volatility Indicators
Here are some limitations of using Volatility Indicators that traders should know while using them:
False Signals
Volatility indicators can sometimes give misleading cues, especially during sideways or choppy markets. A spike in volatility might signal a breakout, but the price could quickly reverse, trapping traders. That’s why it’s important not to rely on a single signal; always look for confirmation before acting.
Market Conditions
The effectiveness of volatility indicators can change depending on the market environment. For instance, tools like Bollinger Bands may work well in trending markets but can give poor signals during consolidations. Understanding whether the market is trending, ranging, or reversing helps in choosing the right indicator and setting realistic expectations.
Complementary Analysis
Volatility indicators work best when used with other forms of analysis, such as trend indicators, volume studies, or fundamental insights. For example, pairing ATR with moving averages or support/resistance levels can improve decision-making. This combined approach reduces the chances of acting on incomplete or misleading information.
Different Ways to Measure Volatility
There are several ways to measure volatility, helping investors understand how much an asset’s price or returns fluctuate. These measures provide insights into risk, performance, and how closely an asset moves with the broader market.
Standard Deviation
Standard deviation measures how much an asset’s returns vary over a period. A higher standard deviation indicates greater volatility, meaning prices fluctuate more widely, while a lower value suggests more stable returns.
Beta
Beta compares an asset’s volatility to a benchmark or market index. A beta of 1 means the asset moves in line with the market, while a beta greater than 1 indicates higher volatility and a beta below 1 suggests lower volatility.
R-Squared
R-squared measures how closely an asset’s performance is aligned with its benchmark. A higher R-squared indicates that the asset’s movements are largely explained by market movements, helping investors assess reliability in volatility comparison.
Alpha
Alpha measures how much an asset has outperformed or underperformed its benchmark after adjusting for risk. A positive alpha suggests better-than-expected returns, while a negative alpha indicates underperformance.
Conclusion
Volatility indicators are useful tools that help traders understand how much the price of a stock or asset is likely to move. They don’t predict direction, but they show the strength and speed of price changes. When used properly, these indicators can improve decision-making, especially in setting stop-losses or spotting high-risk situations.
However, they are not foolproof and can give wrong signals in certain market conditions. That’s why it’s important to use them carefully and combine them with other tools and analysis. Overall, understanding volatility helps traders stay more prepared and manage their trades with more confidence.
Frequently Asked Questions FAQs
Which indicator is best for volatility?
There’s no single “best” indicator, but ATR (Average True Range), Bollinger Bands, and VIX are widely used. ATR shows how much the price moves on average, Bollinger Bands highlight price extremes, and VIX reflects market-wide fear or uncertainty
What is the volatility 75 index indicator?
The Volatility 75 Index (VIX 75), also known as the VIX 75, tracks the volatility of synthetic markets and mimics real-world market fear. It’s often used in trading platforms like Deriv to speculate on extreme price movements and market risk, especially in high-frequency trading.
How to use Volatility Indicators?
Volatility indicators help traders assess market activity and adjust strategies. They are used to identify breakouts, set stop-loss levels, and gauge trend strength. Combining them with other indicators improves accuracy and helps manage risk during changing market conditions.
How to Identify Volatility in the Market?
Volatility can be identified by observing price fluctuations, widening ranges, and indicator signals like ATR or Bollinger Bands. High volatility shows sharp price movements, while low volatility reflects stable or sideways markets. Traders track these changes to time entries and exits effectively.
Disclaimer: This content is for educational purposes only and does not constitute financial or investment advice. Investments in securities or other financial instruments are subject to market risk, including partial or total loss of capital. Past performance is not indicative of future results. Always consider your financial situation carefully and consult a licensed financial advisor before making investment or trading decisions.
Engineered for the obsessed. Built for traders.

Purpose-built terminals.
Zero compromise.
Built for speed.
Plot No 1290, 2nd Floor, 17th Cross, 5th Main, Sector-7, HSR Layout, Bangalore 560102
Follow us on
Mintcap Brokers Private Limited
CIN – U66110KA2023PTC178706 | Registered Address: Plot No 1290, Second Floor, 17th Cross, 5th Main, Sector-7, HSR Layout, Bangalore 560102 | Tel: 080 – 49552310 | Email ID: compliance@capmint.com | SEBI registered Stock Broker: INZ000322732 | NSE Cash/F&O Member ID: 90430 | BSE Cash/F&O Member ID: 6903 | MCX Member ID: 57400 | NCDEX Member ID: 1312 | SEBI registered Depository Participant: IN-DP-806-2025 | CDSL DP ID: 12102300 | NSE Clearing Member code: M70108 | AMFI-Registered Mutual Fund Distributor: ARN-289109 (Valid upto 28-Feb-2027) | Category II Execution Only Platform : E6903
Details of Client Bank Account
Compliance Officer: Ms. Shridevi Vungarala | Email ID: compliance@capmint.com | Tel no. + 91 9035330126 | Grievance Redressal Officer (GRO) – Ms. Shikha Gupta | Email ID: Grievance@capmint.com | Tel no: 9035331595.
Procedure to file a complaint on SEBI SCORES: Register on SCORES portal. Mandatory details for filing complaints on SCORES: Name, PAN, Address, Mobile Number, E-mail ID. Benefits: Effective Communication, Speedy redressal of the grievances. You may refer the website https://scores.sebi.gov.in/ for more information. You may also download the SEBI Scores app to log a complaint Android: https://play.google.com > store > apps > sebiscores iOS: https://apps.apple.com > app > sebiscores
Disclaimer
Investment in the securities market are subject to market risks, read all the related documents carefully before investing. Brokerage will not exceed the SEBI prescribed limit.
Mutual fund investments are subject to market risks, read all scheme related documents carefully before investing. Mutual Funds are not exchange-traded products.
Attention Investor:
- Stock Brokers can accept securities as margin from clients only by way of pledge in the depository system w.e.f. September 1, 2020.
- Update your mobile number & email Id with your stock broker/depository participant and receive OTP directly from depository on your email id and/or mobile number to create pledge.
- Pay 20% as upfront margin of the transaction value to trade in cash market segment.
- Investors may please refer to the Exchange’s Frequently Asked Questions (FAQs) issued vide circular reference NSE/INSP/45191 dated July 31, 2020 and NSE/INSP/45534 dated August 31, 2020 and other guidelines issued from time to time in this regard.
- Check your Securities /MF/ Bonds in the consolidated account statement issued by NSDL/CDSL every month.