
Table of Content
- Key Takeaways
- What is the Inverted Hammer Pattern?
- Components of the Inverted Hammer Pattern
- Red Inverted Hammer indication
- Green Inverted Hammer Indication
- Psychology Behind the Inverted Hammer Pattern
- How to read the Inverted Hammer Candlestick Pattern in Technical Analysis?
- How to Trade the Inverted Hammer Pattern?
- Advantages and Limitations
- Conclusion
- Frequently Asked Questions (FAQs)
Link copied!
Inverted Hammer Candlestick Pattern
The Inverted Hammer is a single-candle bullish reversal pattern that typically forms after a downtrend. It features a small real body at the lower end of the candle and a long upper shadow, with little to no lower shadow.
Key Takeaways
- This single-candle pattern appears after a downtrend and suggests that selling pressure is weakening, potentially leading to a price reversal to the upside.
- It features a small real body at the bottom and a long upper wick, reflecting a failed attempt by buyers to take control, often an early sign of a shift in momentum.
- Traders should wait for a strong bullish candle after the Inverted Hammer before acting, as the pattern alone isn’t always reliable.
- The Inverted Hammer works across various markets and timeframes, but its effectiveness improves when used with confirmation tools like volume or RSI.
What is the Inverted Hammer Pattern?
The Inverted Hammer is a candlestick formation that often appears at the bottom of a downtrend and signals a possible trend reversal to the upside. Visually, it resembles an upside-down hammer, a small real body at the bottom, with a long upper wick at least twice the length of the body, and little to no lower shadow.
This shape reflects an initial attempt by buyers to reverse the trend. Although sellers manage to bring the price back down by the close, the upward wick shows growing bullish interest. When followed by a bullish candle, it can indicate a genuine shift in sentiment.
Components of the Inverted Hammer Pattern
Understanding the shape of the Inverted Hammer can tell us a lot about who’s in control (buyers or sellers) and what might happen next.
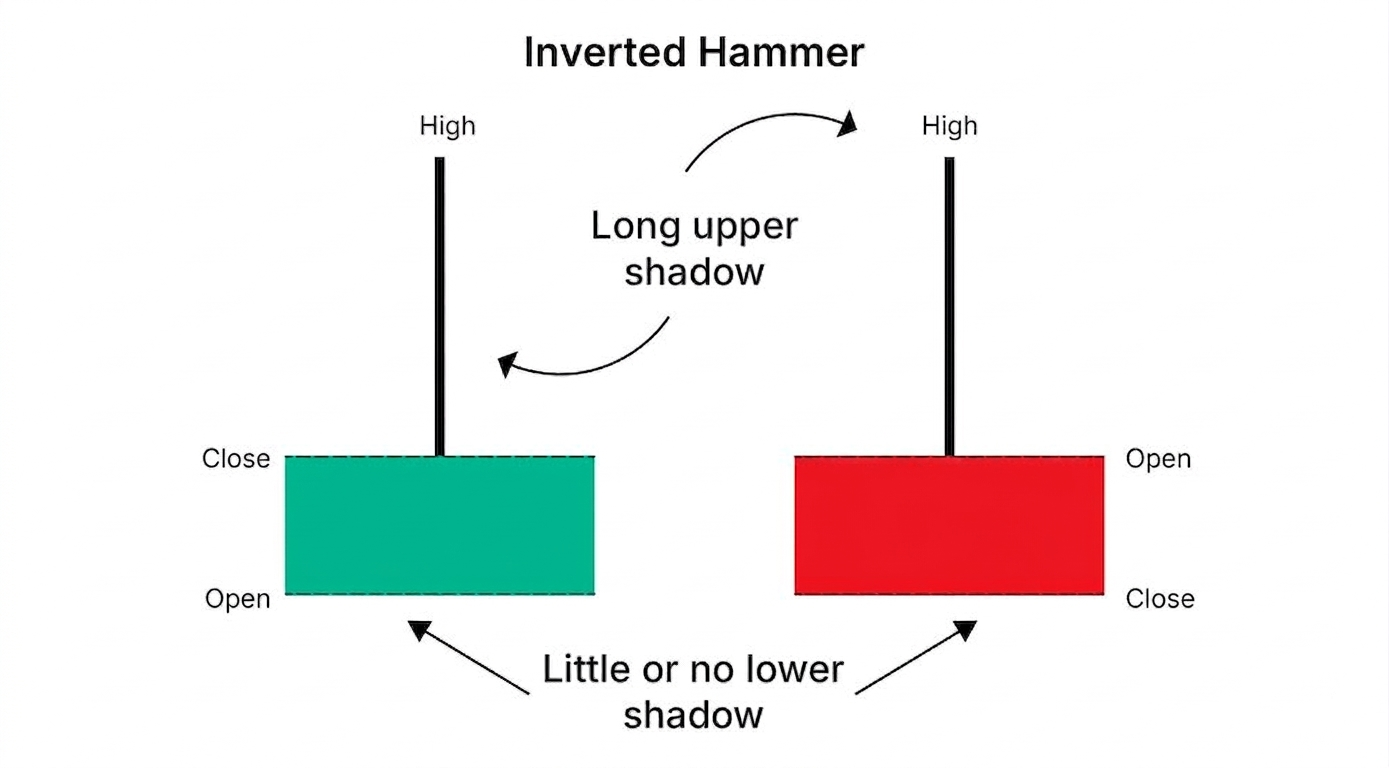
Small Real Body
This part of the candle appears near the bottom and shows that there wasn’t much difference between where the price opened and closed. It signals hesitation in the market, where neither buyers nor sellers have full control.
Long Upper Shadow
The wick above the candle body is long, at least twice the size of the body itself. This indicates that buyers tried to push the price higher during the session, but sellers pulled it back down. Still, the attempt by buyers is a clue that they’re becoming more active.
Little or No Lower Shadow
There is minimal or no wick below the body, which suggests that sellers couldn’t drag the price much lower. This strengthens the idea that downward pressure might be fading.
Overall, this structure hints at a shift. While sellers may have led the trend so far, this candle shows that buyers are stepping in, and if supported by a bullish follow-up candle, a trend reversal could be in play.
Red Inverted Hammer indication
A red Inverted Hammer forms when the closing price is slightly lower than the opening price. It shows that buyers attempted to push prices higher, but sellers managed to pull them back down by the close. Despite this, the long upper wick still indicates buying interest. It is considered a weaker bullish signal compared to a green Inverted Hammer and requires confirmation.
Green Inverted Hammer Indication
A green Inverted Hammer forms when the closing price is higher than the opening price. This indicates stronger buying pressure during the session. Buyers were able to push prices up and hold gains near the close, suggesting improving sentiment. It is generally considered a stronger bullish signal, especially when followed by a confirmation candle.
Psychology Behind the Inverted Hammer Pattern
The Inverted Hammer reflects a moment of hesitation in the market. During a downtrend, sellers start the session strong, but buyers step in with aggressive upward pressure, pushing prices significantly higher during the session. Even though the price eventually closes near the opening level, the long upper shadow is a sign of buying interest returning to the market.
This failed move higher is not necessarily a weakness; it’s a sign that buyers are testing the waters. If they follow up with more strength in the next candle, it confirms their intent to reverse the trend.
How to read the Inverted Hammer Candlestick Pattern in Technical Analysis?
To read the Inverted Hammer, first ensure it appears after a clear downtrend. Then observe the candle structure, a small body at the bottom with a long upper wick, indicating buying attempts.
Next, look for confirmation. A strong bullish candle after the pattern strengthens the reversal signal. Traders often combine it with volume, support levels, or indicators like RSI to validate the setup.
How to Trade the Inverted Hammer Pattern?
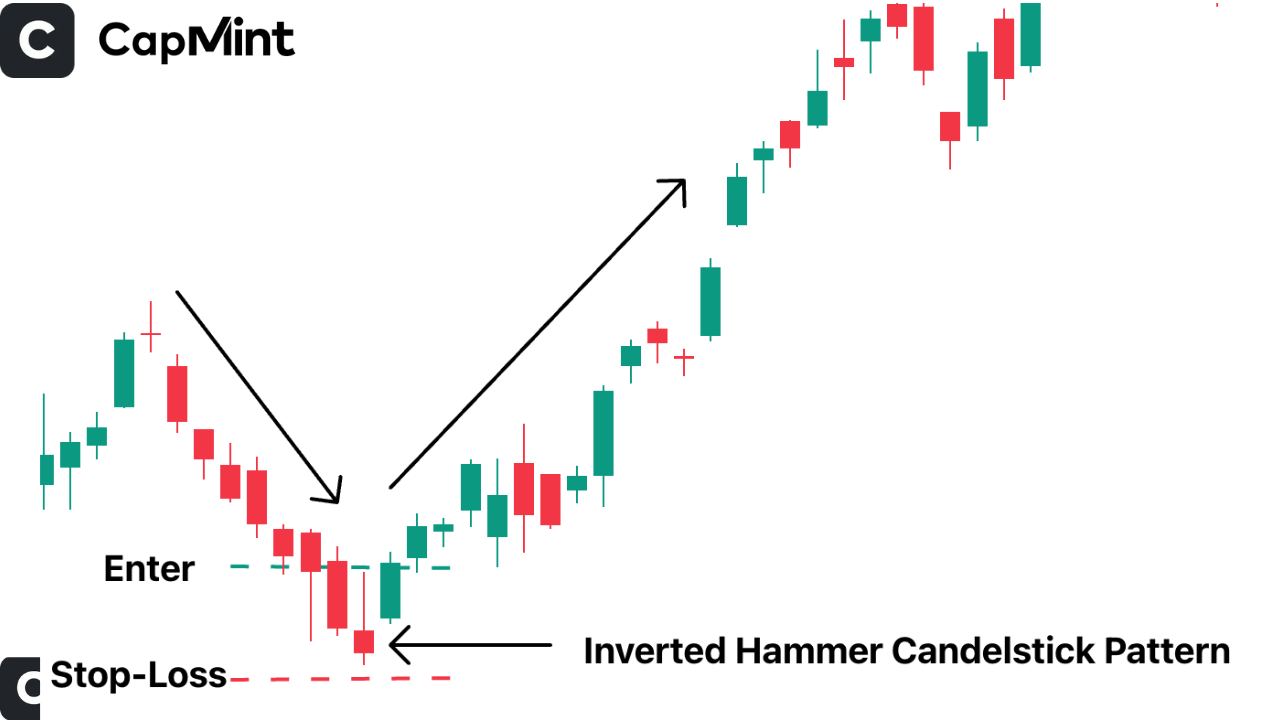
Entry Points
Conservative traders should wait for confirmation before entering, ideally, a strong bullish candle closing above the high of the Inverted Hammer. More aggressive traders may consider entering immediately after the pattern appears, but should manage risk carefully.
Stop-Loss Placement
Place a stop-loss just below the low of the Inverted Hammer. If the market breaks this level, it suggests that bearish control remains dominant.
Profit Targets
Target previous resistance levels, moving averages, or Fibonacci retracement levels. It’s also effective to use a risk-reward ratio such as 1:2 or 1:3 to determine exits.
Advantages and Limitations
Understanding both the benefits and drawbacks of the Hammer pattern can help traders use it more effectively and avoid common mistakes.
Advantages:
The advantages of Inverted Hammer Candlestick patterns are as follows
- Visually Distinct and Easy to Recognise – The Inverted Hammer is easy to spot on a chart because of its clear shape: a small body at the bottom with a long line (wick) above it. This makes it simple for beginners to identify.
- Provides Early Warning of Trend Reversal – It serves as an early heads-up that sellers might be losing control and buyers could be preparing to shift the momentum upward.
- Works Across Assets and Timeframes – Whether you’re trading stocks, crypto, or forex, and whether on intraday charts or long-term timeframes, this pattern holds relevance and utility.
Limitations:
The limitations of Inverted Hammer Candlestick patterns are as follows
- Needs Confirmation for Reliability – Relying on this pattern alone isn’t wise; without a follow-up bullish candle or strong indicator signal, it can often mislead traders.
- Can Appear in Choppy Markets, Leading to False Signals – In sideways or erratic price movements, the pattern can show up frequently, but doesn’t always lead to an actual trend change.
- Doesn’t Predict Strength or Duration of the Move – Even when it works, the Inverted Hammer doesn’t tell you how far or how long the trend might go—it just signals a possible shift.
Conclusion
The Inverted Hammer candlestick pattern is a potentially powerful reversal signal that appears at the bottom of a downtrend. Its shape reflects a tug-of-war between buyers and sellers, with buyers starting to gain strength. While it offers valuable insight into market psychology, it’s important to confirm the signal using volume, RSI, or support levels. When traded with caution and solid risk management, the Inverted Hammer can be a useful addition to any trader’s toolbox.
Frequently Asked Questions (FAQs)
Is the Inverted Hammer bullish or bearish?
It’s a bullish reversal pattern. It suggests that selling pressure is weakening and buyers may soon take control, especially if confirmed by a bullish candle.
Can the Inverted Hammer appear in any trend?
While it can technically appear anywhere, it is only considered significant when it forms after a downtrend, indicating a potential reversal.
How is it different from a Shooting Star?
Both look identical, but their context is different. An Inverted Hammer appears after a downtrend and is bullish. A Shooting Star shows up after an uptrend and signals a bearish reversal.
Should beginners use this pattern?
Yes, but with caution. It’s easy to spot and understand, but beginners should always wait for confirmation to improve their chances of success.
Does volume really matter?
Absolutely. Increased volume after the pattern adds credibility, showing that buyers are stepping in with force.
How is the Inverted Hammer Pattern visually different from a standard hammer or doji?
The Inverted Hammer has a small body at the bottom with a long upper wick, while a hammer has a long lower wick. A doji has almost no body, showing indecision rather than a directional signal.
Why must an inverted hammer appear after a downtrend to be considered valid?
The pattern signals a potential reversal. Without a prior downtrend, it loses context and meaning. Its value lies in indicating that selling pressure may be weakening and buyers are beginning to step in.
How do “green” vs “red” inverted hammers differ in implication and follow-through?
A green Inverted Hammer shows stronger buying pressure and is generally more reliable. A red one still signals buying interest, but is weaker. Both require confirmation, but green candles often lead to better follow-through.
Disclaimer: This content is for educational purposes only and does not constitute financial or investment advice. Investments in securities or other financial instruments are subject to market risk, including partial or total loss of capital. Past performance is not indicative of future results. Always consider your financial situation carefully and consult a licensed financial advisor before making investment or trading decisions.
Table of Content
- Key Takeaways
- What is the Inverted Hammer Pattern?
- Components of the Inverted Hammer Pattern
- Red Inverted Hammer indication
- Green Inverted Hammer Indication
- Psychology Behind the Inverted Hammer Pattern
- How to read the Inverted Hammer Candlestick Pattern in Technical Analysis?
- How to Trade the Inverted Hammer Pattern?
- Advantages and Limitations
- Conclusion
- Frequently Asked Questions (FAQs)
Engineered for the obsessed. Built for traders.

Purpose-built terminals.
Zero compromise.
Built for speed.
Plot No 1290, 2nd Floor, 17th Cross, 5th Main, Sector-7, HSR Layout, Bangalore 560102
Follow us on
Mintcap Brokers Private Limited
CIN – U66110KA2023PTC178706 | Registered Address: Plot No 1290, Second Floor, 17th Cross, 5th Main, Sector-7, HSR Layout, Bangalore 560102 | Tel: 080 – 49552310 | Email ID: compliance@capmint.com | SEBI registered Stock Broker: INZ000322732 | NSE Cash/F&O Member ID: 90430 | BSE Cash/F&O Member ID: 6903 | MCX Member ID: 57400 | NCDEX Member ID: 1312 | SEBI registered Depository Participant: IN-DP-806-2025 | CDSL DP ID: 12102300 | NSE Clearing Member code: M70108 | AMFI-Registered Mutual Fund Distributor: ARN-289109 (Valid upto 28-Feb-2027) | Category II Execution Only Platform : E6903
Details of Client Bank Account
Compliance Officer: Ms. Shridevi Vungarala | Email ID: compliance@capmint.com | Tel no. + 91 9035330126 | Grievance Redressal Officer (GRO) – Ms. Shikha Gupta | Email ID: Grievance@capmint.com | Tel no: 9035331595.
Procedure to file a complaint on SEBI SCORES: Register on SCORES portal. Mandatory details for filing complaints on SCORES: Name, PAN, Address, Mobile Number, E-mail ID. Benefits: Effective Communication, Speedy redressal of the grievances. You may refer the website https://scores.sebi.gov.in/ for more information. You may also download the SEBI Scores app to log a complaint Android: https://play.google.com > store > apps > sebiscores iOS: https://apps.apple.com > app > sebiscores
Disclaimer
Investment in the securities market are subject to market risks, read all the related documents carefully before investing. Brokerage will not exceed the SEBI prescribed limit.
Mutual fund investments are subject to market risks, read all scheme related documents carefully before investing. Mutual Funds are not exchange-traded products.
Attention Investor:
- Stock Brokers can accept securities as margin from clients only by way of pledge in the depository system w.e.f. September 1, 2020.
- Update your mobile number & email Id with your stock broker/depository participant and receive OTP directly from depository on your email id and/or mobile number to create pledge.
- Pay 20% as upfront margin of the transaction value to trade in cash market segment.
- Investors may please refer to the Exchange’s Frequently Asked Questions (FAQs) issued vide circular reference NSE/INSP/45191 dated July 31, 2020 and NSE/INSP/45534 dated August 31, 2020 and other guidelines issued from time to time in this regard.
- Check your Securities /MF/ Bonds in the consolidated account statement issued by NSDL/CDSL every month.