
Link copied!
Piercing Line Pattern
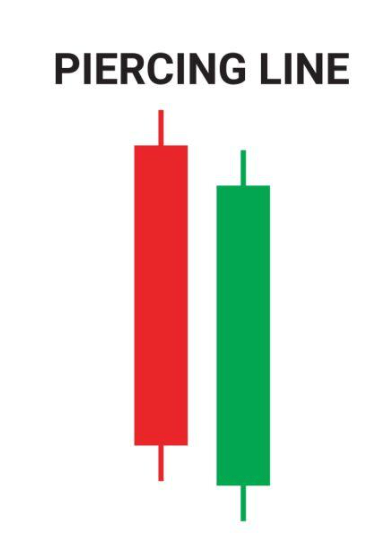
The Piercing Line is a bullish two-candle reversal pattern that appears after a downtrend, where the second candle closes above the midpoint of the first bearish candle, indicating potential trend reversal.
Key Takeaways
- The Piercing Line is a bullish reversal pattern that forms after a downtrend. It consists of a red candle followed by a green candle that opens lower but closes above the middle of the red candle. This suggests that buyers are starting to take control.
- At first, sellers dominate the market, but on the second day, buyers step in and push the price up, showing that the selling pressure is weakening. This shift in control can lead to a potential trend reversal.
- Traders can approach this pattern in two ways: a risk-taker may enter the trade when the price goes above the high of the green candle, while a risk-averse trader may wait for a third candle to confirm the reversal. A stop loss is usually placed just below the low of the green candle.
- While the Piercing Line pattern is useful, it’s not always reliable on its own. It works best in a clean downtrend and should be confirmed with other signals like volume, RSI, or a strong follow-up candle to avoid false breakouts.
What is a Piercing Pattern Candlestick?
A piercing line candlestick pattern is a bullish reversal pattern, changing from a short-term downtrend to an uptrend. A piercing line pattern is formed in a downtrend in the first candlestick, and a long bearish (red) candle shows strong selling pressure.
The second candle opens lower than the previous day’s low, creating a gap down, but buyers take control during the session and push the price up. It closes above the midpoint of the first candle’s body, forming a strong bullish signal.
Here is the image of the Piercing Line pattern
Psychology Behind The Formation Of Piercing Line Pattern
- Initially, the market is in a downtrend, clearly dominated by sellers, as seen in the formation of a long, bearish (red) candle. This candle reflects strong negative sentiment and continued selling pressure.
- The next day, the market opens with a gap down, indicating that sellers still hold control and the bearish sentiment may continue. However, instead of continuing to fall, buyers step in aggressively and begin to push the price upward.
- As the session progresses, the buying pressure strengthens, and the bullish (green) candle closes above the midpoint of the previous red candle. This is a significant shift in market psychology.
- This sudden and strong buying activity suggests that the sellers are losing momentum, and buyers are starting to take control. The deeper the green candle closes into the red candle’s body, the stronger the signal.
- The pattern reflects a shift from a bearish sentiment to a potential bullish reversal, especially if followed by confirmation in the next candle (like another bullish candle or volume spike).
Trading the Piercing Line Pattern
Risk-Taker Entry
- Enter the trade as soon as the price moves above the high of the second (green) candle in the Piercing Line pattern.
- This gives you an early entry, but the risk is slightly higher due to limited confirmation of the reversal.
Risk-Averse Entry
- Wait for the next (third) candle to close above the high of the first (red) candle.
- This offers a stronger confirmation that bulls are in control, though the entry will be at a slightly higher price.
Confirmation
For additional confirmation, you can look for:
- An increase in volume on the green candle.
- A bullish third candle that breaks previous resistance levels.
- Support from technical indicators like RSI or MACD is turning bullish.
Stop Loss
Place your stop loss just below the low of the green (second) candle in the pattern.
Alternatively, for better risk management, place the stop loss near a recent swing low or major support level.
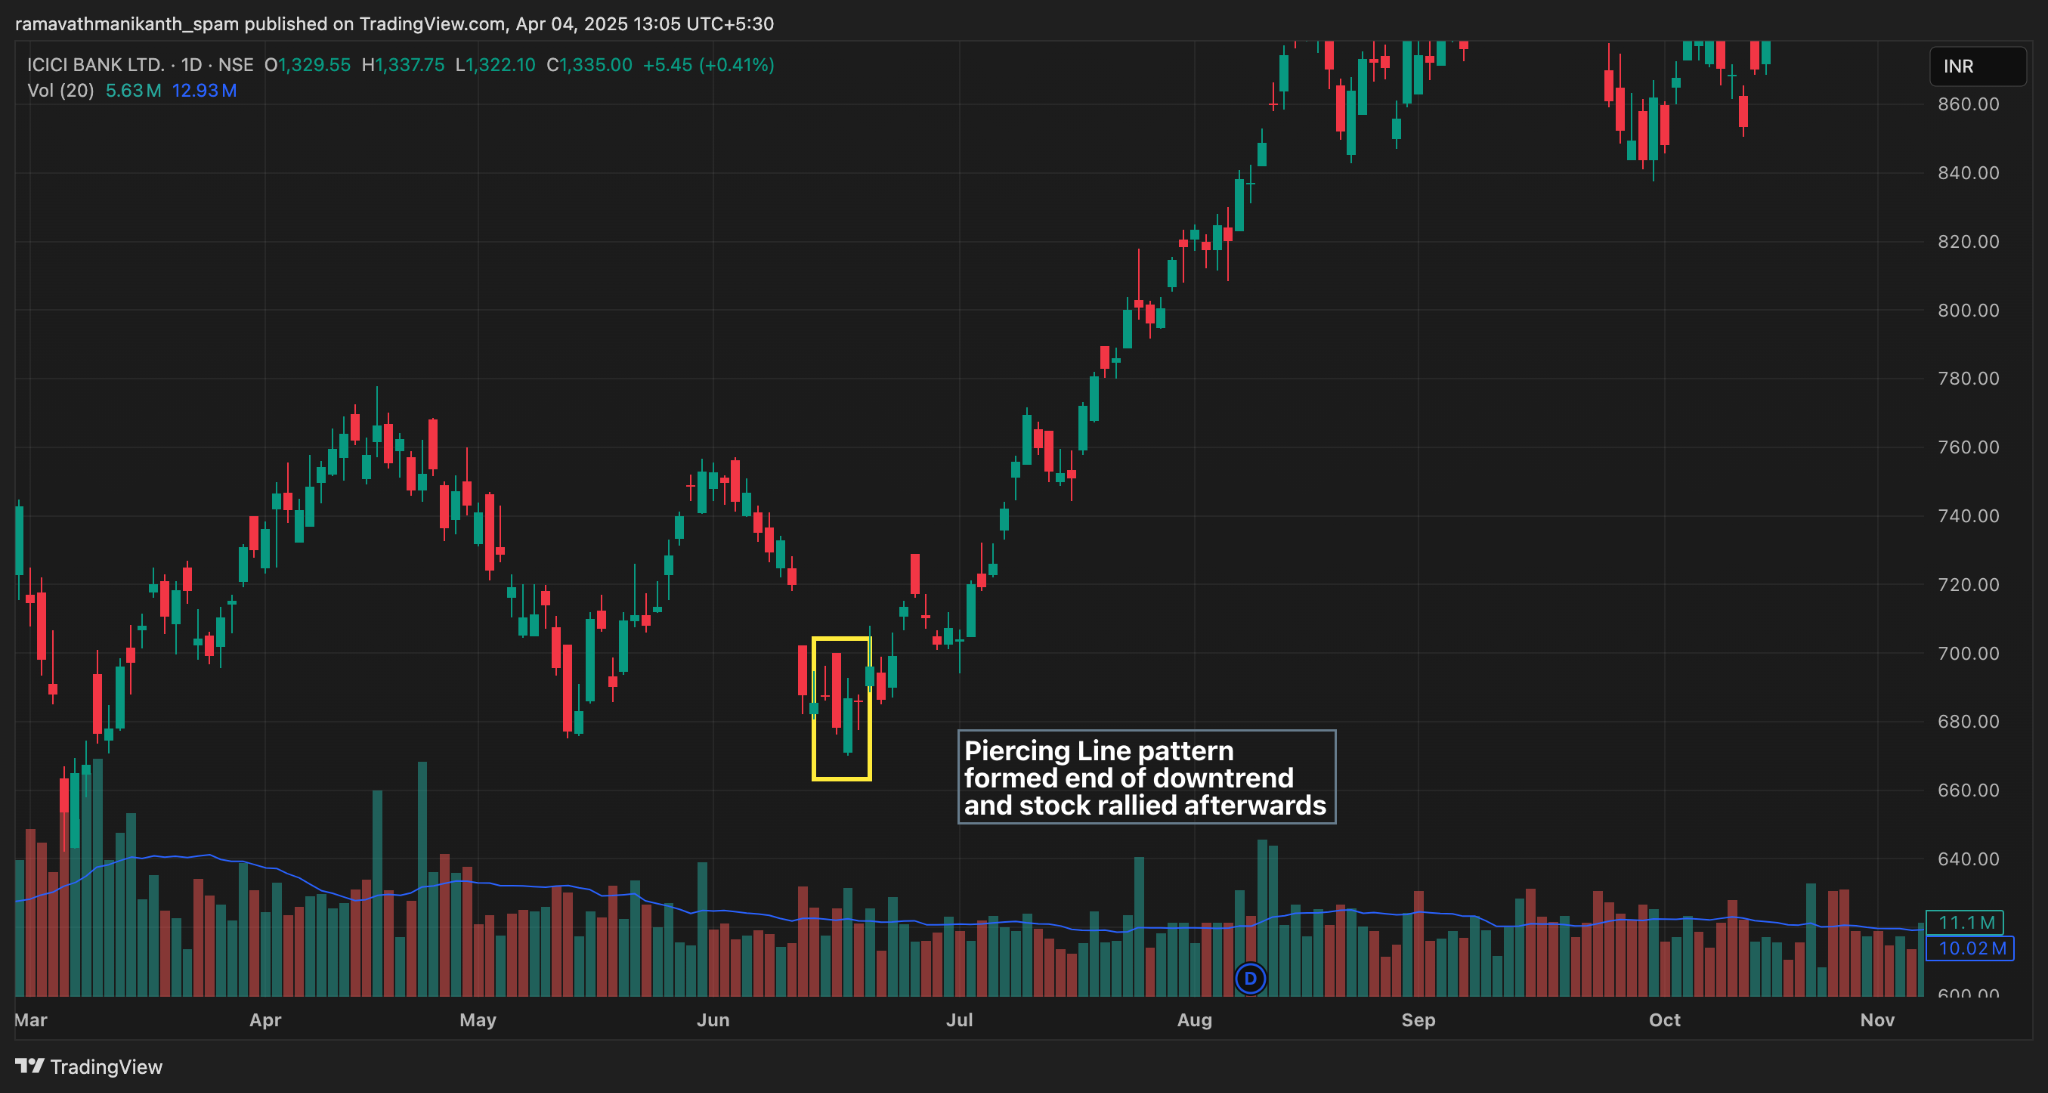
A Piercing Line pattern formed in ICICI Bank after a clear downtrend. The first candle was a strong, bearish red candle, closing around ₹650.
The next day, the price opened lower near ₹640, but buyers stepped in and pushed the price up, forming a bullish green candle that closed around ₹675 above the 50% mark of the previous red candle’s body.
This shift in momentum signalled a potential reversal. The following candles confirmed the bullish move, and the stock rallied sharply from ₹675 to over ₹880 in the coming weeks.
Entry Of Piercing Pattern
For this example of the Piercing Line pattern on ICICI Bank, a risk-taker would enter the trade as soon as the price breaks above the high of the second (green) candle, which is around ₹678–₹680. This allows for an early entry with a better potential upside but comes with slightly higher risk due to limited confirmation.
On the other hand, a risk-averse trader would wait for stronger confirmation, specifically, a third candle that closes above the high of the first (red) candle, which is around ₹685. This means their entry would be slightly higher, around ₹686–₹688, but with greater confidence in the trend reversal.
Limitations Of Piercing Pattern
A piercing line pattern is a great candlestick to trade with, but there are also downsides to it
Piercing Pattern Requires Confirmation
The Piercing Line pattern alone does not guarantee a trend reversal. While the green candle closing above the midpoint of the previous red candle is a positive sign, it’s not conclusive. Without a third candle showing a bullish continuation or a volume spike, the pattern can easily fail. Many traders get trapped if they enter purely based on the two-candle setup.
Less Reliable in Sideways or Choppy Markets
The Piercing Line pattern works best during clear downtrends. If the market is moving sideways or is highly volatile, this pattern can produce false signals. In such environments, prices may appear to reverse briefly but then continue downwards, resulting in losses.
Conclusion
The Piercing Line is a bullish two-candle reversal pattern that forms after a downtrend. It signals a shift in market sentiment as buyers step in strongly. Best used with confirmation tools like volume or RSI, it offers clear entry and stop-loss strategies but works best in trending markets.
Frequently Asked Questions (FAQs)
Is a Piercing Line pattern bullish or bearish?
It’s a bullish reversal pattern. It shows that buyers are starting to take control after a downtrend.
What is the Piercing Line in price action?
It’s a two-candle pattern where a big red candle is followed by a green candle that opens lower but closes above the middle of the red candle, signalling a possible trend reversal to the upside.
What is the success rate of the piercing pattern?
The piercing pattern does not have a fixed success rate, as it depends on market conditions and confirmation. It tends to work better in strong downtrends with support from volume or indicators, but can give false signals in sideways markets.
Disclaimer: This content is for educational purposes only and does not constitute financial or investment advice. Investments in securities or other financial instruments are subject to market risk, including partial or total loss of capital. Past performance is not indicative of future results. Always consider your financial situation carefully and consult a licensed financial advisor before making investment or trading decisions.
Engineered for the obsessed. Built for traders.

Purpose-built terminals.
Zero compromise.
Built for speed.
Plot No 1290, 2nd Floor, 17th Cross, 5th Main, Sector-7, HSR Layout, Bangalore 560102
Follow us on
Mintcap Brokers Private Limited
CIN – U66110KA2023PTC178706 | Registered Address: Plot No 1290, Second Floor, 17th Cross, 5th Main, Sector-7, HSR Layout, Bangalore 560102 | Tel: 080 – 49552310 | Email ID: compliance@capmint.com | SEBI registered Stock Broker: INZ000322732 | NSE Cash/F&O Member ID: 90430 | BSE Cash/F&O Member ID: 6903 | MCX Member ID: 57400 | NCDEX Member ID: 1312 | SEBI registered Depository Participant: IN-DP-806-2025 | CDSL DP ID: 12102300 | NSE Clearing Member code: M70108 | AMFI-Registered Mutual Fund Distributor: ARN-289109 (Valid upto 28-Feb-2027) | Category II Execution Only Platform : E6903
Details of Client Bank Account
Compliance Officer: Ms. Shridevi Vungarala | Email ID: compliance@capmint.com | Tel no. + 91 9035330126 | Grievance Redressal Officer (GRO) – Ms. Shikha Gupta | Email ID: Grievance@capmint.com | Tel no: 9035331595.
Procedure to file a complaint on SEBI SCORES: Register on SCORES portal. Mandatory details for filing complaints on SCORES: Name, PAN, Address, Mobile Number, E-mail ID. Benefits: Effective Communication, Speedy redressal of the grievances. You may refer the website https://scores.sebi.gov.in/ for more information. You may also download the SEBI Scores app to log a complaint Android: https://play.google.com > store > apps > sebiscores iOS: https://apps.apple.com > app > sebiscores
Disclaimer
Investment in the securities market are subject to market risks, read all the related documents carefully before investing. Brokerage will not exceed the SEBI prescribed limit.
Mutual fund investments are subject to market risks, read all scheme related documents carefully before investing. Mutual Funds are not exchange-traded products.
Attention Investor:
- Stock Brokers can accept securities as margin from clients only by way of pledge in the depository system w.e.f. September 1, 2020.
- Update your mobile number & email Id with your stock broker/depository participant and receive OTP directly from depository on your email id and/or mobile number to create pledge.
- Pay 20% as upfront margin of the transaction value to trade in cash market segment.
- Investors may please refer to the Exchange’s Frequently Asked Questions (FAQs) issued vide circular reference NSE/INSP/45191 dated July 31, 2020 and NSE/INSP/45534 dated August 31, 2020 and other guidelines issued from time to time in this regard.
- Check your Securities /MF/ Bonds in the consolidated account statement issued by NSDL/CDSL every month.