
Table of Content
Link copied!
Spinning Top Candlestick Pattern
A Spinning Top is a candlestick pattern characterised by a small real body and long upper and lower shadows. It indicates indecision in the market, where neither buyers nor sellers gain control.
Key Takeaways
- Indecision in the Market – The Spinning Top shows a balance between buying and selling pressures. It suggests that the current trend might be losing momentum, as neither bulls nor bears are in control.
- Not a Standalone Signal – This pattern should not be used alone to make trading decisions. Confirmation from other indicators or candlesticks is essential to avoid false signals and increase trade accuracy.
- Appears in Uptrends or Downtrends – When it appears after a strong trend (up or down), it can signal a potential reversal or short-term pause, prompting traders to reassess their positions.
- Useful Early Warning Sign – The Spinning Top can act as an early warning that a trend is weakening. This gives traders time to adjust strategies before a potential shift in market direction occurs.
What is the Spinning Top Candlestick?
The Spinning Top is a single-candlestick pattern that reflects market indecision. It has a small body, showing that the open and close prices were close together, and long shadows on both ends, indicating that prices moved significantly in both directions during the session.
This pattern doesn’t predict the direction of the breakout, but it warns traders that the current trend may be weakening and that a reversal or consolidation might be around the corner.
Components of the Spinning Top Pattern
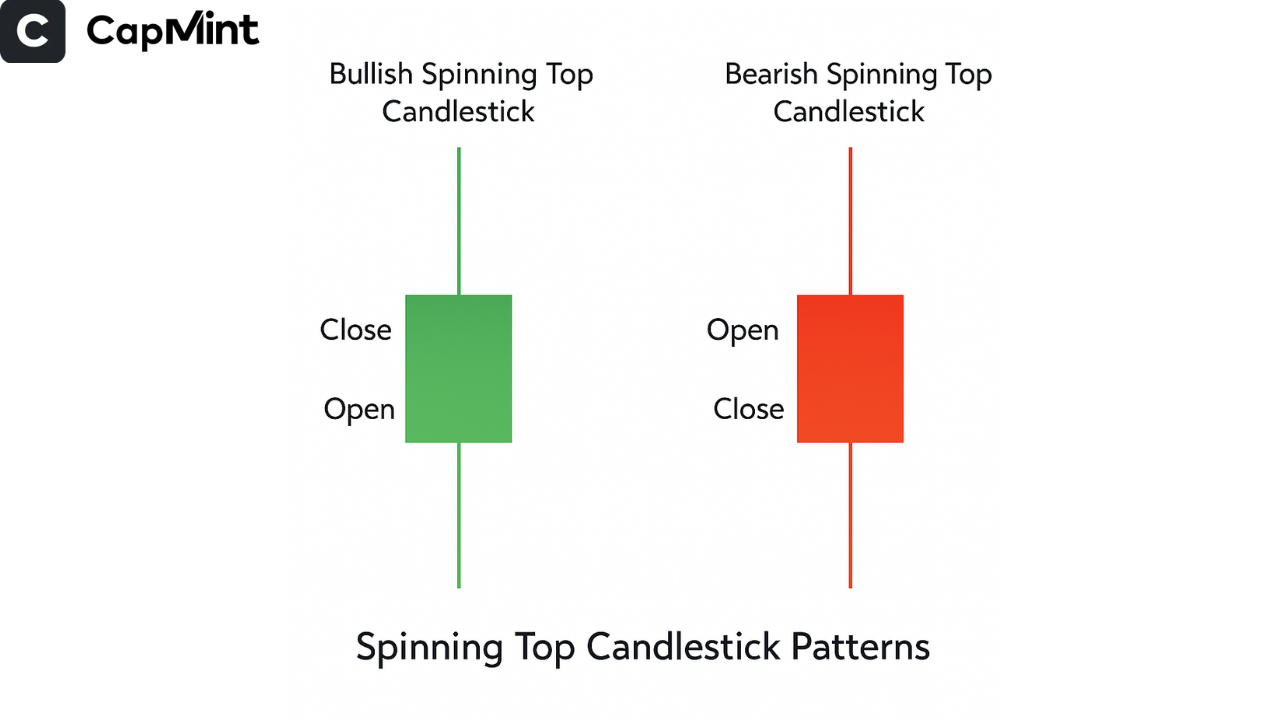
Small Real Body
The open and close prices are very close to each other, forming a narrow candle body. This shows a lack of clear direction.
Long Upper Shadow
Indicates that buyers tried to push the price up, but couldn’t maintain it.
Long Lower Shadow
Shows that sellers tried to pull the price down, but buyers brought it back up.
These combined signals represent a tug-of-war between bulls and bears, ending in a draw.
How is the Spinning Top Candlestick Formed?
A Spinning Top is formed when the opening and closing prices are very close to each other, creating a small real body. During the session, price moves significantly both upward and downward, forming long upper and lower shadows.
This movement shows that both buyers and sellers were active, but neither side could gain control by the close. The result is a candle that reflects indecision, where the market moves in both directions but settles near its starting point.
The formation becomes more meaningful when it appears after a strong trend, as it indicates that momentum may be slowing down, and a potential reversal or pause could follow.
Psychology Behind the Pattern
The Spinning Top represents uncertainty and hesitation in the market. During the trading session, both buyers and sellers were active and tried to move prices in their respective directions. However, neither side was able to dominate by the end of the session.
This uncertainty causes traders to pause and reassess their positions, especially if the Spinning Top appears after a strong trend. It may signal that traders are losing confidence in the current direction, and a reversal or consolidation could follow.
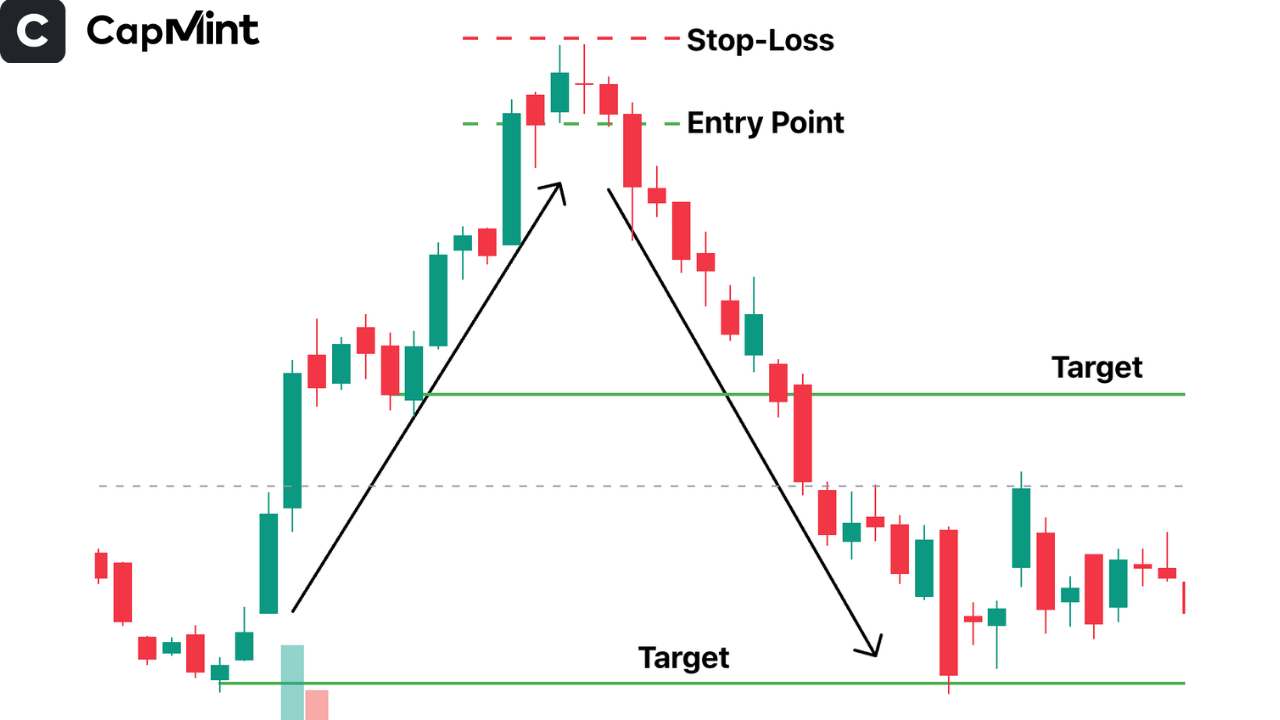
How to Trade the Spinning Top Candlestick?
Entry Points
Wait for confirmation before entering a trade (once the candle closes below the spinning top). If the Spinning Top appears at the top of an uptrend and is followed by a bearish candle, it may signal a sell opportunity. Similarly, if it appears at the bottom of a downtrend and is followed by a bullish candle, it could be a buy signal.
Stop-Loss Placement
Place a stop-loss above the high (for short trades) or below the low (for long trades) of the confirmation candle to manage risk.
Profit Targets
Use previous support/resistance levels, moving averages, or risk-reward ratios to set profit targets. You can also use a simple 1:1 or 1:2 ratio as your target levels.
Confirming the Pattern
The Spinning Top should always be validated with additional tools or indicators to ensure reliability. Confirming signals helps traders avoid acting on potentially misleading candlestick formations.
Volume
A notable increase in volume on the candle following a Spinning Top enhances the validity of a potential reversal. It reflects strong market participation, which adds credibility to the signal.
RSI or MACD
When the Spinning Top coincides with divergence or crossover signals on RSI or MACD, it strengthens the likelihood of a directional change in price.
Support/Resistance Zones
The pattern becomes significantly more reliable when it forms near well-established support or resistance zones, where market reactions are typically more predictable.
Advantages and Limitations
Advantages:
- Easy to Recognise: This candlestick pattern is simple to spot, making it great for beginners. Its distinct shape makes it easy to identify on any chart without advanced skills.
- Useful in Spotting Trend Exhaustion: It can act as an early sign that the current trend is losing strength. Traders can use this signal to prepare for a possible reversal or slowdown.
- Applicable to All Markets: Whether you’re trading stocks, forex, or crypto, and whether you’re looking at hourly or daily charts, the Spinning Top pattern can be useful across all timeframes.
Limitations:
- Needs Confirmation: Relying only on this pattern can lead to poor decisions. It’s important to confirm the signal using other indicators or candlestick formations before taking action.
- May Appear Frequently in Sideways Markets: In markets that lack a strong direction, this pattern can appear often, creating a lot of noise and increasing the chance of false signals.
- Doesn’t Show Direction: While it tells us there’s indecision in the market, it doesn’t clearly point to whether the price will go up or down next.
Conclusion
The Spinning Top candlestick pattern is a visual cue that market participants are unsure about the next move. While it doesn’t predict direction, it alerts traders to potential changes in trend or pauses. When combined with other technical tools like volume, RSI, and support/resistance zones, it becomes a valuable addition to a trader’s strategy.
Frequently Asked Questions (FAQs)
Is the Spinning Top pattern bullish or bearish?
The Spinning Top pattern is considered neutral by itself. It reflects market indecision, and traders must wait for the next candlestick to confirm a bullish or bearish move.
Can it appear in any trend?
Yes, the Spinning Top can appear during both uptrends and downtrends. When it forms after a strong trend, it may suggest that the trend is weakening or reaching a turning point.
Should beginners use this pattern?
Absolutely, beginners can use the Spinning Top pattern because it’s easy to recognize. However, it’s important to always confirm the pattern with other tools before making any trade.
Does volume matter in this pattern?
Yes, volume adds important context. A rise in volume after the Spinning Top appears can help confirm that a reversal is more likely to happen, making the signal stronger.
Is it effective in all timeframes?
Yes, it works well in all timeframes—whether you’re trading intraday, daily, or weekly charts. That said, signals on higher timeframes tend to be more reliable and meaningful.
Disclaimer: This content is for educational purposes only and does not constitute financial or investment advice. Investments in securities or other financial instruments are subject to market risk, including partial or total loss of capital. Past performance is not indicative of future results. Always consider your financial situation carefully and consult a licensed financial advisor before making investment or trading decisions.
Table of Content
Engineered for the obsessed. Built for traders.

Purpose-built terminals.
Zero compromise.
Built for speed.
Plot No 1290, 2nd Floor, 17th Cross, 5th Main, Sector-7, HSR Layout, Bangalore 560102
Follow us on
Mintcap Brokers Private Limited
CIN – U66110KA2023PTC178706 | Registered Address: Plot No 1290, Second Floor, 17th Cross, 5th Main, Sector-7, HSR Layout, Bangalore 560102 | Tel: 080 – 49552310 | Email ID: compliance@capmint.com | SEBI registered Stock Broker: INZ000322732 | NSE Cash/F&O Member ID: 90430 | BSE Cash/F&O Member ID: 6903 | MCX Member ID: 57400 | NCDEX Member ID: 1312 | SEBI registered Depository Participant: IN-DP-806-2025 | CDSL DP ID: 12102300 | NSE Clearing Member code: M70108 | AMFI-Registered Mutual Fund Distributor: ARN-289109 (Valid upto 28-Feb-2027) | Category II Execution Only Platform : E6903
Details of Client Bank Account
Compliance Officer: Ms. Shridevi Vungarala | Email ID: compliance@capmint.com | Tel no. + 91 9035330126 | Grievance Redressal Officer (GRO) – Ms. Shikha Gupta | Email ID: Grievance@capmint.com | Tel no: 9035331595.
Procedure to file a complaint on SEBI SCORES: Register on SCORES portal. Mandatory details for filing complaints on SCORES: Name, PAN, Address, Mobile Number, E-mail ID. Benefits: Effective Communication, Speedy redressal of the grievances. You may refer the website https://scores.sebi.gov.in/ for more information. You may also download the SEBI Scores app to log a complaint Android: https://play.google.com > store > apps > sebiscores iOS: https://apps.apple.com > app > sebiscores
Disclaimer
Investment in the securities market are subject to market risks, read all the related documents carefully before investing. Brokerage will not exceed the SEBI prescribed limit.
Mutual fund investments are subject to market risks, read all scheme related documents carefully before investing. Mutual Funds are not exchange-traded products.
Attention Investor:
- Stock Brokers can accept securities as margin from clients only by way of pledge in the depository system w.e.f. September 1, 2020.
- Update your mobile number & email Id with your stock broker/depository participant and receive OTP directly from depository on your email id and/or mobile number to create pledge.
- Pay 20% as upfront margin of the transaction value to trade in cash market segment.
- Investors may please refer to the Exchange’s Frequently Asked Questions (FAQs) issued vide circular reference NSE/INSP/45191 dated July 31, 2020 and NSE/INSP/45534 dated August 31, 2020 and other guidelines issued from time to time in this regard.
- Check your Securities /MF/ Bonds in the consolidated account statement issued by NSDL/CDSL every month.