
Link copied!
Tweezers Patterns
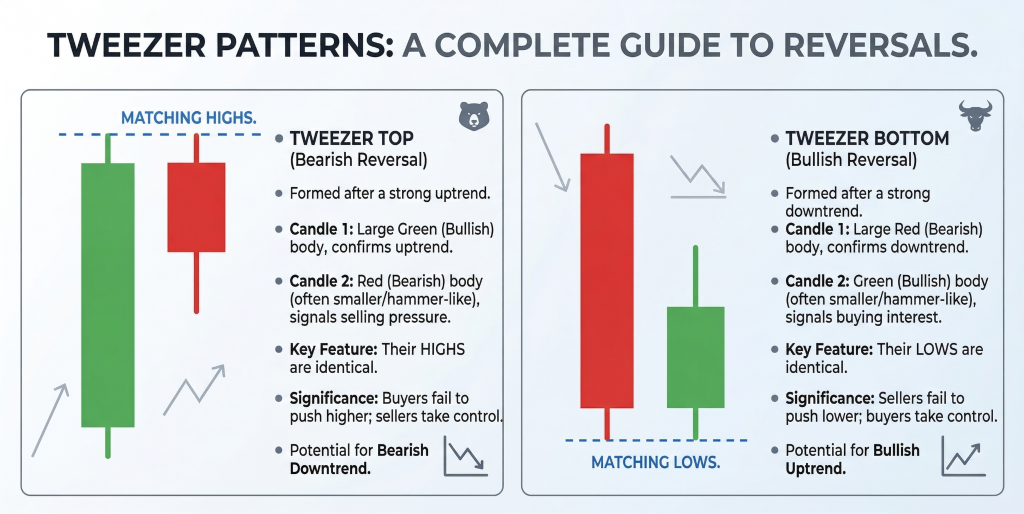
Tweezers are a candlestick pattern that signals a possible reversal in trend. It forms when two candles have almost the same high (tweezer top) or the same low (tweezer bottom), showing that the price failed to move beyond a certain level.
Key Takeaways
- Tweezer patterns are two-candle reversal signals that form at the top or bottom of a trend. When both candles have the same high, it’s a Tweezer Top (bearish). When they have the same low, it’s a Tweezer Bottom (bullish).
- Tweezer Bottom appears after a downtrend and shows that selling pressure is weakening. This hints at a possible price reversal to the upside.
- Tweezer Top forms after an uptrend and suggests that buying momentum is slowing down, indicating a potential move down in price.
- These patterns are stronger when confirmed by a third candle and should always be used with a proper stop-loss to manage risk.
Tweezer Top & Bottom Candlestick Patterns
These patterns are also known as tweezers. They look similar but vary in colour depending on whether they are found after an uptrend or a downtrend. They consist of two consecutive candles with matching highs (tweezer top) or matching lows (tweezer bottom).
One practical point worth noting upfront: “matching” highs or lows rarely means exact-to-the-paisa equality on Indian stocks. A difference of ₹0.50 to ₹2 on a stock trading in the ₹500–1,500 range is generally acceptable for the pattern to be considered valid. What matters is that the price tested the same zone twice and was rejected both times.
Now, let’s take a closer look at tweezers by discussing the tweezer tops and tweezer bottoms separately.
Understanding Tweezer Bottom
To fully grasp its importance, it’s helpful to see how the pattern actually forms on the chart.
Formation of Tweezer Bottom
It is a potential bullish reversal pattern, called a tweezer bottom, because it is found after a downtrend. The prerequisites for a tweezer bottom candlestick pattern are:
- The prior trend should be a downtrend.
- The first candle should be red, confirming the bearishness in the market.
- The second candle should be green and have a low that matches or is very close to the low of the first red candle.
Let’s examine the tweezer bottom pattern, which forms at the bottom of a downtrend, for a better understanding.
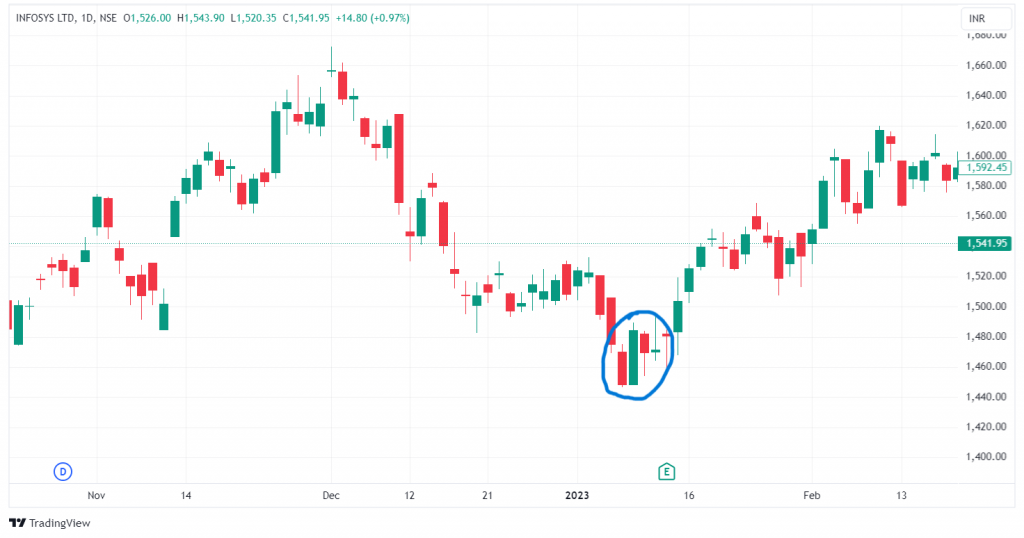
As you can see in the above chart, Infosys stock rallied significantly after the formation of the tweezer bottom. This pattern, formed after a downtrend with both candles having similar lows, indicates a potential bullish reversal.
Psychology of Tweezer Bottom Formation
Initially, the market was in a downtrend, dominated by sellers, as shown by the large bearish (red) candle. This sizeable bearish candle confirms the ongoing negative sentiment in the market.
The next candlestick, a bullish (green) candle, forms with a low that matches or is very close to the low of the previous red candle. This matching low suggests that the selling pressure is weakening, and buyers are starting to step in. Essentially, the market tested a particular price level on day one and failed to push below it, and on day two, sellers made another attempt at the same level and were rejected again. This double rejection is what gives the pattern its significance.
The green candle’s appearance indicates buyers are becoming more active, although their presence still needs to be stronger to reverse the trend completely.
This pattern signals that the downtrend might be losing its momentum if buyers continue to gain strength. The signal becomes more meaningful when the matching low coincides with a known horizontal support level or a round-number price point, as these zones naturally attract buying interest.
Let’s look at how to trade a tweezer bottom.
Trade Setup for a Tweezer Bottom
Now that you understand the tweezer bottom candlestick pattern, let’s discuss how to trade it. This pattern shows a potential bullish reversal, so it’s a good time to look for buying opportunities in the stock.
Entry:
- Risk-Taker: Buy as soon as the price moves above the high of the second (green) candle. This gives an early entry but comes with a higher risk due to limited confirmation.
- Risk-Averse: Wait for the third candle to close above the high of the second (green) candle. This offers more confirmation of a trend reversal, but at a slightly higher price. The trade-off here is real. On strongly reversing stocks, waiting for the third candle can mean entering 1.5–2% higher than the risk-taker’s entry, which directly affects the risk-reward ratio. Balancing between the two often depends on how closely the matching lows align and whether volume on the green candle was notably above average.
Confirmation:
Make sure the third candle closes higher than the high of the second (green) candle to confirm the bullish reversal. Volume on the confirmation day adds conviction. A third candle that closes higher but on declining volume is less reassuring than one accompanied by a visible uptick in participation.
Stop-Loss:
Place your stop-loss just below the low of the second (green) candle to protect yourself if the pattern fails. Since both candles share nearly the same low, this stop level represents the point where the double-rejection thesis is invalidated. If the price breaks below the matching lows, the pattern has failed and holding the position further exposes you to continued downside.
Tweezer Top
After understanding what a Tweezer Bottom candlestick pattern indicates, let’s break down how the Tweezer Top is formed on the chart.
Formation of Tweezer Top
The difference between the tweezer top and the bottom is that the top is formed after an uptrend. The prerequisites for the formation of a tweezer top are:
- The prior trend should be an uptrend.
- The first candle should be green, confirming the bullishness in the market.
- The second candle should be red and have a high that matches or is very close to the high of the first green candle.
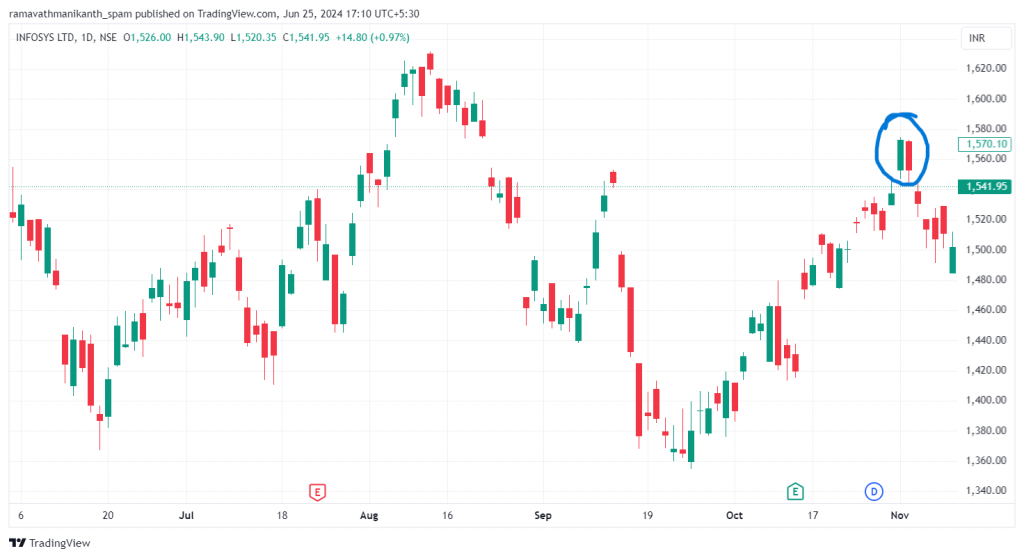
In the above chart, you can see they are formed in an uptrend; the OHLC of the above candlesticks are:
First candle: Open = 1,553 High = 1,575 Low = 1,547 Close = 1,573
Second candle: Open = 1,572 High = 1,572 Low = 1,545 Close = 1,553
We can see the high prices of both candles match (1,575 and 1,572, within ₹3 of each other), confirming the tweezer top candlestick pattern. This slight difference in highs is typical of how the pattern appears in real market conditions, as opposed to textbook illustrations where the highs are perfectly identical.
Psychology Behind Tweezer Top
The psychology behind the formation of the tweezer top is as follows:
Initially, the market was in an uptrend, dominated by buyers, as shown by the large bullish (green) candle. This sizeable green candle confirms the ongoing positive sentiment in the market.
The next candlestick, a bearish (red) candle, forms with a high matching or very close to the previous green candle’s high. This matching high suggests that buying pressure is failing to push prices beyond a certain level.
This indicates that sellers are starting to step in at that price zone, though the selling may not yet be strong enough to reverse the trend completely.
The pattern signals that the uptrend might be losing momentum. If sellers continue to gain strength, a reversal from bullish to bearish could be on the horizon. The signal is especially worth watching when the matching highs coincide with a prior resistance level or a psychologically significant round number, as these zones tend to attract profit-booking.
Trade Setup for Tweezer Top
Entry:
- Risk-Taker: Sell as soon as the price moves below the low of the second (red) candle. This gives an early entry but carries a higher risk due to limited confirmation.
- Risk-Averse: Wait for the third candle to close below the low of the second (red) candle. This provides stronger confirmation of a bearish reversal, though at a slightly later entry point. In fast-moving sell-offs, the third candle can sometimes gap down at the open, making the entry significantly worse than the risk-taker’s level. This is a recurring trade-off with confirmation-based entries on bearish patterns, where downside moves tend to develop faster than upside reversals.
Confirmation:
Ensure the third candle closes below the low of the second (red) candle to confirm the downtrend. A third candle that not only closes lower but does so on rising volume provides the strongest confirmation that the reversal has institutional participation behind it.
Stop-Loss:
Place your stop-loss just above the high of the second (red) candle to limit losses in case the pattern fails. Since both candles share nearly the same high, this level represents a clear invalidation point. If the price breaks above the matching highs, the double-rejection at that level has failed and remaining in the trade is no longer justified.
Tweezer Top vs Tweezer Bottom
| Feature | Tweezer Top | Tweezer Bottom |
|---|---|---|
| Trend Context | Forms after an uptrend | Forms after a downtrend |
| Signal | Bearish reversal | Bullish reversal |
| Matching Level | Both candles share nearly the same high | Both candles share nearly the same low |
| First Candle | Green (bullish) | Red (bearish) |
| Second Candle | Red (bearish) | Green (bullish) |
| Stop-Loss Placement | Above the matching highs | Below the matching lows |
Conclusion
Tweezer Top and Tweezer Bottom are useful candlestick reversal patterns that provide early signals of a potential shift in market direction. The Tweezer Bottom forms after a downtrend with two candles showing matching lows, indicating that sellers are losing control and buyers may step in.
On the other hand, the Tweezer Top appears after an uptrend with matching highs, signalling that buying pressure is fading and a reversal could follow. While these patterns offer useful insights, confirmation from a third candle and proper stop-loss placement are essential to manage risk. The patterns tend to be most reliable on daily timeframes and on stocks with sufficient liquidity, where the matching highs or lows reflect genuine supply-demand dynamics rather than thin order book artefacts. When used alongside other technical tools such as RSI, volume analysis, and support/resistance mapping, tweezers can enhance trading accuracy and timing.
Frequently Asked Questions (FAQs)
What is a tweezer top and a tweezer bottom?
A Tweezer Top is a bearish reversal pattern that appears after an uptrend, with two candles showing nearly the same high. A Tweezer Bottom is a bullish reversal pattern that forms after a downtrend, with two candles showing nearly the same low. Both signal a possible change in trend direction by showing that the price was rejected at the same level twice in consecutive sessions.
What is the tweezer top confirmation?
A Tweezer Top is confirmed when a third candle closes below the low of the second (red) candle, showing that sellers are taking control and the reversal is likely to continue. Higher volume on the confirmation candle adds further reliability to the signal.
How reliable are Tweezer Top and Bottom patterns?
They are moderately reliable on their own, but become stronger when combined with support and resistance levels, volume confirmation, and other indicators like RSI or MACD. On daily charts of liquid stocks, the pattern tends to produce more dependable signals than on lower intraday timeframes where noise is higher.
Can beginners use Tweezer patterns for trading?
Yes, but beginners should avoid relying on them alone. It’s better to use them alongside trend analysis and confirmation indicators to reduce risk. Starting by identifying these patterns in historical charts before trading them live helps build familiarity with how they behave across different market conditions.
Disclaimer: This content is for educational purposes only and does not constitute financial or investment advice. Investments in securities or other financial instruments are subject to market risk, including partial or total loss of capital. Past performance is not indicative of future results. Always consider your financial situation carefully and consult a licensed financial advisor before making investment or trading decisions.
Engineered for the obsessed. Built for traders.

Purpose-built terminals.
Zero compromise.
Built for speed.
Plot No 1290, 2nd Floor, 17th Cross, 5th Main, Sector-7, HSR Layout, Bangalore 560102
Follow us on
Mintcap Brokers Private Limited
CIN – U66110KA2023PTC178706 | Registered Address: Plot No 1290, Second Floor, 17th Cross, 5th Main, Sector-7, HSR Layout, Bangalore 560102 | Tel: 080 – 49552310 | Email ID: compliance@capmint.com | SEBI registered Stock Broker: INZ000322732 | NSE Cash/F&O Member ID: 90430 | BSE Cash/F&O Member ID: 6903 | MCX Member ID: 57400 | NCDEX Member ID: 1312 | SEBI registered Depository Participant: IN-DP-806-2025 | CDSL DP ID: 12102300 | NSE Clearing Member code: M70108 | AMFI-Registered Mutual Fund Distributor: ARN-289109 (Valid upto 28-Feb-2027) | Category II Execution Only Platform : E6903
Details of Client Bank Account
Compliance Officer: Ms. Shridevi Vungarala | Email ID: compliance@capmint.com | Tel no. + 91 9035330126 | Grievance Redressal Officer (GRO) – Ms. Shikha Gupta | Email ID: Grievance@capmint.com | Tel no: 9035331595.
Procedure to file a complaint on SEBI SCORES: Register on SCORES portal. Mandatory details for filing complaints on SCORES: Name, PAN, Address, Mobile Number, E-mail ID. Benefits: Effective Communication, Speedy redressal of the grievances. You may refer the website https://scores.sebi.gov.in/ for more information. You may also download the SEBI Scores app to log a complaint Android: https://play.google.com > store > apps > sebiscores iOS: https://apps.apple.com > app > sebiscores
Disclaimer
Investment in the securities market are subject to market risks, read all the related documents carefully before investing. Brokerage will not exceed the SEBI prescribed limit.
Mutual fund investments are subject to market risks, read all scheme related documents carefully before investing. Mutual Funds are not exchange-traded products.
Attention Investor:
- Stock Brokers can accept securities as margin from clients only by way of pledge in the depository system w.e.f. September 1, 2020.
- Update your mobile number & email Id with your stock broker/depository participant and receive OTP directly from depository on your email id and/or mobile number to create pledge.
- Pay 20% as upfront margin of the transaction value to trade in cash market segment.
- Investors may please refer to the Exchange’s Frequently Asked Questions (FAQs) issued vide circular reference NSE/INSP/45191 dated July 31, 2020 and NSE/INSP/45534 dated August 31, 2020 and other guidelines issued from time to time in this regard.
- Check your Securities /MF/ Bonds in the consolidated account statement issued by NSDL/CDSL every month.