
Table of Content
- Key Takeaways
- What is Elliott Wave Theory?
- Important Rules to Remember for Elliott Wave Pattern:
- Corrective Waves (A, B, C)
- How to Use Elliott Wave Theory in Trading?
- Understanding Corrective Waves in Elliott Wave Analysis
- History and Development of Elliott Wave Theory
- Advantages and Limitations of Elliott Wave Theory
- Conclusion
- Frequently Asked Questions (FAQs)
- Read Further:
Link copied!
Elliott Wave Theory
Elliott Wave Theory is a tool in technical analysis developed by Ralph Nelson Elliott in the 1930s. It suggests that market prices don’t move randomly but follow a repeating pattern driven by investor psychology.
Key Takeaways
- Elliott Wave Theory helps traders recognise structured market cycles, enabling them to anticipate future price movements more effectively by understanding crowd psychology behind impulse and corrective waves.
- By following the three core rules of the Elliott Waves theory, traders can accurately label wave structures and avoid invalid patterns, creating a reliable framework for technical analysis and enhancing their market timing decisions.
- Traders can improve trade entries by identifying pullbacks or breakouts during specific waves, especially Wave 2, 3, or post-correction, and confirming signals with indicators and volume analysis.
- While Elliott Waves offers a powerful market roadmap, wave counting can be subjective. Combining it with confirmation tools ensures a more balanced, realistic, and effective trading strategy.
What is Elliott Wave Theory?
The theory is based on the idea that markets move in two phases, each reflecting the behaviour and psychology of investors. These phases help traders make sense of what looks like random price movements and provide a way to predict future trends with better accuracy.
Impulse Phase
It is a strong move in the direction of the trend (5 waves). This phase represents the main market direction where optimism and strong momentum drive the price significantly.
Corrective Phase
It is a short-term move against the trend (3 waves). This phase usually occurs as a temporary break or pullback due to profit-taking or hesitation after the 5 waves have formed.
To understand it in more detail, first, let’s break down the Impulse Phase
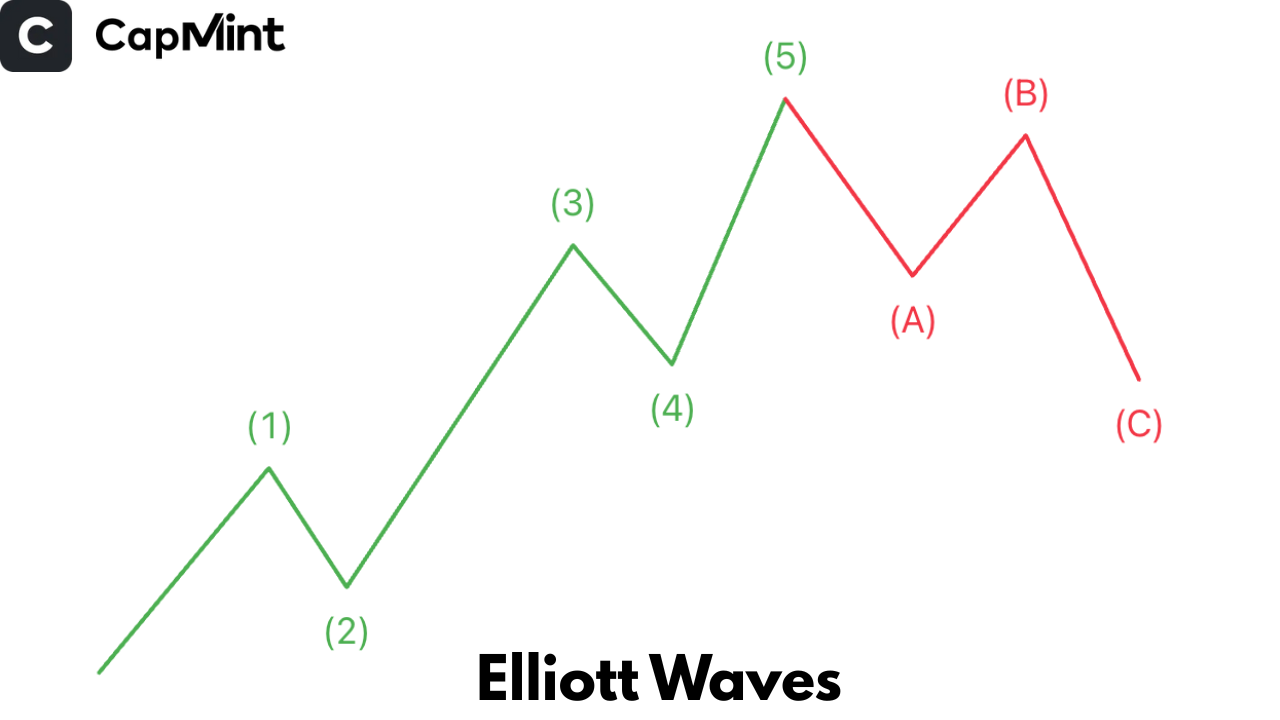
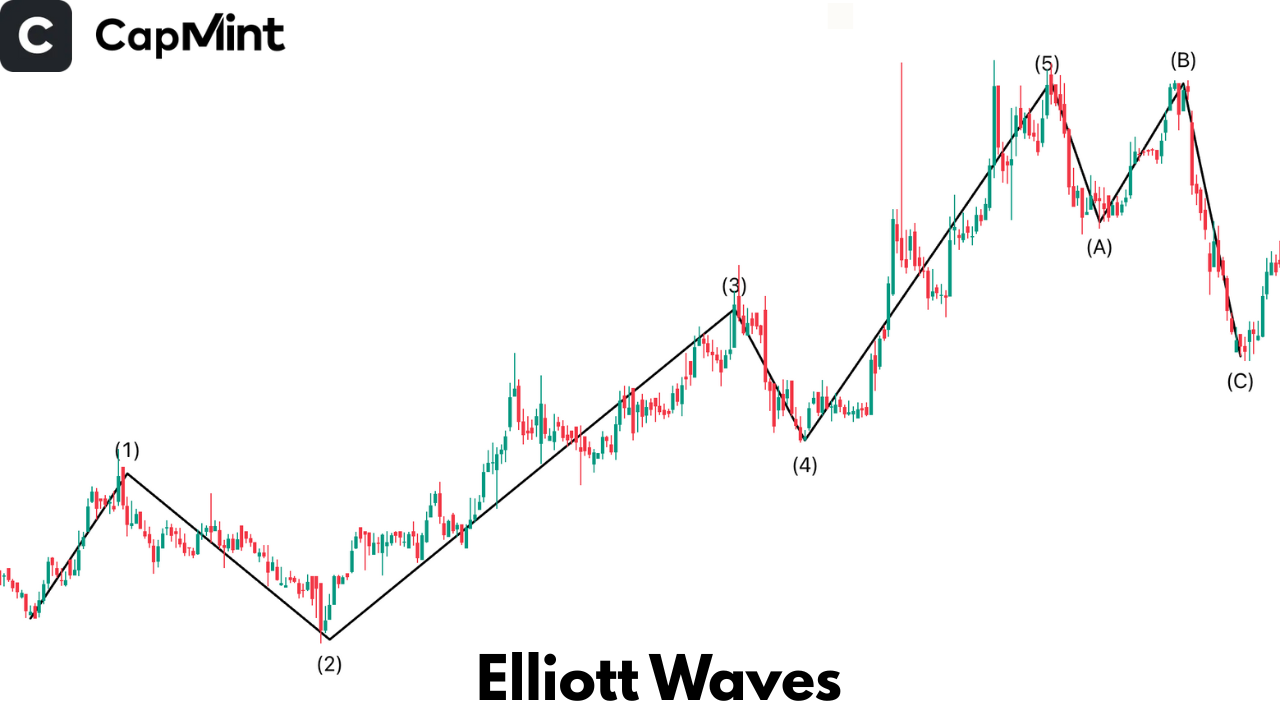
Understanding Impulse Waves in Elliot Wave Pattern (1,2,3,4,5)
Impulse waves follow the direction of the main trend and consist of five waves that reflect the evolving psychology of market participants.
Wave 1
This is when the market first starts to turn in a new direction. It’s often caused by a small group of early investors who sense a change is coming. Most of the market is still sceptical at this stage.
Wave 2
After the initial move, some investors take profits, causing a pullback. There is a certain amount of doubt, but the price doesn’t fall below the start of wave 1; in fact, if we take a Fibonacci Retracement level, it does not fall below 0.618 of wave 1. This signals underlying strength.
Wave 3
Confidence builds as more investors recognise the trend. This wave is usually the strongest and the longest, and sees heavy buying and increased volume. It’s driven by optimism and media coverage.
Wave 4
At this point, some traders again take profits, causing another dip. However, the market doesn’t fall into panic. It’s a brief pause as traders wait for confirmation.
Wave 5
The final push higher as even latecomers jump in. There’s excitement and a fear of missing out (FOMO), but momentum may start slowing. This wave often shows divergence on indicators like RSI.
Important Rules to Remember for Elliott Wave Pattern:
To maintain a valid Elliott Wave structure, three non-negotiable rules must always be followed:
1. Wave 2 Cannot Move Below the Start of Wave 1
Wave 2 represents a correction of Wave 1, but it can never retrace the entire move. If the price falls below the starting point of Wave 1, the wave count becomes invalid and must be reassessed.
2. Wave 3 Can Never Be the Shortest Impulse Wave
Wave 3 is typically the strongest and most powerful move in the trend. While it does not always have to be the longest, it can never be shorter than both Wave 1 and Wave 5.
3. Wave 4 Cannot Enter the Territory of Wave 1
In a standard impulse pattern, Wave 4 should not overlap with the price range covered by Wave 1. If this overlap occurs, the wave structure is generally considered invalid and requires a different interpretation.
Remembering these three rules helps traders avoid incorrect wave counts and improve the reliability of Elliott Wave analysis.
Corrective Waves (A, B, C)
Corrective waves move against the main trend and consist of three parts. They appear after a 5-wave impulse phase has completed, signalling a pause or reversal. These waves often confuse traders because they can take on different shapes, but understanding the emotions behind each leg helps simplify the structure.
Wave A
This is the first pullback after a completed 5-wave impulse. It represents the initial fear or profit-taking as some investors believe the trend may be over. However, many still consider it a temporary dip.
Wave B
The market temporarily moves back in the direction of the main trend. It’s driven by hope and the belief that the previous move will continue. This wave often traps late buyers who think the trend is resuming.
Wave C
This is the final leg of the correction and usually sees more decisive selling or buying (depending on the direction). It reflects growing fear or frustration as the price moves more aggressively against the prior trend, shaking out weaker hands and resetting expectations.
It is important to note that there are different correction patterns: zigzag, flat, and triangle. These can be complex, so it’s okay if they’re harder to spot.
How to Use Elliott Wave Theory in Trading?
Understanding Elliott Wave Theory is one thing; applying it in actual trading is another. When and where to make an entry becomes the biggest problem. Below are some ways you can enter the trade.
Entry Points
- Enter during Waves 2 or 4: These pullbacks give you a chance to hop on the trend at a better price. During Wave 2, people are still unsure, so prices dip. Wave 4 is more of a breather before the last leg up. Both offer low-risk entries with stop losses placed below the recent swing low.
- Ride Wave 3: This is where the trend gets strong, and momentum picks up. Most traders feel confident here, and volume rises. Entering during this wave can offer great returns if you’re already positioned or quick to spot the breakout.
- Catch the next move after the ABC correction: Once the corrective wave ends, a new impulse wave might begin. Entering after Wave C finishes can set you up for the next major trend, especially if supported by indicators or support/resistance zones.
Apart from this, it is also advisable to throw in some other indicators and Confirmation tools to make Elliott Wave more reliable
Confirmation Tools
Elliott Wave Theory becomes far more effective when used alongside other tools. These confirm your analysis and reduce guesswork.
- Fibonacci retracements: Use them to find possible bounce or reversal levels. Wave 2 often retraces around 50–61.8% of Wave 1, and Wave 4 may retrace 38.2% of Wave 3.
- RSI or MACD: Relative Strength Index and MACD are momentum indicators that help confirm wave strength. For example, a bullish RSI divergence in Wave 2 or 4 can support your decision to buy.
- Volume analysis: Waves with stronger conviction (like Wave 3) usually see higher volume. A spike in volume can confirm a breakout or validate that a wave is real, not just noise.
Understanding Corrective Waves in Elliott Wave Analysis
Corrective waves are temporary price movements that go against the direction of the main trend. They typically occur after a five-wave impulse sequence and help the market pause, consolidate, or retrace before the next major move begins.
Unlike impulse waves, which are usually straightforward and driven by strong momentum, corrective waves can be more complex and difficult to identify. They often reflect uncertainty among market participants as traders reassess the strength of the previous trend.
The most common corrective structure is the ABC pattern:
Zigzag Correction
A zigzag is a sharp correction that follows a 5-3-5 structure. It usually indicates a strong counter-trend move where prices retrace a significant portion of the previous impulse wave before the main trend resumes.
Flat Correction
A flat correction follows a 3-3-5 structure and tends to move sideways rather than sharply lower or higher. It reflects a balanced struggle between buyers and sellers and often occurs in relatively stable market conditions.
Triangle Correction
Triangle patterns consist of five overlapping waves that gradually narrow in range. These corrections often develop before the final move in the trend and represent a period of indecision before a breakout occurs.
Understanding corrective waves helps traders avoid entering positions too early and improves their ability to distinguish between a temporary pullback and a genuine trend reversal.
History and Development of Elliott Wave Theory
Elliott Wave Theory was developed by Ralph Nelson Elliott, an American accountant and author, during the 1930s. While studying decades of stock market data, Elliott observed that market prices appeared to move in recurring patterns rather than randomly.
In 1938, he published his findings in the book “The Wave Principle”, where he explained that financial markets are driven by collective investor psychology. According to Elliott, optimism and pessimism cycle through the market in predictable ways, creating recurring wave structures in price movements.
Elliott’s work gained wider recognition after he successfully forecasted a major stock market advance during the 1930s. Over time, traders and analysts expanded his ideas by combining them with tools such as Fibonacci Retracement, technical indicators, and market cycle analysis.
Today, Elliott Wave Theory remains one of the most widely studied market forecasting methods and is used across stocks, commodities, forex, indices, cryptocurrencies, and other financial markets.
Advantages and Limitations of Elliott Wave Theory
Before ending the topic, it’s important to know what it can and can’t do. Here’s a simple breakdown of the strengths and weaknesses of Elliott Wave Theory.
Advantages:
- Helps map out market direction: Elliott Wave Theory offers a logical structure to price movement. By identifying where you are in the wave cycle, you can better anticipate what might happen next.
- Works on any timeframe: Whether you’re day trading or looking at long-term investments, the wave principles apply across minutes, hours, days, or months. This makes it versatile for different trading styles.
- Offers structure to market analysis: Instead of reacting to every price move emotionally, the wave count gives a clear path. This helps traders stay disciplined and reduce impulsive decisions.
Limitations:
- Wave counting is subjective: Different traders may see different wave patterns on the same chart. This can lead to confusion or conflicting interpretations if not done with care.
- Can be overcomplicated if misused: Trying to fit wave counts into every chart can be overwhelming, especially for beginners. It’s best to stick with clear patterns and not force the theory where it doesn’t fit.
- Doesn’t work well without context or confirmation: Relying only on wave counts can be risky. It’s more effective when used with other tools like RSI, Fibonacci, or support and resistance levels for confirmation.
Conclusion
Elliott Wave Theory gives traders a structured way to understand how prices move in the market. It breaks price action into wave patterns that reflect the emotions and actions of traders over time. While it may take some practice to get used to it, the method can be incredibly useful for identifying trends and reversals when used correctly. With the right mindset and tools for confirmation, even beginners can apply it to their trading decisions and improve their overall strategy.
Frequently Asked Questions (FAQs)
Is Elliott Wave Theory reliable for beginners?
Yes, Elliott Wave Theory can be reliable for beginners if approached with patience. Start by learning how to identify simple 5-wave and 3-wave patterns. Focus on clarity over complexity and avoid forcing patterns onto charts where they don’t fit.
Can I use it on intraday charts?
Absolutely. Elliott Wave Theory works on all timeframes, including intraday charts. Just remember, shorter timeframes can be more volatile and noisy, so stick to clear patterns and consider confirming signals with indicators.
What’s the difference between Elliott Waves and Fibonacci?
Elliott Waves help you understand market structure and cycles, while Fibonacci tools help you measure possible retracement and extension levels. Many traders use both together to improve accuracy in entries and exits.
Do I need software to apply it?
No special software is required. Most charting platforms, like TradingView, offer drawing tools to map Elliott Waves manually. However, some platforms offer auto-labelling features which can assist, but it’s still important to understand the logic behind wave counts yourself.
What are the 5 waves of the Elliott Wave Theory?
The five impulse waves consist of Waves 1, 2, 3, 4, and 5. Waves 1, 3, and 5 move in the direction of the primary trend, while Waves 2 and 4 are corrective pullbacks. Together, these five waves form the impulse phase of the Elliott Wave cycle and represent the dominant market trend.
What are Waves 1, 3, and 5 called?
Waves 1, 3, and 5 are known as Impulse Waves because they move in the direction of the prevailing trend.
- Wave 1: The initial move that starts a new trend.
- Wave 3: The strongest and often the longest wave, driven by increasing market participation.
- Wave 5: The final impulse wave, typically fuelled by optimism, FOMO, and late entrants joining the trend.
These waves collectively represent the trend’s advancing phase.
Which timeframe is best for an Elliott Wave?
Elliott Wave Theory works across all timeframes because market psychology exists at every level. However, daily and weekly charts generally provide the clearest wave structures and reduce market noise. Intraday traders can apply Elliott Waves on shorter timeframes such as 15-minute or 1-hour charts, but wave counts may become more subjective due to increased volatility and false signals.
Read Further:
Disclaimer: This content is for educational purposes only and does not constitute financial or investment advice. Investments in securities or other financial instruments are subject to market risk, including partial or total loss of capital. Past performance is not indicative of future results. Always consider your financial situation carefully and consult a licensed financial advisor before making investment or trading decisions.
Table of Content
- Key Takeaways
- What is Elliott Wave Theory?
- Important Rules to Remember for Elliott Wave Pattern:
- Corrective Waves (A, B, C)
- How to Use Elliott Wave Theory in Trading?
- Understanding Corrective Waves in Elliott Wave Analysis
- History and Development of Elliott Wave Theory
- Advantages and Limitations of Elliott Wave Theory
- Conclusion
- Frequently Asked Questions (FAQs)
- Read Further:
Engineered for the obsessed. Built for traders.

Purpose-built terminals.
Zero compromise.
Built for speed.
Plot No 1290, 2nd Floor, 17th Cross, 5th Main, Sector-7, HSR Layout, Bangalore 560102
Follow us on
Mintcap Brokers Private Limited
CIN – U66110KA2023PTC178706 | Registered Address: Plot No 1290, Second Floor, 17th Cross, 5th Main, Sector-7, HSR Layout, Bangalore 560102 | Tel: 080 – 49552310 | Email ID: compliance@capmint.com | SEBI registered Stock Broker: INZ000322732 | NSE Cash/F&O Member ID: 90430 | BSE Cash/F&O Member ID: 6903 | MCX Member ID: 57400 | NCDEX Member ID: 1312 | SEBI registered Depository Participant: IN-DP-806-2025 | CDSL DP ID: 12102300 | NSE Clearing Member code: M70108 | AMFI-Registered Mutual Fund Distributor: ARN-289109 (Valid upto 28-Feb-2027) | Category II Execution Only Platform : E6903
Details of Client Bank Account
Compliance Officer: Ms. Shridevi Vungarala | Email ID: compliance@capmint.com | Tel no. + 91 9035330126 | Grievance Redressal Officer (GRO) – Ms. Shikha Gupta | Email ID: Grievance@capmint.com | Tel no: 9035331595.
Procedure to file a complaint on SEBI SCORES: Register on SCORES portal. Mandatory details for filing complaints on SCORES: Name, PAN, Address, Mobile Number, E-mail ID. Benefits: Effective Communication, Speedy redressal of the grievances. You may refer the website https://scores.sebi.gov.in/ for more information. You may also download the SEBI Scores app to log a complaint Android: https://play.google.com > store > apps > sebiscores iOS: https://apps.apple.com > app > sebiscores
Disclaimer
Investment in the securities market are subject to market risks, read all the related documents carefully before investing. Brokerage will not exceed the SEBI prescribed limit.
Mutual fund investments are subject to market risks, read all scheme related documents carefully before investing. Mutual Funds are not exchange-traded products.
Attention Investor:
- Stock Brokers can accept securities as margin from clients only by way of pledge in the depository system w.e.f. September 1, 2020.
- Update your mobile number & email Id with your stock broker/depository participant and receive OTP directly from depository on your email id and/or mobile number to create pledge.
- Pay 20% as upfront margin of the transaction value to trade in cash market segment.
- Investors may please refer to the Exchange’s Frequently Asked Questions (FAQs) issued vide circular reference NSE/INSP/45191 dated July 31, 2020 and NSE/INSP/45534 dated August 31, 2020 and other guidelines issued from time to time in this regard.
- Check your Securities /MF/ Bonds in the consolidated account statement issued by NSDL/CDSL every month.