
Link copied!
What is Volume in Trading? Meaning, Importance & How to Use It
Volume in trading refers to the total number of shares or contracts traded for a security during a specific period, typically a trading day. It helps investors assess the strength of price movements and market participation.
- Volume = total number of shares or contracts traded
- High volume = strong price movement with broad participation
- Low volume = weak or less reliable price movement
Key Takeaways
- Volume means the total number of shares that were bought or sold in the stock market during a specific time. If one person buys and another sells a share, it counts as one volume.
- High trading volume shows strong interest in a stock and usually means it’s easy to buy or sell without affecting the price too much. Low volume means less activity and may lead to price swings.
- Volume helps confirm price trends. If the stock price is rising and volume is also high, it means the trend is strong. If the price is rising but volume is low, the trend may not last.
- Traders and investors use volume to decide when to enter or exit a trade. Sudden jumps in volume often mean something important is happening, like big news or a price breakout.
What is Volume in Trading?
Volume is the total number of shares or contracts traded for a stock or financial instrument during a specific period, usually one trading day. It shows how active or liquid a security is in the market. A higher volume means there is more trading activity, while a lower volume indicates less interest or participation from traders and investors.
Volume also helps in understanding the strength behind a price movement. When prices change, volume can show whether the change is supported by strong market interest or not. If there is strong volume behind the move, it suggests that more participants agree with the price direction. On the other hand, weak volume may signal a lack of conviction in the movement.
Volume and Market Liquidity
There is a strong connection between volume and liquidity in the stock market. Volume gives a clear idea of how liquid a market is. When the trading volume is high, it usually means the market has good liquidity. This allows investors to buy or sell assets quickly without causing big changes in the price. High liquidity also means it’s easier to enter or exit trades smoothly.
High volume also reflects better market depth. This means the market can handle large buy or sell orders without big price swings. It shows that there are enough buyers and sellers available at different price levels, which helps keep trading stable and efficient.
How To Use Volume In Technical Analysis?
Volume is one of the most important technical indicators in trading. It helps traders understand the strength behind price movements. But beyond just volume, there are also technical indicators like:
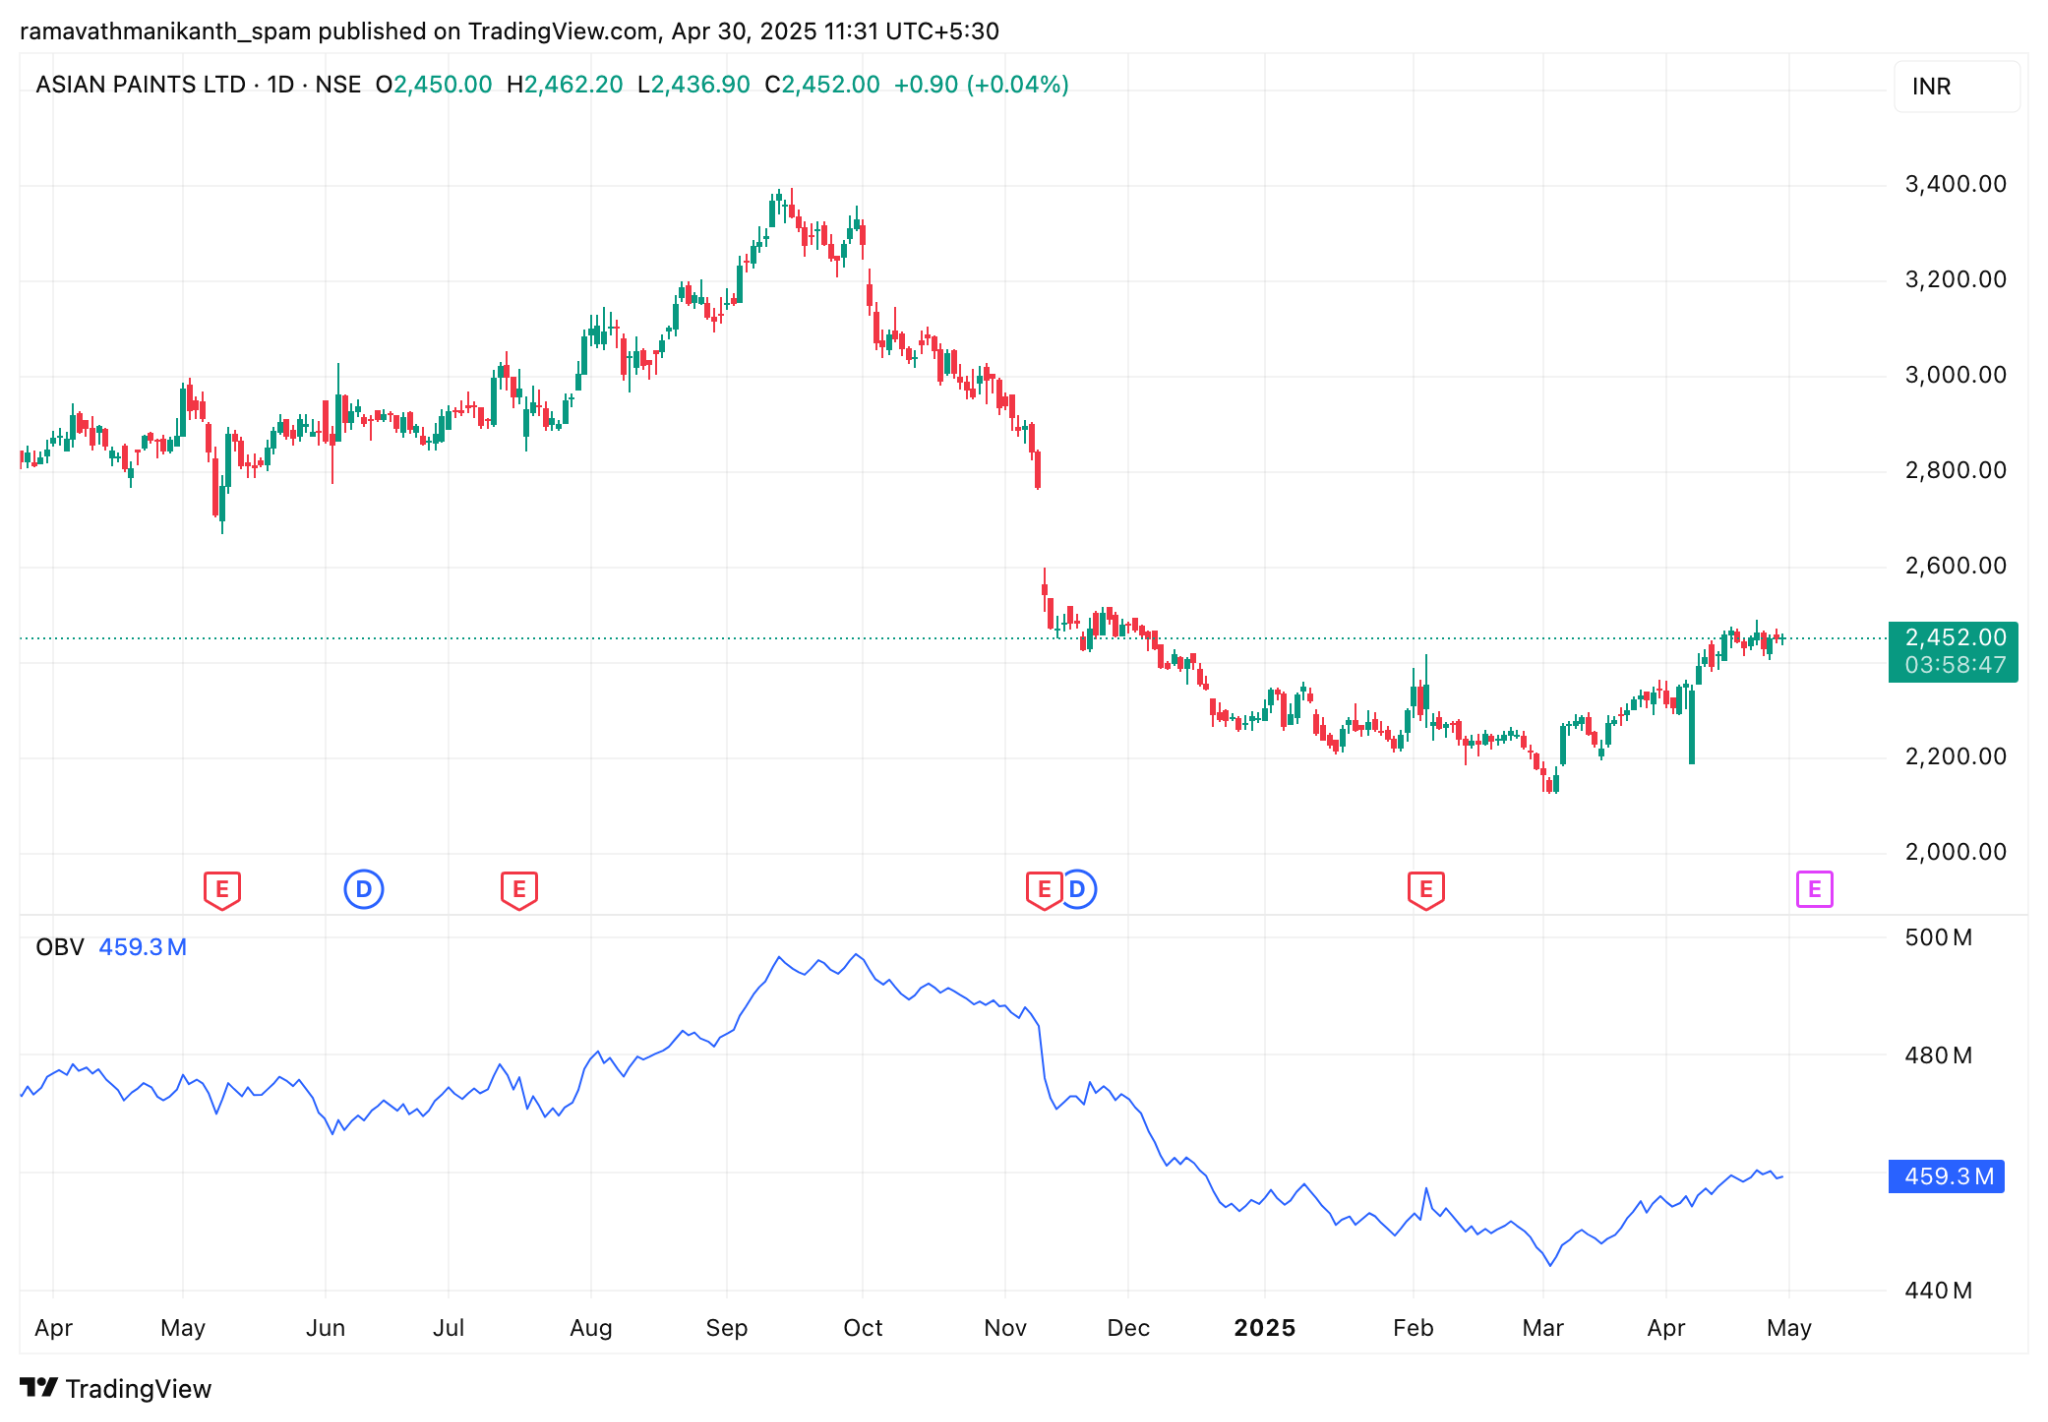
On-Balance Volume (OBV)
OBV is a technical indicator that helps measure buying and selling pressure. It works by adding the day’s volume to a total when the price goes up and subtracting the volume when the price goes down. Over time, this helps show whether more people are buying or selling. A rising OBV suggests strong buying interest, while a falling OBV shows selling pressure.
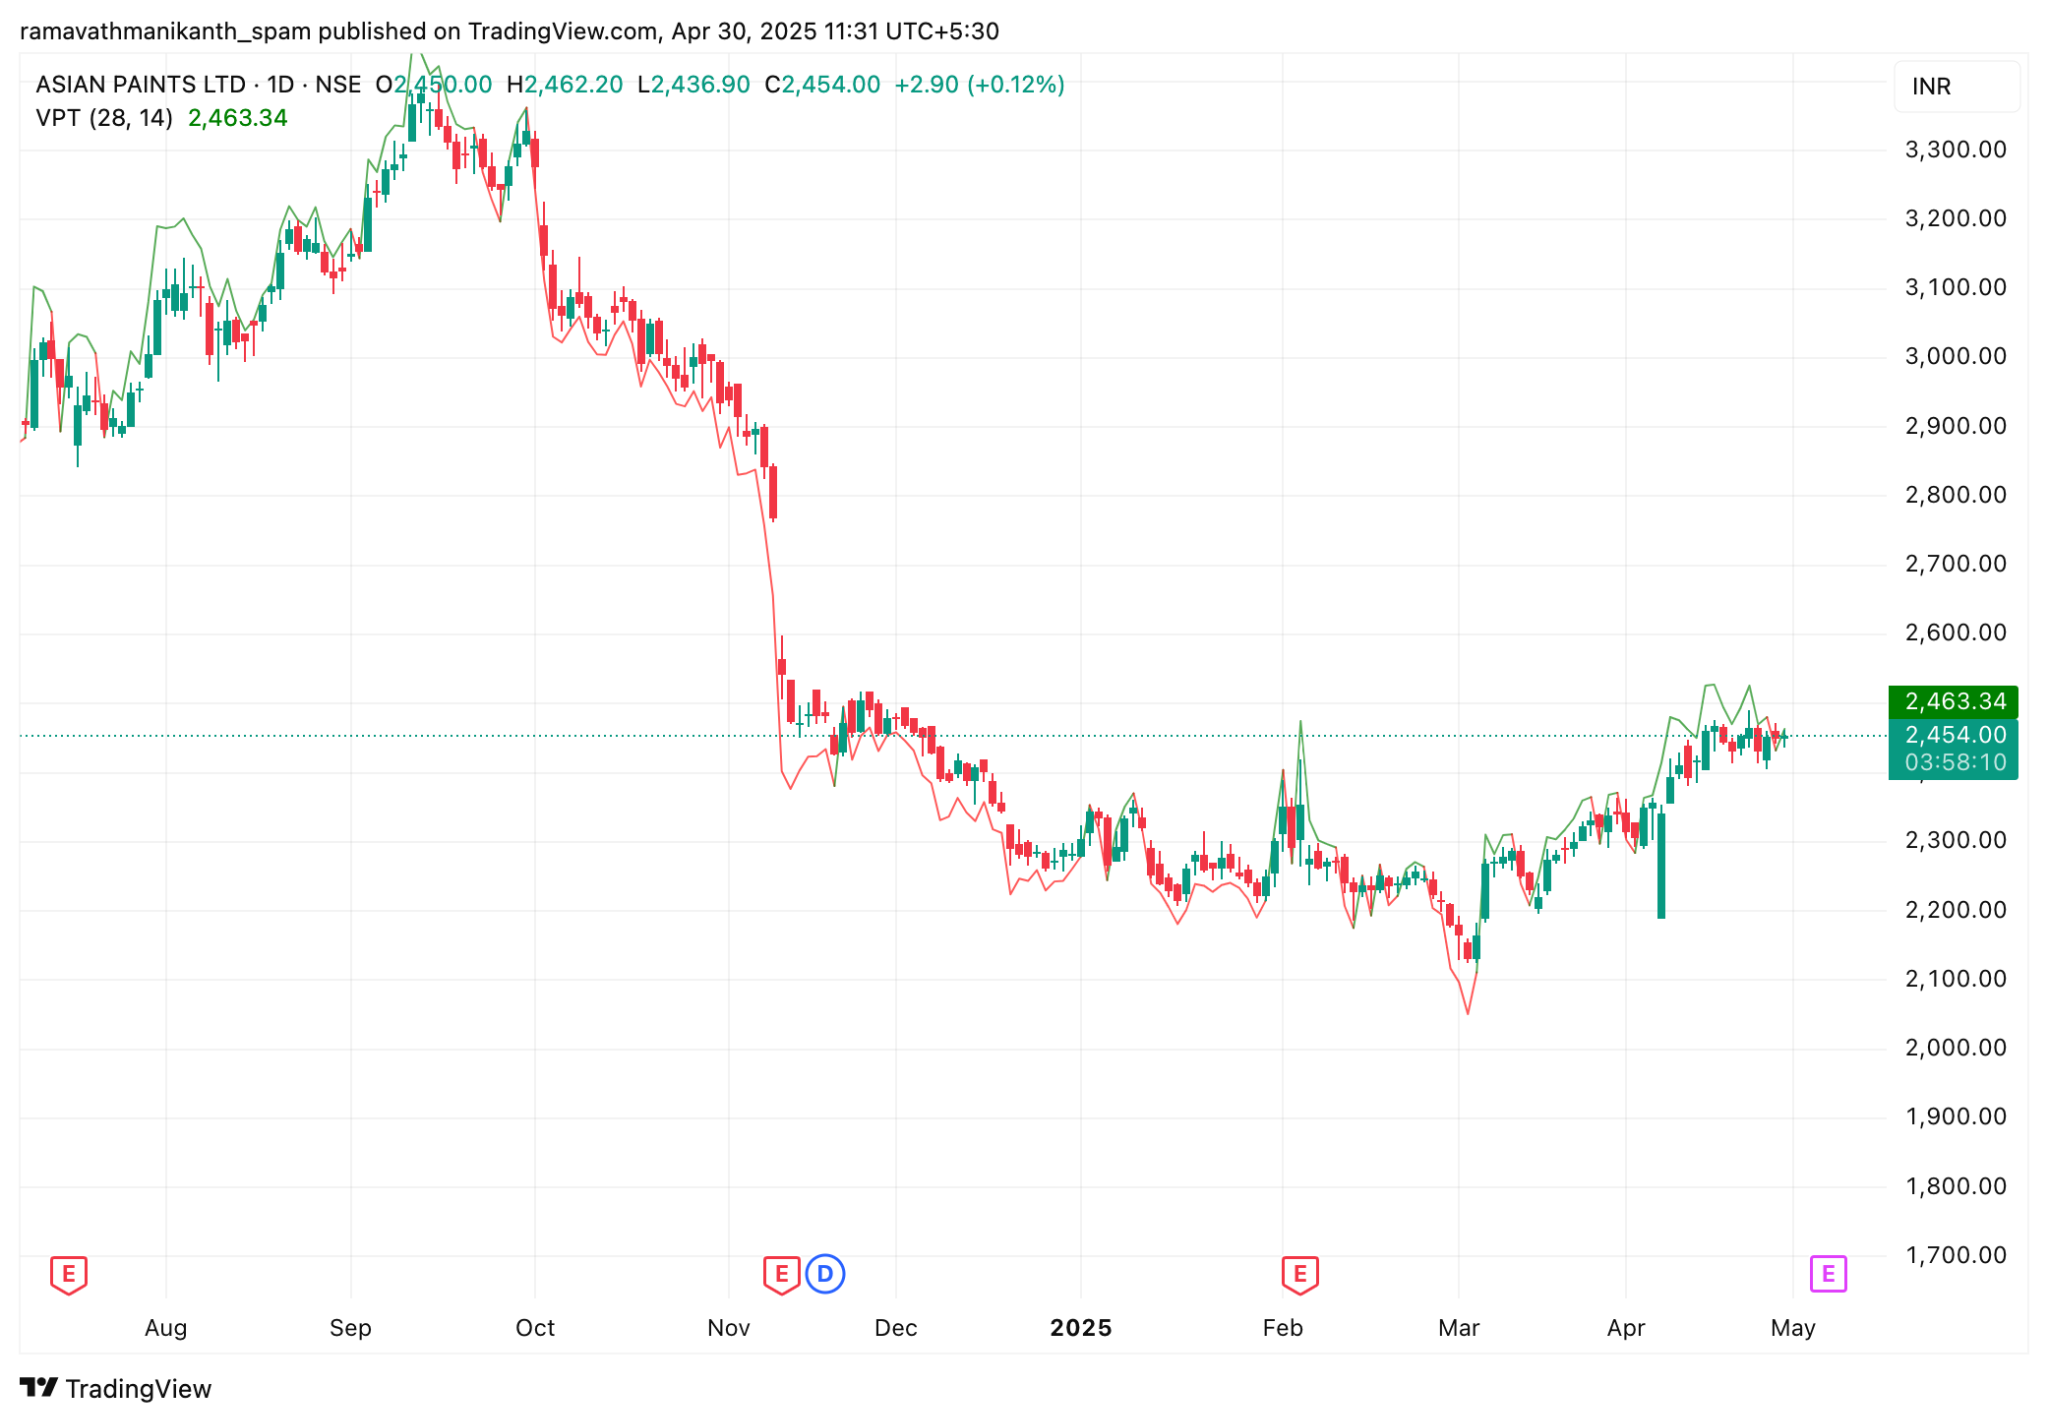
Volume Price Trend (VPT)
VPT is another indicator that combines both price and volume to show how strong a price movement is. It increases when prices go up, along with high volume, and decreases when prices go down, along with high volume. VPT helps traders understand if the trend has strong support from volume or if it’s weak and may reverse.
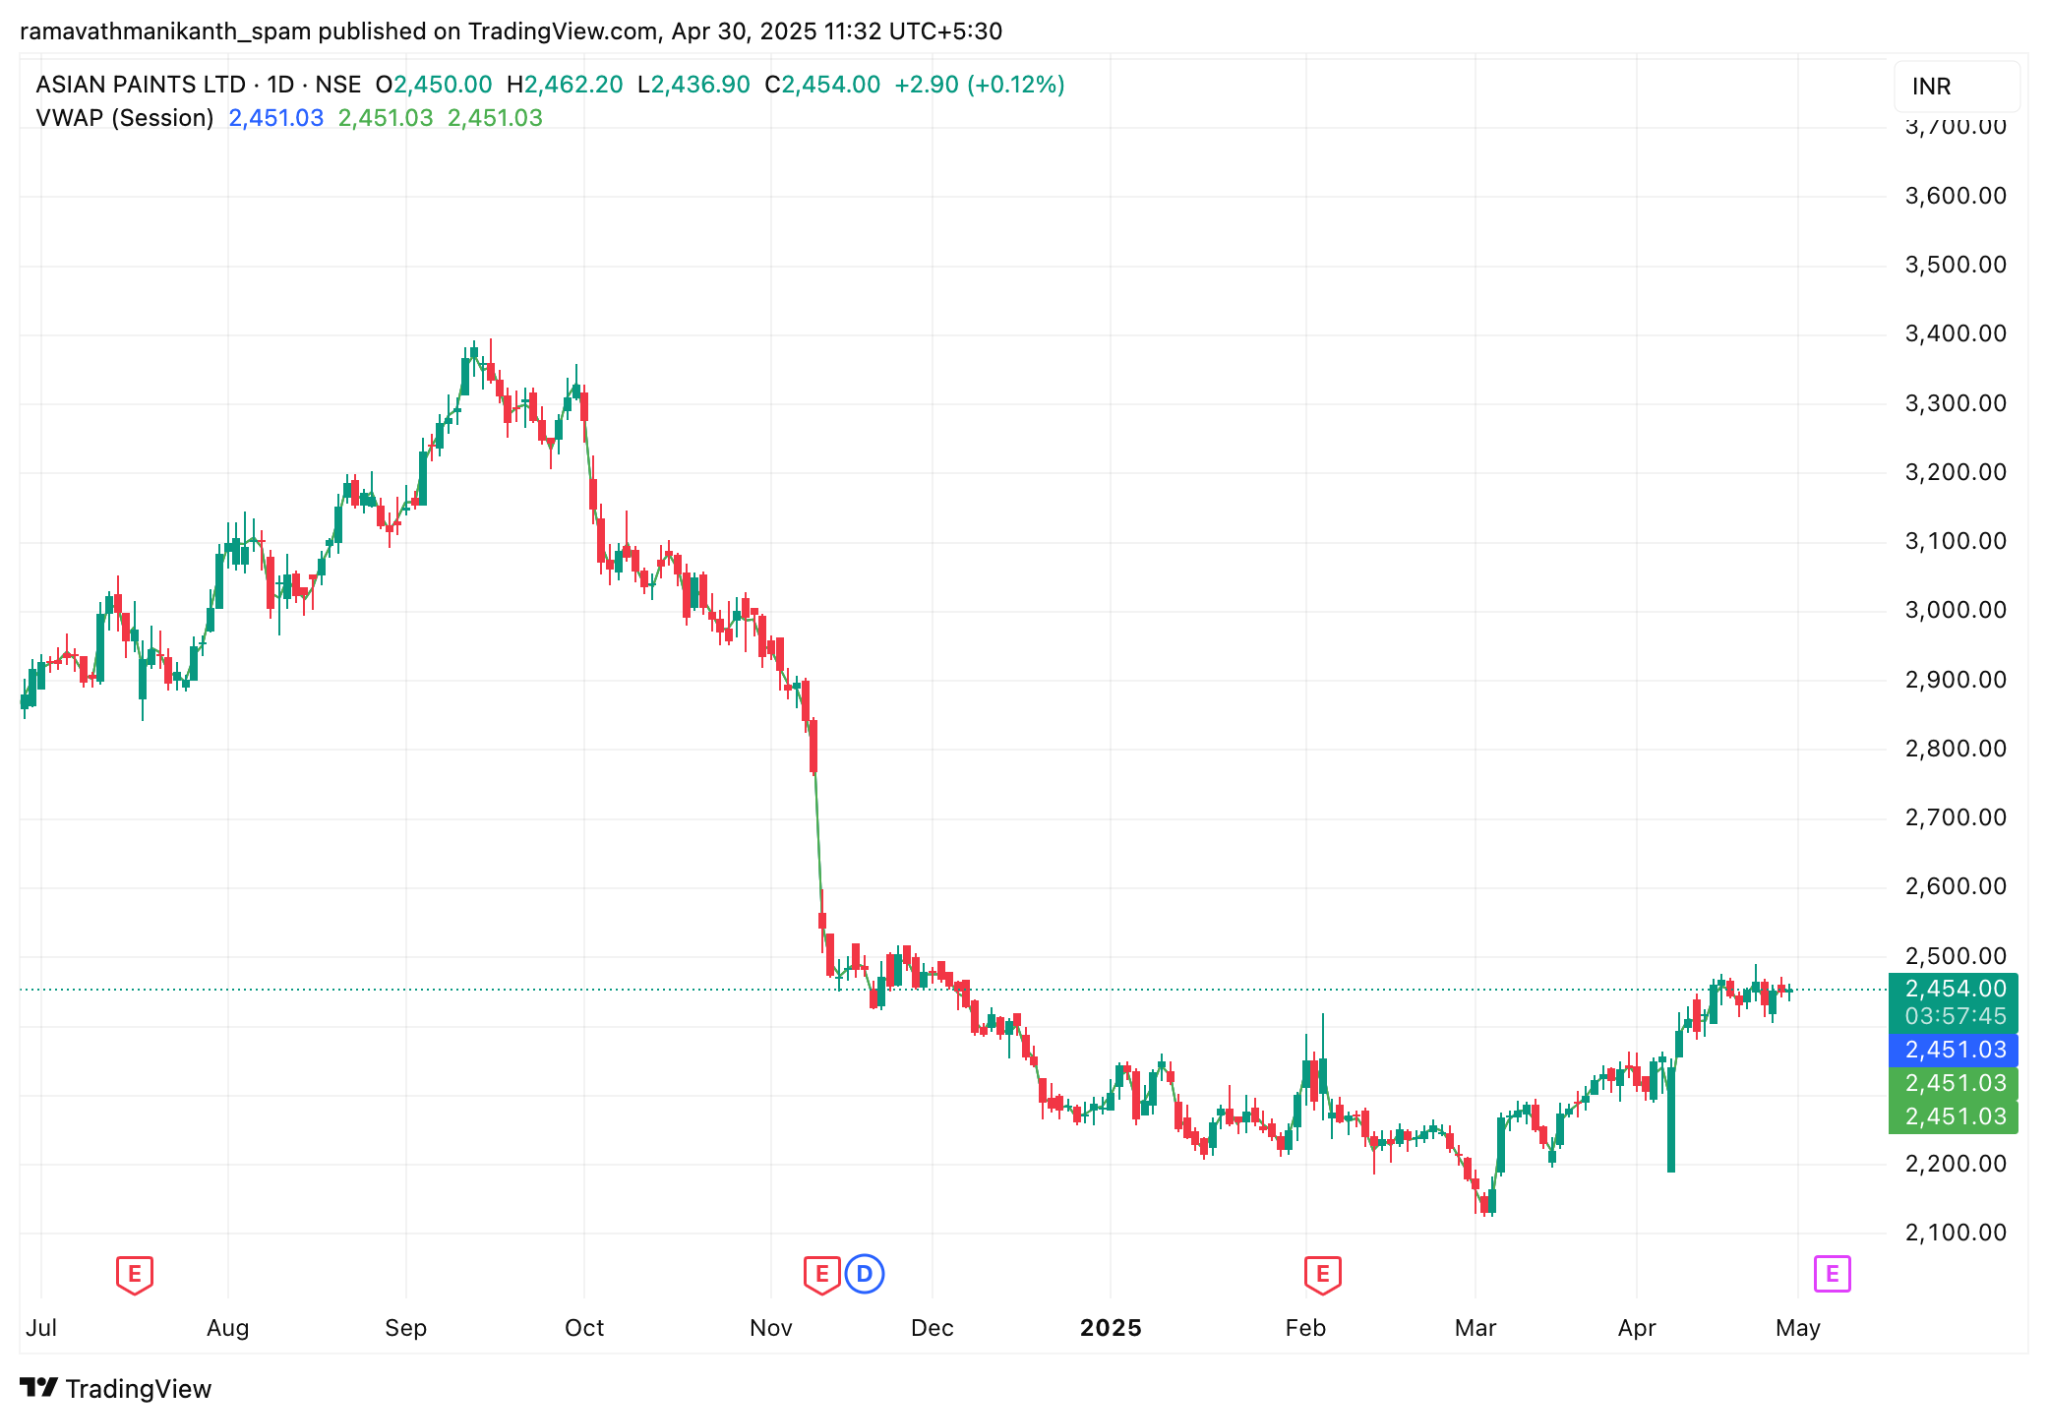
Volume Weighted Average Price (VWAP)
VWAP gives the average price a stock has traded at during the day, but with a twist—it also considers the volume of trades. This means trades with higher volume have a bigger impact on the average. Traders often use VWAP to see if they got a good price on their buy or sell compared to the day’s average. It’s also used to understand the market’s overall direction during the day.
Where to find the Trading Volume?
Trading volume is easily available on most trading platforms and stock charts. It is usually displayed as vertical bars below the price chart, showing how many shares were traded during a specific time period.
Traders also use the Average Daily Trading Volume (ADTV), which shows the average number of shares traded over a set period, such as 20 or 30 days. This helps in comparing current activity with past trends.
When the current volume is significantly higher than the average, especially during breakouts, it indicates strong participation and confirms the reliability of the price movement.
Average Daily Trading Volume (ADTV)
The average daily trading volume (ADTV) is the average number of shares traded each day over a set period, like 20 or 30 days. Traders often use this as a technical indicator and place it on their charts to better understand market activity.
When the current trading volume is at least 70% higher than the average volume, especially during a breakout above resistance or below support, it can be a strong signal that the move is real. This helps traders avoid false breakouts, where the price moves past a key level but quickly reverses. A strong volume compared to the average gives more confidence that the price move has support from real buying or selling pressure.
In the above, you can see that the stock made a strong upward move after breaking its resistance level. This breakout was supported by a noticeable increase in volume, which confirms that the rally had strong buying interest behind it.

In the above, you can see that the stock made a strong upward move after breaking its resistance level. This breakout was supported by a noticeable increase in volume, which confirms that the rally had strong buying interest behind it.
How Volume Affects Trading?
Volume shows how many traders are active in a stock or index and helps confirm the strength of price moves. High volume during breakouts or trends suggests strong participation and reliability, while low volume often leads to false signals. It also helps identify reversals, accumulation zones, and institutional activity. Higher volume improves liquidity and reduces slippage, making trades smoother. Overall, volume is a key tool for validating market direction and spotting smart money moves.
Conclusion
In simple terms, volume is a key factor that helps traders understand how strong a price movement is. It shows how many people are buying and selling in the market. High volume means more activity and better chances that the price movement is real. It also tells us how easy it is to buy or sell without changing the price too much. Volume-based indicators like OBV, VPT, VWAP, and ADTV help traders make better decisions by giving deeper insights into market behaviour. Using volume the right way can improve your trading strategy and help you avoid false signals.
Frequently Asked Questions FAQs
What is the Importance of Volume in Trading?
Volume is important because it shows the strength behind a price movement. High volume supports trends and breakouts, while low volume may indicate weak or unreliable moves. It also helps traders understand market interest, liquidity, and potential reversals.
How much is 1 volume in stocks?
1 volume means one share of a stock was traded, either bought or sold. If you buy 1 share and someone sells it to you, that’s counted as 1 volume, not two.
What is the volume of a company?
The volume of a company means how many shares of that company were traded in a given time, usually in a day.
How to use Volume for Trading?
Volume helps confirm price movements and identify strong trends. Traders look for high volume during breakouts or reversals to validate the move. It is also used with indicators like VWAP or OBV to time entries and exits more effectively.
Is Higher Trading Volume better in Trading?
Higher trading volume is generally better as it indicates strong market participation and better liquidity. It makes it easier to enter or exit trades without a major price impact. However, volume should always be analysed with price action for accurate signals.
Disclaimer: This content is for educational purposes only and does not constitute financial or investment advice. Investments in securities or other financial instruments are subject to market risk, including partial or total loss of capital. Past performance is not indicative of future results. Always consider your financial situation carefully and consult a licensed financial advisor before making investment or trading decisions.
Engineered for the obsessed. Built for traders.

Purpose-built terminals.
Zero compromise.
Built for speed.
Plot No 1290, 2nd Floor, 17th Cross, 5th Main, Sector-7, HSR Layout, Bangalore 560102
Follow us on
Mintcap Brokers Private Limited
CIN – U66110KA2023PTC178706 | Registered Address: Plot No 1290, Second Floor, 17th Cross, 5th Main, Sector-7, HSR Layout, Bangalore 560102 | Tel: 080 – 49552310 | Email ID: compliance@capmint.com | SEBI registered Stock Broker: INZ000322732 | NSE Cash/F&O Member ID: 90430 | BSE Cash/F&O Member ID: 6903 | MCX Member ID: 57400 | NCDEX Member ID: 1312 | SEBI registered Depository Participant: IN-DP-806-2025 | CDSL DP ID: 12102300 | NSE Clearing Member code: M70108 | AMFI-Registered Mutual Fund Distributor: ARN-289109 (Valid upto 28-Feb-2027) | Category II Execution Only Platform : E6903
Details of Client Bank Account
Compliance Officer: Ms. Shridevi Vungarala | Email ID: compliance@capmint.com | Tel no. + 91 9035330126 | Grievance Redressal Officer (GRO) – Ms. Shikha Gupta | Email ID: Grievance@capmint.com | Tel no: 9035331595.
Procedure to file a complaint on SEBI SCORES: Register on SCORES portal. Mandatory details for filing complaints on SCORES: Name, PAN, Address, Mobile Number, E-mail ID. Benefits: Effective Communication, Speedy redressal of the grievances. You may refer the website https://scores.sebi.gov.in/ for more information. You may also download the SEBI Scores app to log a complaint Android: https://play.google.com > store > apps > sebiscores iOS: https://apps.apple.com > app > sebiscores
Disclaimer
Investment in the securities market are subject to market risks, read all the related documents carefully before investing. Brokerage will not exceed the SEBI prescribed limit.
Mutual fund investments are subject to market risks, read all scheme related documents carefully before investing. Mutual Funds are not exchange-traded products.
Attention Investor:
- Stock Brokers can accept securities as margin from clients only by way of pledge in the depository system w.e.f. September 1, 2020.
- Update your mobile number & email Id with your stock broker/depository participant and receive OTP directly from depository on your email id and/or mobile number to create pledge.
- Pay 20% as upfront margin of the transaction value to trade in cash market segment.
- Investors may please refer to the Exchange’s Frequently Asked Questions (FAQs) issued vide circular reference NSE/INSP/45191 dated July 31, 2020 and NSE/INSP/45534 dated August 31, 2020 and other guidelines issued from time to time in this regard.
- Check your Securities /MF/ Bonds in the consolidated account statement issued by NSDL/CDSL every month.