
Table of Content
- Quick Summary
- Why Strategy Matters More Than Speed?
- The VWAP Mean Reversion Scalp
- The Order Flow Imbalance Scalp
- The EMA Pullback Scalp (Trend Continuation)
- The Breakout Reclaim Scalp
- The Opening Range Scalp
- The Relative Strength / Relative Weakness Scalp
- Combining Strategies
- Building a Strategy Selection Framework
- Position Sizing Across Strategies
- The Strategy Testing Process
- Frequently Asked Questions
- Closing Thoughts
Link copied!
Scalping Trading Strategies: Types, Setups, Tips & Risk Management
Learn how to identify, enter, manage, and exit scalp trades using proven setups.
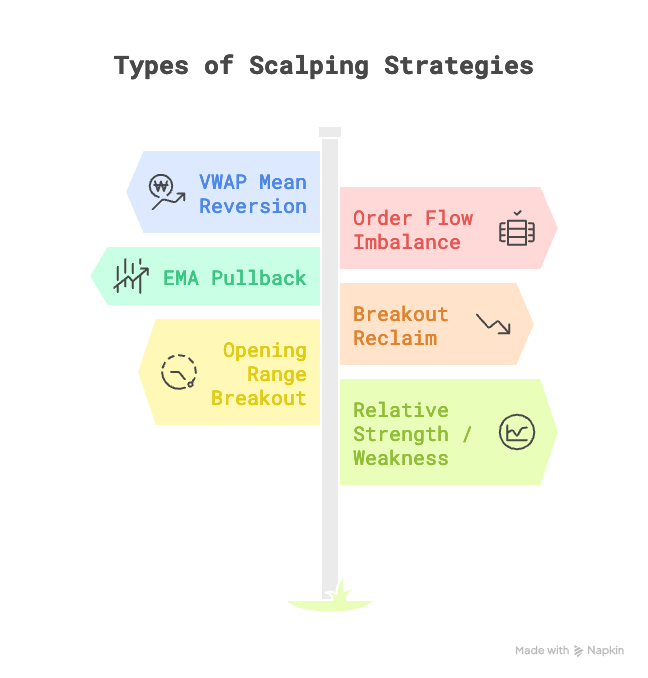
TLDR: A Summary Table of All Strategies
For quick reference, here is every strategy in this guide laid out together:
| Strategy | Market Condition | Entry Basis | Typical R:R | Holding Time | Difficulty Level |
|---|---|---|---|---|---|
| VWAP Mean Reversion | Range-bound | Price at VWAP 2nd SD band with rejection | 1.5:1 to 3:1 | 2 to 10 minutes | Moderate |
| Order Flow Imbalance | High-activity sessions | Order book + Time & Sales imbalance | 1:1 to 2:1 | 30 seconds to 3 minutes | High |
| EMA Pullback | Trending | Price touches 9 EMA in a trend | 1.5:1 to 2:1 | 1 to 5 minutes | Beginner-friendly |
| Breakout Reclaim | Transition / Breakout | Failed breakout followed by reclaim | 2:1 to 3:1 | 2 to 10 minutes | Moderate |
| Opening Range Breakout | First 30 minutes setup | Break of 15-min high or low | 1.5:1 to 2:1 | 5 to 20 minutes | Beginner-friendly |
| Relative Strength / Weakness | Sector divergence | Stock diverges from index | 2:1+ | 3 to 15 minutes | Moderate |
Now, let’s deep dive into the various strategies with examples. But first, a few important notes to ponder.
Why Strategy Matters More Than Speed?
There is a common misconception about scalping that we need to address before we go any further. Many people assume scalping is about being the fastest person in the room, clicking buttons at lightning speed, and reacting to every flicker on the screen.
That is not scalping. That is chaos.
Real scalping is about pattern recognition and disciplined repetition. Think of a master potter at a wheel. Their hands move quickly, yes, but every movement is intentional, practised, and guided by a deep understanding of the material. They are not rushing. They are efficient because they have repeated the same motion thousands of times and know exactly what to do at every stage.
A scalping strategy gives you that same structure. It tells you: what to look for, when to enter, where to place your stop loss, where to take profit, and, critically, when to do absolutely nothing.
Without a strategy, you are simply placing bets on a screen. With one, you are executing a process that has a definable, testable edge over many repetitions.
Let us build that process together, one strategy at a time.
Pre-Requisites of Scalping in Trading
This guide assumes you understand the foundational building blocks of scalping: the bid-ask spread, liquidity, the order book, tick size, transaction costs, and basic risk management rules. If any of these terms feel unfamiliar, it would be worth visiting our foundational material on the scalping guide before proceeding.
Each strategy in this guide will follow a consistent structure so you can compare them clearly:
- The Core Idea (what market behaviour it exploits)
- The Setup (what must be true on your chart or screen before the trade is valid)
- The Entry Trigger (the specific event that tells you “now”)
- The Stop Loss Logic (where and why)
- The Profit Target Logic (where and why)
- Best Market Conditions (when this strategy thrives)
- When to Avoid It (when this strategy will chew you up)
- A Worked Example with Numbers
Let us begin.
Scalping Strategy 1: The VWAP Mean Reversion Scalp
The Core Idea
Imagine a rubber band stretched away from its resting position. The further you pull it, the stronger the force pulling it back towards the centre. In the market, VWAP (Volume Weighted Average Price) acts as the centre of gravity for the day.
VWAP is the average price at which an instrument has traded during the day, weighted by the volume at each price. It is not just another moving average. Because large institutions use VWAP as a benchmark for their execution quality (they want to buy below VWAP and sell above it), the price has a natural tendency to “revert” back towards VWAP after stretching too far away from it.
A mean reversion strategy exploits this tendency. When the price moves aggressively away from VWAP, you take a position betting that it will snap back.
The Setup
You need the following on your chart (1-minute timeframe):
VWAP line (available as a standard indicator on most charting platforms).
VWAP Standard Deviation Bands. These are lines plotted at 1 and 2 standard deviations above and below the VWAP. Think of them as “extreme zones.” When the price reaches the 2nd standard deviation band, it is statistically quite stretched from the average.
If your charting platform does not offer VWAP bands natively, you can often find them as community-built indicators. The bands are essential for this strategy, so do not skip them.
Additional filter: This strategy works best on days when the market is range-bound, meaning the price is oscillating within a defined zone rather than trending strongly in one direction. If Nifty opens at 24,000 and spends the day bouncing between 23,950 and 24,050 with no clear directional momentum, that is a mean reversion day. If it opens at 24,000 and marches steadily to 24,200 without looking back, that is a trending day, and you should not use this strategy.
How to Identify a Range-Bound Day Early?
This is one of those “unasked questions” that trips up beginners. You cannot know for certain at 9:30 AM whether the day will be range-bound. But there are clues:
- The ADR (Average Daily Range) check. Calculate the stock’s or index’s average daily range over the last 10 to 15 sessions. In Excel or Google Sheets, you can calculate ADR as:
Create a column for daily Highs (e.g., Column B) and daily Lows (e.g., Column C) for the last 15 days. In a new column (Column D), calculate the daily range for each row: =B2-C2. Drag this formula down for the 15 days. In a separate cell, simply average that new column: =AVERAGE(D2:D16).
If the current day’s range is already approaching the ADR and it is only midday, further expansion is less likely (though not impossible). If the range is unusually small, either a breakout or continued range-bound action could follow.
- Opening behaviour. If the first 20 to 30 minutes show overlapping candles with no decisive direction, the day is likely choppy. If the first 20 minutes show a strong, clean move with expanding volume, expect a trending day.
I have found that pairing both checks together gives a more reliable read than relying on either one alone. There were sessions early on where I classified the day as range-bound purely from the opening candles, only to have a delayed trend kick in around 10:30 AM. Adding the ADR filter caught most of those misjudgements.
The Entry Trigger
For a Long (Buy) Scalp:
The price drops to the lower 2nd standard deviation VWAP band or slightly beyond it.
You observe a rejection candle at this level: a candle with a long lower wick (also called a “tail” or “shadow”) that shows buyers stepped in and pushed the price back up from the low.
Volume on this rejection candle is noticeably higher than the preceding few candles, confirming that the level attracted genuine buying interest.
For a Short (Sell) Scalp:
The mirror image. The price rallies to the upper 2nd standard deviation VWAP band, you see a rejection candle with a long upper wick, and volume confirms selling interest.
The Stop Loss Logic
Place your stop loss a few ticks beyond the extreme of the rejection candle.
Why here? If the price pushes past the point where buyers (or sellers) just showed up, it means the mean reversion thesis has failed, and the price may continue moving away from VWAP. You want to be out immediately.
Example: Price hits the lower VWAP band at ₹23,960. The rejection candle’s low is ₹23,955. You place your stop loss at ₹23,952 (3 ticks below the candle low, giving a small buffer).
The Profit Target Logic
Your primary target is the VWAP line itself, or the 1st standard deviation band if you want a more conservative, quicker exit.
Why? You are betting on a “snap back” to the average. The average is the VWAP. The 1st standard deviation band is a reasonable midpoint.
Example: VWAP is at ₹24,000. The 1st standard deviation band is at ₹23,980. You entered at ₹23,962 (just above the rejection candle close). Your conservative target is ₹23,980 (18 points), and your ambitious target is ₹24,000 (38 points).
A practical approach is to scale out: exit half your position at the 1st band and trail the remainder towards VWAP. In practice, I find the price reaches the 1st band fairly reliably on genuine mean reversion setups, but the full snap back to VWAP completes only about half the time. Scaling out accounts for this unevenness without leaving the entire position exposed.
Stop Loss Logic Calculation
Let us work through a complete example with Nifty Futures (lot size = 65).
| Parameter | Value |
|---|---|
| Entry Price | ₹23,962 |
| Stop Loss | ₹23,952 |
| Target 1 (1st SD Band) | ₹23,980 |
| Target 2 (VWAP) | ₹24,000 |
| Risk per lot | 10 points × 65 = ₹650 |
| Reward at Target 1 per lot | 18 points × 65 = ₹1,170 |
| Reward at Target 2 per lot | 38 points × 65 = ₹2,470 |
| R:R at Target 1 | 1.8 : 1 |
| R:R at Target 2 | 3.8 : 1 |
If you trade 4 lots and exit 2 lots at Target 1 and 2 lots at Target 2:
- Profit from Target 1: 2 lots × ₹1,170 = ₹2,340
- Profit from Target 2: 2 lots × ₹2,470 = ₹4,940
- Total Gross Profit: ₹7,280
The Cost Reality Check: With the 0.02% STT on the sell-side of futures, selling 260 units (4 lots) at these prices carries significant friction. Between STT, brokerage, and exchange fees, your estimated round-trip cost for 4 lots is ~₹1,400.
Important Note (April 2026 STT Revision): The Union Budget 2026 has raised STT on futures from 0.02% to 0.05%, effective 1st April 2026. Once the revised rate applies, the STT component alone for the same trade would roughly double, pushing your estimated round-trip cost for 4 lots closer to ~₹2,800–₹3,000. Factor this into your cost calculations accordingly.
Net Profit (at pre-April 2026 STT): ₹7,280 − ₹1,400 = ₹5,880
And if the trade hits the stop loss:
Loss: 4 lots × ₹650 = ₹2,600 Plus costs: ~₹1,400 Total loss: ₹4,000
This gives you a healthy risk-reward profile where you can afford to lose on several trades and still be net positive if the winners play out.
Best Market Conditions
Range-bound, low-trend days. Consolidation after a big move. Days with no major news catalysts.
When to Avoid It?
Trending days (price is consistently above or below VWAP and not reverting). Days with scheduled high-impact events (RBI policy, major global data releases), as the price can blow through the bands and keep going.
Scalping Strategy 2: The Order Flow Imbalance Scalp
The Core Idea
Let us use a simple analogy. You are standing near a busy road watching cars. If you see 20 cars heading north and only 2 heading south, you can reasonably infer that something interesting is happening to the north. The “imbalance” in traffic direction gives you a directional clue.
The order book in the stock market works similarly. At any moment, there are buyers (bids) lined up at various prices and sellers (asks/offers) lined up at various prices. When there is a significant imbalance, meaning many more aggressive buyers than sellers, or vice versa, it often precedes a short-term price move in the direction of the imbalance.
This strategy does not rely on charts or indicators at all. It reads the raw supply and demand as displayed in the order book and Time & Sales (the real-time feed of every executed trade).
The Setup
You need:
A Level 2 order book (market depth) display showing at least 5 levels of bid and ask with quantities.
A Time & Sales window showing each executed trade with its price, quantity, and whether it was executed at the bid or the ask.
Understanding the Time & Sales data (this is the part most guides skip): When a trade executes “at the ask,” it means a buyer was willing to pay the seller’s price. This is an aggressive buy. When a trade executes “at the bid,” it means a seller was willing to accept the buyer’s price. This is an aggressive sell.
If you see a rapid cluster of large trades all executing at the ask, it tells you: buyers are in a hurry. They are not placing passive limit orders and waiting. They are hitting the ask price to get filled immediately. This urgency often signals a short-term upward price move.
The Entry Trigger
For a Long Scalp:
You notice a persistent bid imbalance in the order book: the total quantity on the bid side (across the visible levels) is significantly larger than the ask side. A ratio of 2:1 or higher is notable.
Simultaneously, the Time & Sales shows a cluster of aggressive buys (trades at the ask) with above-average size. Not one or two large prints, but a sustained cluster over 10 to 30 seconds.
Crucially, the ask price is being “lifted”: the best ask price is moving up as sellers at that level get consumed and the next level of sellers is exposed.
When all three conditions align, you enter long.
For a Short Scalp:
The inverse. Heavy ask-side imbalance, aggressive sells (trades at the bid), and the bid price is “dropping” as buyers at each level get consumed.
A Critical Concept: Spoofing and Fake Orders
This is a common beginner fear, and it is a legitimate one. Sometimes, large orders appear on the order book at certain bid or ask levels, but they are not genuine. They are placed by sophisticated participants to create the illusion of supply or demand, and they are rapidly cancelled before they can be executed. This practice is called spoofing, and it is illegal, but it still occurs.
How to protect yourself?
Do not rely solely on the order book. Always confirm with the Time & Sales. The order book shows intent (which can be faked). The Time & Sales shows actual executed transactions (which are real). If you see a massive bid but the Time & Sales is not showing a corresponding increase in aggressive buying (trades at the ask), be suspicious.
Over time, you will develop an intuition for what “real” order flow looks like versus “artificial” order flow. This takes significant screen time. There is no shortcut. When I first started reading order flow, I acted on what I now recognise as spoofed bids at least a few times a week. The Time & Sales confirmation step eliminated most of those false reads within the first month of disciplined practice.
The Stop Loss Logic
Because this strategy is based on order flow rather than chart levels, the stop loss is typically:
A fixed point/tick stop. For example, 3 to 5 points on Nifty futures. If the anticipated move does not materialise quickly, you exit.
Or, more dynamically: if the order flow reverses (the imbalance flips from bid-heavy to ask-heavy, and aggressive sells replace aggressive buys), you exit immediately regardless of your point-based stop.
The second approach is more nuanced but more effective. The logic is: your reason for being in the trade was the order flow imbalance. If that reason disappears, so should your position.
The Profit Target Logic
Order flow scalps are typically very fast trades (30 seconds to 3 minutes). The profit target is modest: 3 to 8 points on Nifty futures, depending on the intensity of the flow.
Once the initial burst of aggressive activity subsides and the order book starts to balance out, take your profit. Do not wait for the move to “extend.” The edge was in the imbalance, and once the imbalance is absorbed, the edge is gone.
Best Market Conditions
The first 30 minutes of the session (high activity, genuine institutional flow). Around major intraday events (e.g., a Nifty level breaks a widely-watched support or resistance, triggering a rush of orders).
When to Avoid It?
During the midday lull (low volume means the order book is thin and small orders can create misleading imbalances). In extremely choppy, directionless markets where imbalances appear and disappear erratically.
Scalping Strategy 3: The EMA Pullback Scalp (Trend Continuation)
The Core Idea
Imagine you are watching a river flowing downstream. Even as the water flows in one overall direction, it does not move in a perfectly straight line. It swirls, eddies, and occasionally pushes back upstream for a moment before the dominant current pulls it back downstream again.
Stock prices in a trending market behave exactly like this. Even in a strong uptrend on a 1-minute chart, the price does not march upward in a straight line. It makes a move up, then “pulls back” slightly (a brief dip), and then resumes the upward move.
The EMA Pullback Scalp aims to enter during that brief pullback, in the direction of the dominant short-term trend, catching the next “wave” of the move.
The Setup
On a 1-minute chart, apply:
9-period EMA (your fast, “trigger” line) 21-period EMA (your trend confirmation line)
What is an EMA? An Exponential Moving Average gives more weight to recent prices than older ones. A 9-period EMA on a 1-minute chart essentially tells you the weighted average price over the last 9 minutes, with heavier emphasis on the most recent minutes. It reacts faster to price changes than a Simple Moving Average (SMA) of the same period.
Trend Identification:
Uptrend: The 9 EMA is above the 21 EMA, and both are sloping upward. The price is generally above both EMAs. Downtrend: The 9 EMA is below the 21 EMA, and both are sloping downward. The price is generally below both EMAs. No trend (choppy): The EMAs are flat and intertwined. Do not trade this strategy in these conditions.
The Entry Trigger
For a Long Scalp (in an uptrend):
Confirm the uptrend: 9 EMA is above 21 EMA, both sloping up. Wait for the price to pull back and touch or come very close to the 9 EMA. This is the “dip” in the ongoing uptrend. Watch the candle that touches the 9 EMA. You want to see a bullish reaction: a candle that closes green/bullish with its close near its high, or a candle with a lower wick showing buyers defended the EMA level. Enter long at the close of this reaction candle (or on the open of the next candle).
For a Short Scalp (in a downtrend):
Mirror image. Wait for price to rally back up towards the 9 EMA in a downtrend, see a bearish rejection, and enter short.
What If the Price Pulls Back Deeper, Past the 9 EMA?
Great question, and one that beginners often worry about. If the price pulls back through the 9 EMA and touches the 21 EMA, this can still be a valid entry, as long as the 21 EMA holds and the overall trend structure (higher highs, higher lows) is intact.
However, if the price blows through both EMAs and the 9 EMA crosses below the 21 EMA, the trend has likely ended or paused. Cancel the trade idea and wait for a new trend to establish.
One thing worth noting: the deeper pullbacks to the 21 EMA tend to produce slightly better reward-to-risk ratios when they work, but they also fail more often than the clean 9 EMA touches. We tend to see the highest-probability entries on pullbacks that touch the 9 EMA precisely and bounce within one or two candles. If the price lingers near the EMA for four or five candles without a decisive reaction, the momentum behind the trend may already be fading.
The Stop Loss Logic
Place the stop loss just below the most recent swing low (in an uptrend) or just above the most recent swing high (in a downtrend).
What is a swing low? In an uptrend, the price makes a series of short-term dips (lows) and peaks (highs). Each dip forms a “swing low.” Your stop loss goes a few ticks below the lowest point of the pullback candle or the most recent minor low, whichever gives a tighter, more logical level.
The Profit Target Logic
There are two common approaches:
Approach A: Fixed R:R target. If your stop loss is 10 points, set your target at 1.5× to 2× that, so 15 to 20 points.
Approach B: Trail your stop. Instead of a fixed target, you trail your stop loss upward as the price makes new highs. A common method is to trail the stop just below each new swing low that forms. You stay in the trade until the price violates a swing low, which means the trend has stalled or reversed.
Approach A is simpler and better for beginners. Approach B captures more of the trend but requires more active management and experience.
A Worked Example
Nifty futures, 1-minute chart. The 9 EMA is at 24,020 and rising. The 21 EMA is at 24,010 and rising. The price has been making higher highs and higher lows for the past 15 minutes.
| Parameter | Value |
|---|---|
| Entry (on bounce from 9 EMA) | ₹24,022 |
| Pullback candle low | ₹24,007 |
| Stop Loss | ₹24,004 (18 points risk) |
| Target (1.55× R:R) | ₹24,050 (28 points reward) |
| Risk per lot (65 units) | 18 × 65 = ₹1,170 |
| Reward per lot | 28 × 65 = ₹1,820 |
| R:R Ratio | 1.55 : 1 |
If you trade 4 lots:
Winning trade: 4 × ₹1,820 = ₹7,280. (Minus ~₹1,400 round-trip costs = ₹5,880 net)
Losing trade: 4 × ₹1,170 = ₹4,680. (Plus ~₹1,400 round-trip costs = ₹6,080 net loss)
With a 55% win rate over 20 trades:
11 winners × ₹5,880 = ₹64,680
9 losers × ₹6,080 = ₹54,720.
Net daily profit: approximately ₹9,960.
This example illustrates why a solid point capture combined with a reasonable win rate and disciplined execution is necessary to outrun high transactional friction in the F&O market.
Best Market Conditions
Trending mornings (strong gap-up or gap-down days where directional momentum carries through). Sessions following a significant catalyst (earnings surprise, policy announcement) where one side of the market is in clear control.
When to Avoid It?
Flat, range-bound days (the EMAs will flatten, and pullbacks will turn into reversals). Late in the session, when trends often lose steam. The first 5 to 10 minutes of the day, when the EMAs have not accumulated enough data to be meaningful.
Scalping Strategy 4: The Breakout Reclaim Scalp
The Core Idea
This is one of the most elegant scalping strategies because it specifically targets a scenario where many traders get trapped, and it profits from their discomfort.
Here is the concept. When the price breaks above a resistance level, many traders jump in and buy the breakout. But sometimes, the breakout fails, and the price drops back below the resistance level. Now, all those breakout buyers are “trapped” in losing long positions.
If the price then rallies back up and reclaims the resistance level (breaks above it for a second time), something powerful happens: the trapped breakout buyers who did not yet exit breathe a sigh of relief, and fresh buyers who missed the first breakout jump in. This double wave of buying often creates a sharp, decisive move.
The Breakout Reclaim strategy waits for this second, more reliable attempt.
Why Not Just Trade the First Breakout?
Because first breakouts have a notoriously high failure rate, especially on short timeframes. Experienced scalpers know that the first break of a level is often a “test.” The real move comes when the level is reclaimed after a brief failure.
Think of it like knocking on a door. The first knock might not be answered. But if you knock a second time and the door opens, you know someone is actually home.
The Setup
Identify a clear horizontal resistance level on the 1-minute or 5-minute chart. This could be:
The previous session’s high. The current day’s high (if it has been tested multiple times). A round number (e.g., 24,000, 24,500) where you can visually see the price has reversed in the past.
Wait for the price to break above this level. Wait for the price to fail and drop back below the level. The price should ideally spend a few candles below the level, not just touch it and bounce back immediately.
Now the setup is “armed.” You are watching for the reclaim.
The Entry Trigger
The price pushes back above the resistance level for a second time, and a 1-minute candle closes above the level with decent volume. You enter long on this candle’s close (or on the open of the next candle).
Key nuance: The candle’s close should be comfortably above the level, not just poking above by a tick. If the resistance was ₹24,050, you want the candle to close at ₹24,053 or higher, not at ₹24,050.05. A marginal close suggests the level is still being contested.
The Stop Loss Logic
Place the stop loss just below the low of the candle that reclaimed the level, or just below the resistance level itself, whichever is tighter.
Why? If the price drops back below the resistance after the second attempt, the level has been decisively rejected, and your thesis is invalid. Two failed breakouts in a row is a strong bearish signal for that level.
The Profit Target Logic
Because the reclaim entry often triggers a strong move (due to the double wave of buying pressure described above), the profit potential can be generous relative to the risk.
Conservative target: 1.5× your stop loss distance. Aggressive target: The next visible resistance level on the chart, or 2× your stop loss. Trailing stop approach: If the breakout move accelerates, trail your stop behind each new 1-minute candle low to ride the momentum.
A Worked Example
Nifty futures. The previous session’s high was 24,100. Today, the price breaks above 24,100, reaching 24,112, but then reverses and drops back to 24,088.
Several minutes pass. The price consolidates between 24,085 and 24,098. Then, a 1-minute candle with above-average volume pushes through 24,100 and closes at 24,106.
| Parameter | Value |
|---|---|
| Resistance Level | ₹24,100 |
| Entry (candle close) | ₹24,106 |
| Reclaim candle low | ₹24,097 |
| Stop Loss | ₹24,094 (3 ticks below candle low) |
| Risk | 12 points |
| Target (2× risk) | ₹24,130 (24 points) |
| Risk per lot | 12 × 65 = ₹780 |
| Reward per lot | 24 × 65 = ₹1,560 |
| R:R Ratio | 2 : 1 |
This 2:1 R:R means you only need to be right about 40% of the time (after costs) to break even. If your win rate on this setup is 50% or better, you are in a very strong position.
The Short Side (Breakdown Reclaim)
The exact same logic works in reverse for short trades. Replace “resistance” with “support,” “break above” with “break below,” and “reclaim” with “reclaim to the downside.” When a support level is broken, fails, price rallies back above support, and then breaks down through it again on the second attempt, that is a breakdown reclaim, and you enter short.
Best Market Conditions
Markets transitioning from consolidation to trend. The first hour of trading, when key levels from the previous day are tested. Sessions with moderate volatility (enough to produce breakout attempts, but not so wild that everything is noise).
When to Avoid It
Low-volatility days where the price barely approaches key levels. Extremely volatile days where levels get broken repeatedly without any sustained moves. If the key level has been broken and reclaimed more than twice already during the session, it is “worn out,” and any further break is unlikely to generate a clean move.
I learned this the hard way by taking a third reclaim attempt on a level that had already been breached twice in both directions. The move had no follow-through, and the stop was hit within a minute. Two attempts is the practical ceiling for this setup.
Scalping Strategy 5: The Opening Range Scalp
The Core Idea
The first 15 to 30 minutes of the trading session are a battleground. Overnight orders get executed, global cues get priced in, and institutional participants stake their initial positions. After this initial flurry, the market often establishes a “range” for the early part of the day.
The Opening Range (OR) is simply the high and the low of this initial period.
The idea is straightforward. Once the opening range is defined, a decisive break above its high or below its low often signals the direction for the next leg of movement.
The Setup
Allow the first 15 minutes of the trading session to pass. Do not take any trades during this period. Just observe.
At 9:30 AM (assuming a 9:15 AM open), mark the high and low of the first 15-minute candle on your chart. This is your Opening Range.
Some traders use a 30-minute opening range instead (marking the high and low at 9:45 AM). The 30-minute range is wider, which means fewer false breakouts but also later entries. The 15-minute range gives earlier signals but more false breaks. You can experiment with both during your paper trading phase to see which suits your personality.
I personally settled on the 15-minute range after testing both across several weeks, but there were sessions where the 30-minute range would have filtered out a false breakout that the 15-minute version did not. Neither is universally better.
Note the width of the opening range. This matters for your target and for assessing whether the trade is worth taking.
The Entry Trigger
Long entry: The price breaks above the opening range high with a 1-minute candle closing above it, accompanied by a volume surge.
Short entry: The price breaks below the opening range low with a 1-minute candle closing below it, accompanied by a volume surge.
The volume confirmation is essential. An opening range breakout without volume is highly suspicious and likely to fail. You want to see volume on the breakout candle that is at least 1.5 to 2 times the average volume of the preceding candles.
Filtering the Trade: Is the Opening Range Worth Trading?
Not every opening range breakout is worth acting on. Here are filters to apply:
Filter 1: Width of the range.
If the opening range is extremely narrow (e.g., only 10 to 15 points on Nifty), the breakout can be explosive because a narrow range implies coiled energy. If the range is very wide (e.g., 80 to 100 points), a breakout means the price has already moved significantly, and the remaining potential may be limited.
A useful guideline: if the opening range width is less than 30% to 40% of the instrument’s average daily range (ADR), it is a strong candidate for a breakout trade.
Filter 2: Alignment with the larger trend.
If the 15-minute or 30-minute chart shows a clear uptrend, and the opening range breakout is to the upside, the trade has higher conviction. A breakout against the larger trend is riskier.
Filter 3: Where is VWAP?
If the breakout is to the upside and VWAP is below the current price (confirming bullish sentiment for the day), the trade is stronger.
The Stop Loss Logic
Place the stop loss at the midpoint of the opening range, or at the opposite end of the range, depending on your risk tolerance.
Aggressive stop (midpoint): Higher chance of being stopped out, but smaller risk per trade. Conservative stop (opposite end): Lower chance of being stopped out, but larger risk per trade, which means you must reduce your position size to keep the rupee risk within your per-trade limit.
Example:
Opening range: High = 24,060, Low = 24,030. Midpoint = 24,045. You enter long at 24,063 (breakout candle close).
Aggressive stop: 24,045. Risk = 18 points. Conservative stop: 24,028 (just below the range low). Risk = 35 points.
If your per-trade risk budget is ₹2,500 and you are trading Nifty futures (₹65 per point per lot):
- With the aggressive stop: ₹2,500 / (18 × 65) = ₹2,500 / ₹1,170 = 2.1 lots → 2 lots
- With the conservative stop: ₹2,500 / (35 × 65) = ₹2,500 / ₹2,275 = 1.1 lots → 1 lot
See how the stop loss placement directly controls your position size? This is risk management in action.
The Profit Target Logic
Approach 1: Range projection.
Measure the width of the opening range and project it from the breakout point. Opening range width = 24,060 − 24,030 = 30 points. If you entered long at 24,063, target = 24,063 + 30 = 24,093.
This “range projection” is based on a widely observed tendency: the first breakout move after a consolidation often covers approximately the same distance as the consolidation range itself.
Approach 2: Next key level.
If there is a visible resistance level at, say, 24,100 (the previous session’s high), you might use that as your target instead.
Approach 3: Trailing stop.
Once the price moves 1× the opening range width in your favour, move your stop to breakeven (your entry price). Then trail the stop behind each successive 5-minute candle low (for a long trade) to capture as much of the move as possible.
Best Market Conditions
Days with a clear catalyst (strong global cues, important data release, earnings season). Days where the opening range is narrow relative to the ADR, suggesting a big move is coiling.
When to Avoid It?
Days where the market opens flat and the opening range is wide and choppy (no clear “coil” of energy). Fridays before a long weekend (lower participation, choppy action). Days with no catalyst where the market is likely to drift aimlessly.
Scalping Strategy 6: The Relative Strength / Relative Weakness Scalp
The Core Idea
Imagine two runners in a race. Both are running uphill, but Runner A is barely slowing down while Runner B is gasping and falling behind. If you had to bet on who finishes first, you would pick Runner A.
In the market, the “hill” is the overall market direction (as represented by the index, like Nifty). Individual stocks or sectors are the runners. Some stocks move faster than the index (they are showing relative strength), while others lag behind (they are showing relative weakness).
This strategy identifies stocks that are outperforming or underperforming the index in real-time and takes scalp trades in the direction of that divergence.
The Setup
You need two charts open simultaneously:
The index (Nifty futures, 1-minute chart). The stock you are considering trading (1-minute chart).
You can also use a relative strength indicator or a ratio chart (stock price / Nifty price) if your platform supports it. But even a simple side-by-side visual comparison works.
Identifying Relative Strength and Weakness
Relative strength (for long trades): Nifty is flat or slightly down, but the stock is green and making new intraday highs. Nifty makes a pullback, and the stock barely dips (or does not dip at all). Nifty and the stock both rally, but the stock rallies more aggressively.
Relative weakness (for short trades): Nifty is flat or slightly up, but the stock is red and making new intraday lows. Nifty rallies, and the stock barely follows (or continues to fall).
The Entry Trigger
For a Long Scalp on a Relatively Strong Stock:
Nifty makes a short-term pullback (a brief dip on the 1-minute chart). The strong stock holds its ground, perhaps dipping a tiny amount or staying flat. As Nifty stabilises and begins to recover from the pullback, you enter long on the strong stock.
The logic: When the overall market was pulling back, this stock resisted the decline. Now that the market is recovering, this stock is likely to jump even higher, because whatever force (institutional buying, positive news, sector momentum) is driving its relative strength will reassert itself.
For a Short Scalp on a Relatively Weak Stock:
The mirror image. Nifty bounces, the weak stock barely participates, and when Nifty starts its next dip, you short the weak stock.
The Stop Loss Logic
Use the stock’s own price structure for the stop loss, not the index’s movement.
For a long trade on a strong stock: stop below the stock’s most recent swing low on the 1-minute chart. For a short trade on a weak stock: stop above the stock’s most recent swing high.
The Profit Target Logic
Because relatively strong or weak stocks tend to make extended moves (the divergence often persists for a large portion of the day), these trades can yield larger profits than pure index scalping. Use a fixed R:R of 2:1 as a baseline. Or trail your stop as the stock makes new highs (for longs) or new lows (for shorts).
A Practical Consideration: Choosing the Right Stock
You cannot manually screen all 50 Nifty stocks every morning. Here are practical ways to identify relative strength and weakness candidates:
- Pre-market scans: Many platforms allow you to sort stocks by their percentage change relative to the index. Look for stocks that are significantly outperforming or underperforming the Nifty in the first 15 to 30 minutes.
- Sector observation: If the IT sector is rallying hard while Nifty is flat, individual IT stocks (especially the most liquid ones) are showing sector-level relative strength and are potential candidates.
- Heatmaps: Visual heatmaps that display Nifty 50 stocks by their daily performance make it easy to spot outliers at a glance.
One mistake I made early on was chasing relative strength in mid-cap names with thin order books. The divergence signal was genuine, but the slippage on entry and exit erased most of the edge. For this strategy, stick to the most liquid names in the index. The signal may be slightly less dramatic, but the execution will be far cleaner.
Best Market Conditions
Days where specific sectors or stocks are reacting to targeted news (sector earnings, regulatory changes, global commodity moves) while the broader index is relatively calm. These create clear divergences to exploit.
When to Avoid It?
Days where the entire market is moving in lockstep (either a broad-based rally or a broad-based decline). In such conditions, there is little divergence to exploit because all stocks are moving with the tide.
Combining Strategies: The Confluence Approach
Experienced scalpers rarely rely on a single strategy in isolation. Instead, they look for confluence, meaning situations where two or more independent signals align in the same direction.
For example:
The price is pulling back to the 9 EMA in an uptrend (EMA Pullback setup), AND it is simultaneously approaching the VWAP from above (VWAP acting as support). Two independent reasons to buy.
A stock is showing relative strength while Nifty is flat (Relative Strength setup), AND the stock is breaking out above its opening range high (Opening Range Breakout setup). Two independent reasons to go long.
When multiple strategies converge on the same trade, the probability of success increases, and many scalpers feel comfortable taking a slightly larger position on high-confluence trades (while still staying within their maximum per-trade risk limit).
However, do not fall into the trap of requiring perfect confluence on every trade. The market is messy, and waiting for 4 or 5 signals to align simultaneously will mean you almost never trade. Two strong, independent signals is generally sufficient.
Building a Strategy Selection Framework
With multiple strategies available, a natural question arises: “Which one do I use today?”
The answer depends on the market conditions. Here is a simple decision framework:
| Market Condition | How to Identify | Preferred Strategies |
|---|---|---|
| Strong Trend | EMAs fanning apart, price consistently on one side of VWAP, higher highs and higher lows (or lower highs and lower lows) | EMA Pullback, Relative Strength/Weakness |
| Range-Bound / Mean-Reverting | EMAs flat and intertwined, price oscillating around VWAP, no new highs or lows | VWAP Mean Reversion |
| Breakout / Transition | Narrow consolidation followed by a volume spike, key levels being tested | Breakout Reclaim, Opening Range Breakout |
| High Institutional Activity | Large prints on Time & Sales, visible order book imbalances | Order Flow Imbalance |
Spend the first 15 to 20 minutes of the session observing the market to classify the condition. Then select the 1 or 2 strategies that fit that condition. This prevents the common mistake of applying a trending strategy to a range-bound market (or vice versa), which is one of the fastest ways to accumulate losses.
We have all done it at some point: forcing an EMA pullback trade on a day that was clearly mean-reverting, simply because the pullback setup felt more familiar. The strategy selection step is not glamorous, but it prevents a surprising number of avoidable losses.
Position Sizing Across Strategies: A Unified Framework
Regardless of which strategy you use, your position sizing formula remains the same. This is critical. The strategy changes; the risk discipline does not.
Beginners usually calculate how many lots their risk limit allows, and stop there. Professionals calculate their risk limit, check their margin limit, and always trade the smaller of the two numbers.
Step 1: The Risk Limit
- Maximum Risk Per Trade = Your total capital × per-trade risk percentage (e.g., 0.5%)
- Risk Per Lot = Stop loss distance (in points) × lot size (65 for Nifty)
- Risk-Allowed Lots = Maximum Risk Per Trade / Risk Per Lot
Step 2: The Margin Check
Holding 1 lot of Nifty Futures requires roughly ₹1,78,000 in exchange margin (this fluctuates slightly with volatility).
- Margin-Allowed Lots = Total Capital / ₹1,78,000
Let us walk through it with real numbers:
- Capital: ₹5,00,000
- Per-trade risk: 0.5% = ₹2,500
- Strategy: EMA Pullback Scalp
- Stop loss: 8 points
The Risk Calculation:
- Risk per lot = 8 points × 65 = ₹520
- Risk-Allowed Lots = ₹2,500 / ₹520 = 4.8 lots (Round down to 4 lots).
The Margin Calculation:
- Margin-Allowed Lots = ₹5,00,000 / ₹1,78,000 = 2.8 lots (Round down to 2 lots).
The Final Decision:
Your risk rules say you can trade 4 lots. The exchange rules say your capital only supports 2 lots. Your actual position size is 2 lots.
Notice how this dual-check system protects you. If your stop loss was very tight (say, 4 points), your risk limit might tell you to buy 9 lots. But your margin check will hard-stop you at 2 lots, preventing you from over-leveraging your account on a single “sure thing.”
In Excel, you can set this up with a simple formula:
- Cell A1: Capital → 500000
- Cell A2: Risk % → 0.005
- Cell A3: Max Risk Per Trade → =A1A2 (Result: 2500)
- Cell A4: Stop Loss (points) → Enter your stop distance (e.g., 8)
- Cell A5: Lot Multiplier → 65 Cell A6: Risk-Allowed Lots → =ROUNDDOWN(A3/(A4A5), 0) (Result: 4)
- Cell A7: Margin Per Lot → 178000
- Cell A8: Margin-Allowed Lots → =ROUNDDOWN(A1/A7, 0) (Result: 2)
- Cell A9: FINAL POSITION SIZE (Lots) → =MIN(A6, A8) (Result: 2)
Change the stop loss in cell A4 for each trade, and the formula instantly tells you how many lots to trade.
The Strategy Testing Process: Paper Trade Before You Risk a Rupee
I cannot stress this enough: reading about a strategy and executing it profitably are two entirely different experiences.
Continue Reading: Is Scalping Profitable?
Before deploying any of these strategies with real capital, you must paper trade it for a minimum of 4 to 6 weeks. Here is a structured process:
Week 1 to 2: Single Strategy Focus
Choose one strategy (I recommend starting with the EMA Pullback Scalp or the VWAP Mean Reversion Scalp, as they are the most clearly defined). Trade only that strategy, on only one instrument (e.g., Nifty futures), for two weeks. Log every trade in your journal.
Week 3 to 4: Measure and Evaluate
At the end of two weeks, calculate:
Win rate: Number of winners / Total trades Average winner size (in ₹): Total profit from winners / Number of winners Average loser size (in ₹): Total loss from losers / Number of losers Profit factor: Total gross profit / Total gross loss. A profit factor above 1.5 is strong. Net P&L after estimated costs: Do the costs eat your edge? Be honest.
If the strategy shows a positive edge after costs, proceed. If it does not, either refine your execution (are you entering too late? exiting too early?) or try a different strategy.
Week 5 to 6: Add a Second Strategy
Once you are comfortable with one strategy, add a second one that suits a different market condition (e.g., if your first strategy was the EMA Pullback for trending markets, add the VWAP Mean Reversion for range-bound days). Repeat the testing process.
The goal is to build a “toolkit” of 2 to 3 strategies that, between them, cover most market conditions. You do not need seven strategies. You need two or three that you understand deeply and can execute reflexively.
Explore more about:
Frequently Asked Questions
How many strategies should I use in a single day?
Ideally, one. Occasionally, two, if the market condition clearly shifts during the day (e.g., a trending morning gives way to a range-bound afternoon). Switching strategies constantly within the same session is a sign of indecision, not adaptability.
Can I use these strategies on stocks instead of index futures?
Yes, but with caveats. Ensure the stock is extremely liquid (high daily volume, tight bid-ask spread). Be aware that individual stocks can gap or spike on company-specific news, which adds risk that index futures largely smooth out. The EMA Pullback and Relative Strength strategies are particularly well-suited for liquid stocks.
What timeframe should I use for these strategies?
All strategies in this guide are designed for the 1-minute chart, with the 5-minute chart as a secondary confirmation tool. Some scalpers use tick charts or 15-second charts for even faster execution, but these are advanced approaches that are unnecessary for someone building their foundation.
I have a full-time job. Can I still scalp during specific hours?
Scalping demands continuous attention during the trades. If you can dedicate the first 90 minutes of the session (9:15 AM to 10:45 AM), this is the period with the richest setups and deepest liquidity. Even 3 to 5 well-executed trades during this window can be a meaningful session. The key is: if you are in a trade, you must be fully present. You cannot monitor a scalp trade between meetings.
How long does it take to become consistently profitable at scalping?
There is no honest one-size-fits-all answer. Most traders who eventually become consistent report that it took them 6 to 18 months of dedicated practice, including significant time spent paper trading and reviewing their journal. Some take longer. A few, very few, click sooner. Treat the first 6 months as tuition, not as a performance benchmark. If you are still in the learning phase and not losing significant capital (because you are paper trading or using a minimum size), you are on the right track.
What if two of my strategies give conflicting signals simultaneously?
Do nothing. Conflicting signals mean the market condition is ambiguous. Sitting out is a perfectly valid decision and often the most profitable one in the long run. The market will present clearer opportunities later. It always does.
Closing Thoughts
If you have read this far, you now possess something genuinely valuable: a structured, tested, and honest framework for approaching the market as a scalper. Not hype, not “secret indicators,” not “one weird trick.” Just clean, logical strategies, each suited to a specific market condition, backed by risk management principles that protect your capital when you are wrong.
But I want to leave you with something that no strategy guide can fully teach: patience with yourself.
You will have losing days. You will occasionally break a rule and regret it. You will feel the urge to trade when you know you should be sitting still. This is not failure. This is the learning process. Every experienced scalper you admire went through the same struggles.
The traders who ultimately succeed are not the ones with the highest IQ or the fastest internet connection. They are the ones who consistently show up, review their journal honestly, refine their approach, and respect the process.
You have the strategies now. The rest is practice, discipline, and time.
Happy learning! 🙂
Disclaimer: This content is for educational purposes only and does not constitute financial or investment advice. Investments in securities or other financial instruments are subject to market risk, including partial or total loss of capital. Past performance is not indicative of future results. Always consider your financial situation carefully and consult a licensed financial advisor before making investment or trading decisions.
Table of Content
- Quick Summary
- Why Strategy Matters More Than Speed?
- The VWAP Mean Reversion Scalp
- The Order Flow Imbalance Scalp
- The EMA Pullback Scalp (Trend Continuation)
- The Breakout Reclaim Scalp
- The Opening Range Scalp
- The Relative Strength / Relative Weakness Scalp
- Combining Strategies
- Building a Strategy Selection Framework
- Position Sizing Across Strategies
- The Strategy Testing Process
- Frequently Asked Questions
- Closing Thoughts
Engineered for the obsessed. Built for traders.

Purpose-built terminals.
Zero compromise.
Built for speed.
Plot No 1290, 2nd Floor, 17th Cross, 5th Main, Sector-7, HSR Layout, Bangalore 560102
Follow us on
Mintcap Brokers Private Limited
CIN – U66110KA2023PTC178706 | Registered Address: Plot No 1290, Second Floor, 17th Cross, 5th Main, Sector-7, HSR Layout, Bangalore 560102 | Tel: 080 – 49552310 | Email ID: compliance@capmint.com | SEBI registered Stock Broker: INZ000322732 | NSE Cash/F&O Member ID: 90430 | BSE Cash/F&O Member ID: 6903 | MCX Member ID: 57400 | NCDEX Member ID: 1312 | SEBI registered Depository Participant: IN-DP-806-2025 | CDSL DP ID: 12102300 | NSE Clearing Member code: M70108 | AMFI-Registered Mutual Fund Distributor: ARN-289109 (Valid upto 28-Feb-2027) | Category II Execution Only Platform : E6903
Details of Client Bank Account
Compliance Officer: Ms. Shridevi Vungarala | Email ID: compliance@capmint.com | Tel no. + 91 9035330126 | Grievance Redressal Officer (GRO) – Ms. Shikha Gupta | Email ID: Grievance@capmint.com | Tel no: 9035331595.
Procedure to file a complaint on SEBI SCORES: Register on SCORES portal. Mandatory details for filing complaints on SCORES: Name, PAN, Address, Mobile Number, E-mail ID. Benefits: Effective Communication, Speedy redressal of the grievances. You may refer the website https://scores.sebi.gov.in/ for more information. You may also download the SEBI Scores app to log a complaint Android: https://play.google.com > store > apps > sebiscores iOS: https://apps.apple.com > app > sebiscores
Disclaimer
Investment in the securities market are subject to market risks, read all the related documents carefully before investing. Brokerage will not exceed the SEBI prescribed limit.
Mutual fund investments are subject to market risks, read all scheme related documents carefully before investing. Mutual Funds are not exchange-traded products.
Attention Investor:
- Stock Brokers can accept securities as margin from clients only by way of pledge in the depository system w.e.f. September 1, 2020.
- Update your mobile number & email Id with your stock broker/depository participant and receive OTP directly from depository on your email id and/or mobile number to create pledge.
- Pay 20% as upfront margin of the transaction value to trade in cash market segment.
- Investors may please refer to the Exchange’s Frequently Asked Questions (FAQs) issued vide circular reference NSE/INSP/45191 dated July 31, 2020 and NSE/INSP/45534 dated August 31, 2020 and other guidelines issued from time to time in this regard.
- Check your Securities /MF/ Bonds in the consolidated account statement issued by NSDL/CDSL every month.