
Table of Content
- What are Supply and Demand Zones?
- Why Supply and Demand Trading Works?
- How to Identify Supply and Demand Zones?
- How to Trade Supply and Demand Zones?
- How to Identify Strong Supply and Demand Zones (5 Criteria)?
- Common Mistakes Traders Make with Supply and Demand
- How Supply and Demand Apply Across Timeframes?
- FAQs Related to Supply and Demand Zones in Trading
- Closing Thoughts
Link copied!
What Are Supply and Demand Zones? A Complete Guide for Traders
Supply and demand zones are areas on a chart where strong buying or selling has previously entered the market. This guide explains how these zones form, how to identify them, and how traders use them to anticipate price movements.
Most traders look at a chart and see candles.
Experienced traders look at the same chart and see intent.
That single difference in perception separates consistently profitable participants from the majority who exit markets frustrated, blaming noise, news, or bad luck.
Supply and demand zones are not a new concept. They are not a secret indicator. They are the visual footprint of large capital entering and exiting the market, and once you learn to read those footprints, you stop reacting to price and start anticipating it.
This guide breaks down the entire framework into five parts:
- What these zones are,
- Why they work,
- How to identify them,
- how to trade them, and
- The five criteria that separate high-probability zones from weak ones.
Prefer a video walkthrough?
Watch the full supply and demand trading strategy video masterclass here.
What are Supply and Demand Zones?
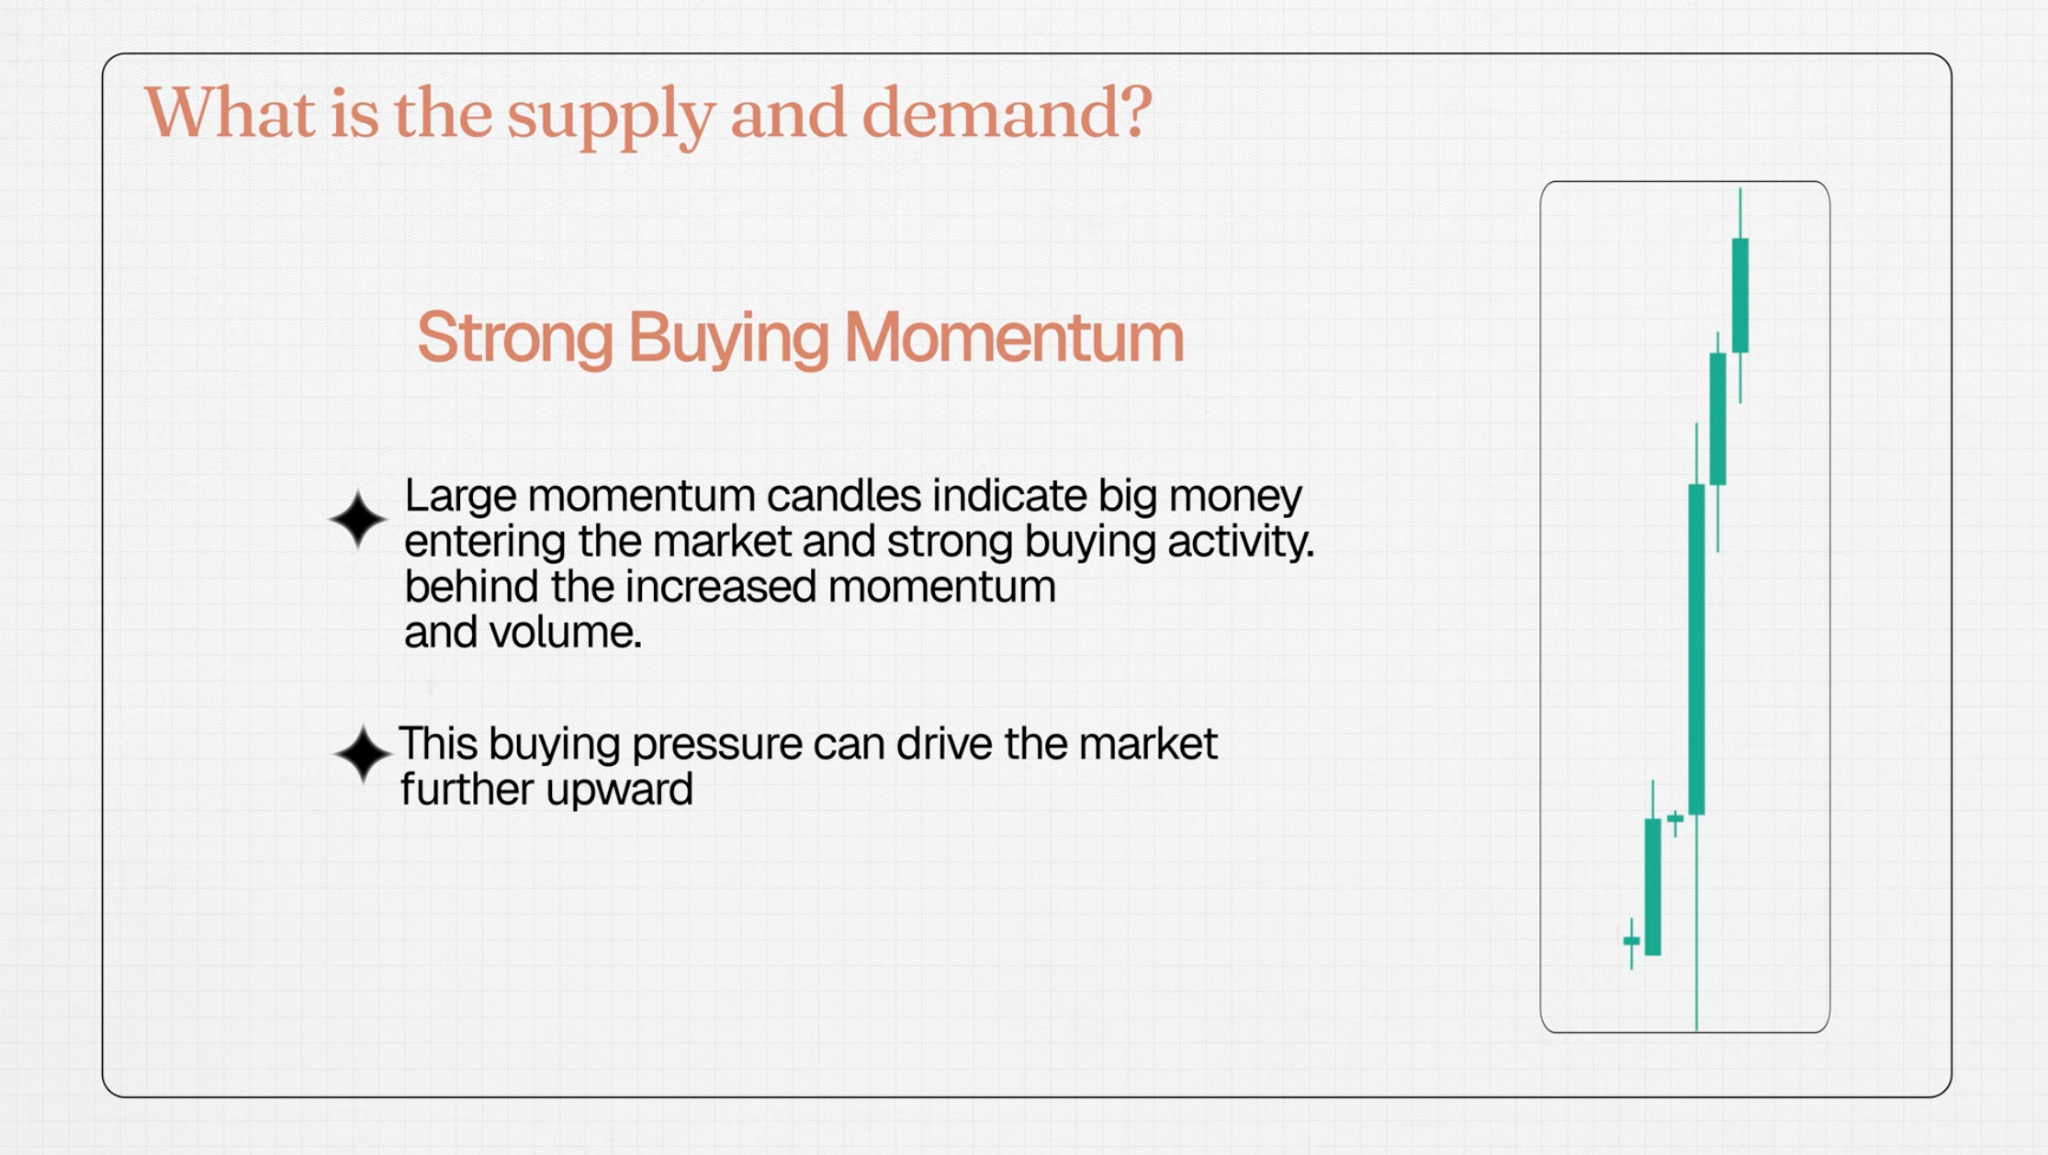
Supply and demand zones are areas of aggressive buying or aggressive selling.
When large institutional orders, funds, or high-volume operators enter the market, they cannot do so quietly. Their size forces the price to move sharply. That sharp, momentum-driven movement leaves a visible mark on the chart, and the origin point of that movement is where the zone lives.
Look at a cluster of three or four large-bodied candles moving in one direction. That momentum is not retail traders hitting market orders. That is concentrated order flow from participants with sufficient size to displace the price visibly.
The zone is simply the price area where that order flow originated.
A demand zone is the origin of a strong upward move, where buyers entered aggressively.
A supply zone is the origin of a strong downward move, where sellers entered aggressively.
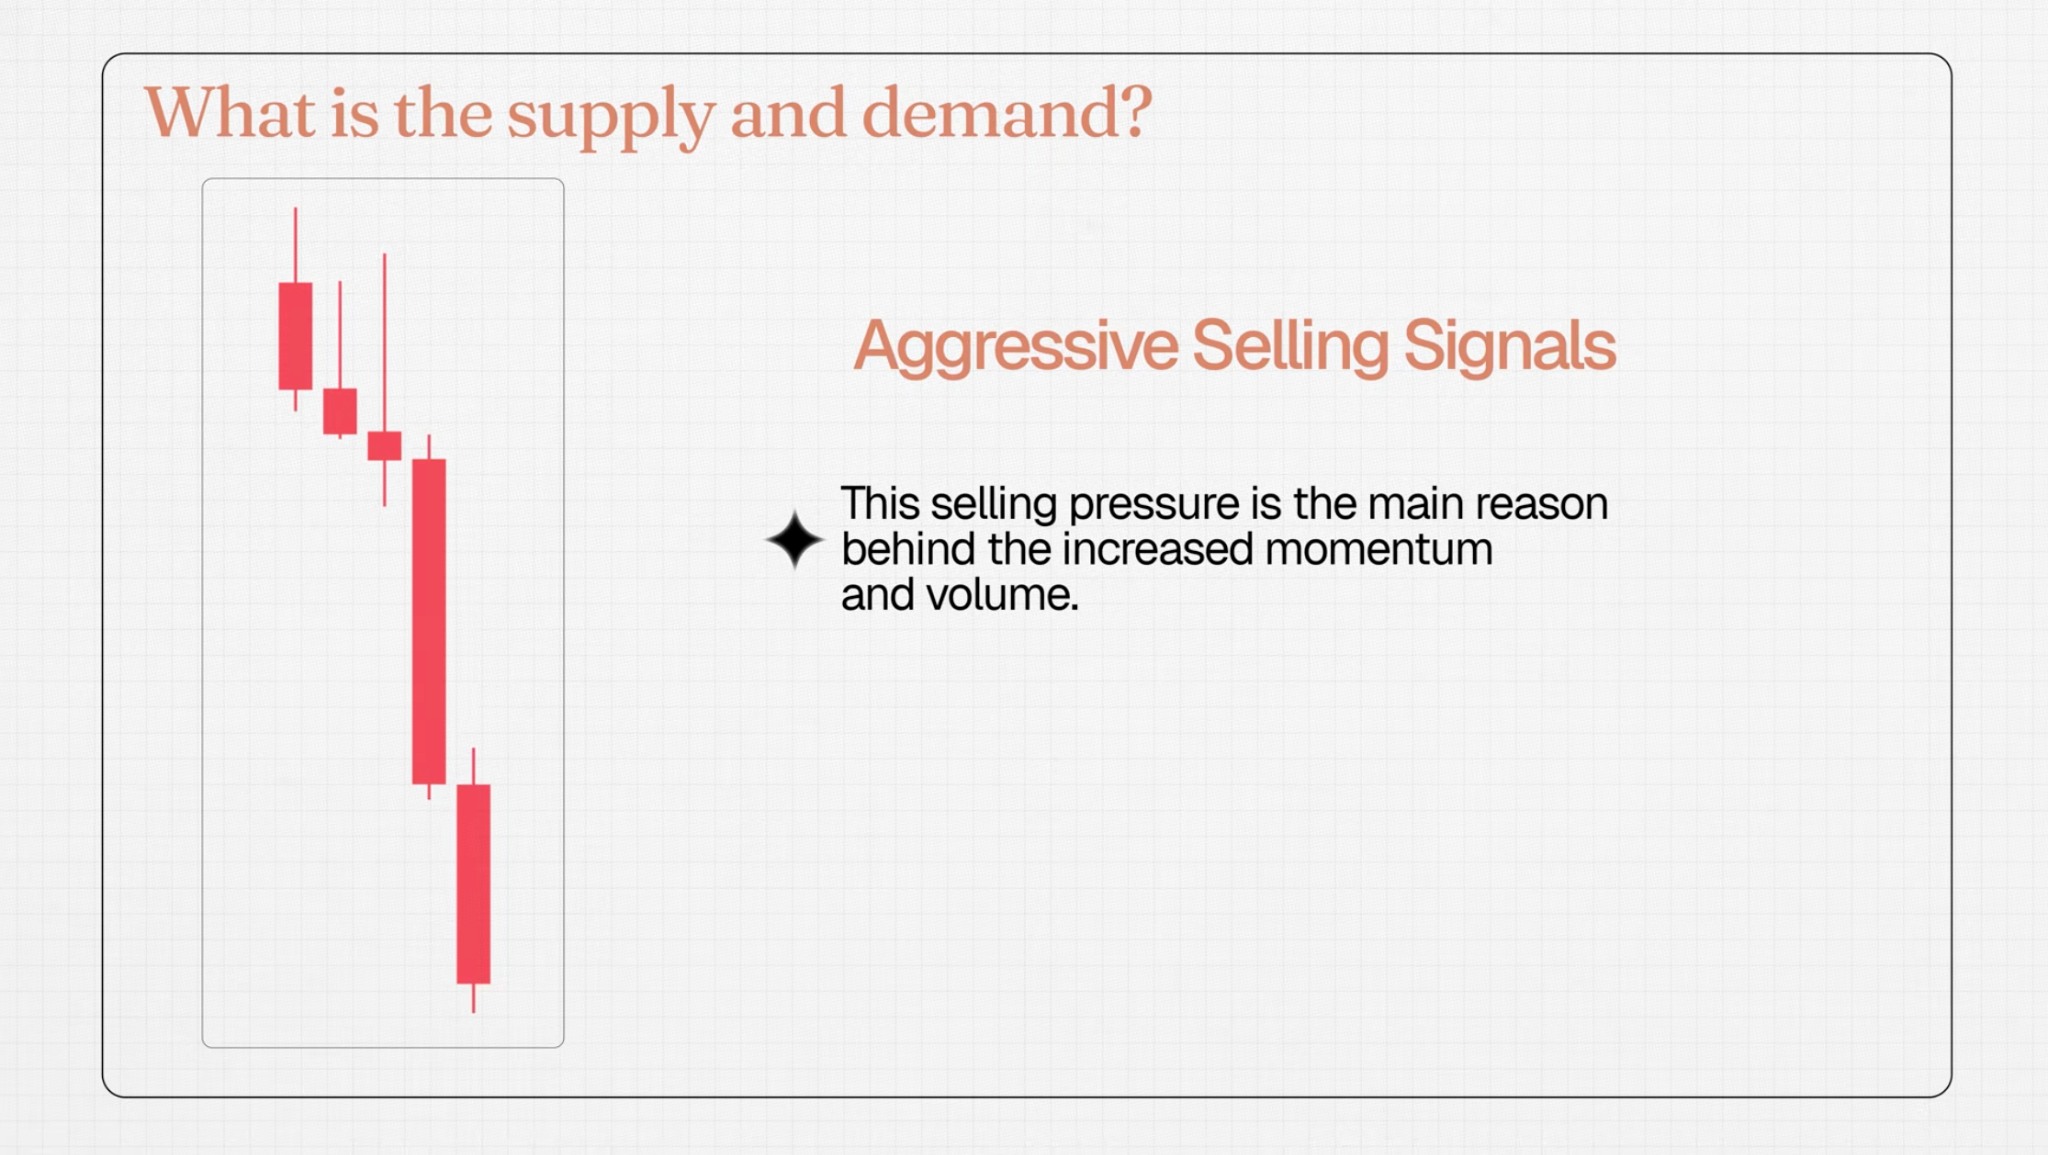
Those large participants do not fill their entire position in one candle. They enter in tranches. When the price returns to that origin zone, the remaining unfilled portion of their order still sits there. That residual order is what causes the price to react sharply when it revisits the zone.
I noticed this most clearly on the Nifty 15-minute chart during trending sessions. Price would return to a base candle formed two or three hours earlier and react within a few points of its origin, with no visible fundamental catalyst.
This is not pattern trading. It is order flow logic.
Why Supply and Demand Trading Works?
Consider what you are actually trying to do as a trader.
You are trying to place yourself on the right side of a move before it happens, with a defined risk if you are wrong.
Supply and demand zones give you three structural advantages.
The first is asymmetry.
Zones define a precise area where price is either likely to hold or break. This allows tight stop placement below or above the zone, which creates favourable risk-to-reward setups without requiring prediction.
The second is repeatability.
Large operators who entered at a zone will defend that zone when the price returns. Not out of loyalty to a level, but because they need a price to move away from their entry to remain profitable. That defence creates predictable reactions that repeat across timeframes.
The third is context.
Zones force you to think in terms of origin, not just current price. Instead of asking “where is price now,” you start asking “where did this move come from”, and “will that area hold on the next test.” That mental shift alone improves decision-making significantly.
Trading against order flow is the most common silent mistake active participants make. Not because they are undisciplined, but because they are reading the wrong signals. Supply and demand zones align your entries with the direction of large capital, which is the only direction that sustains multi-point moves.
How to Identify Supply and Demand Zones?
There are three methods to identify these zones, each suited to slightly different chart conditions.
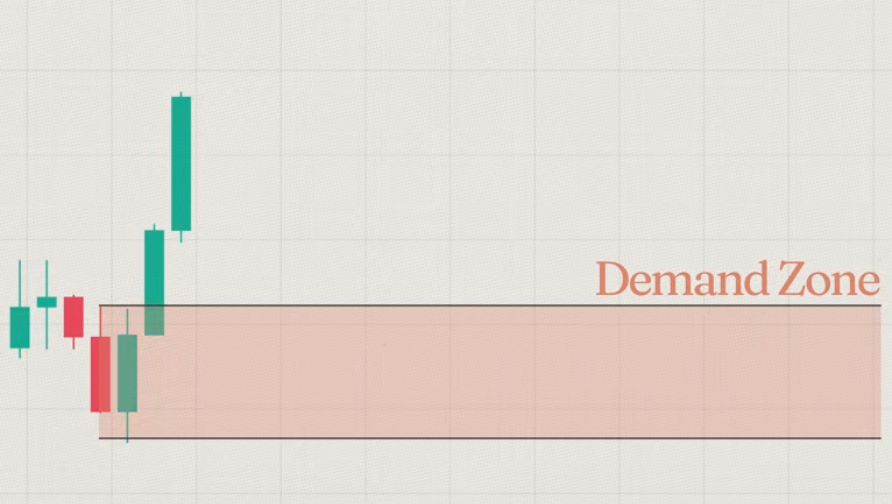
Method 1: Momentum Candles (Base Move Identification)
This is the primary and most reliable method.
Identify at least three consecutive momentum candles moving in the same direction. The candles should be large-bodied, not small, indecisive wicks. Four or five qualifying candles make the zone stronger, but three is the minimum threshold.
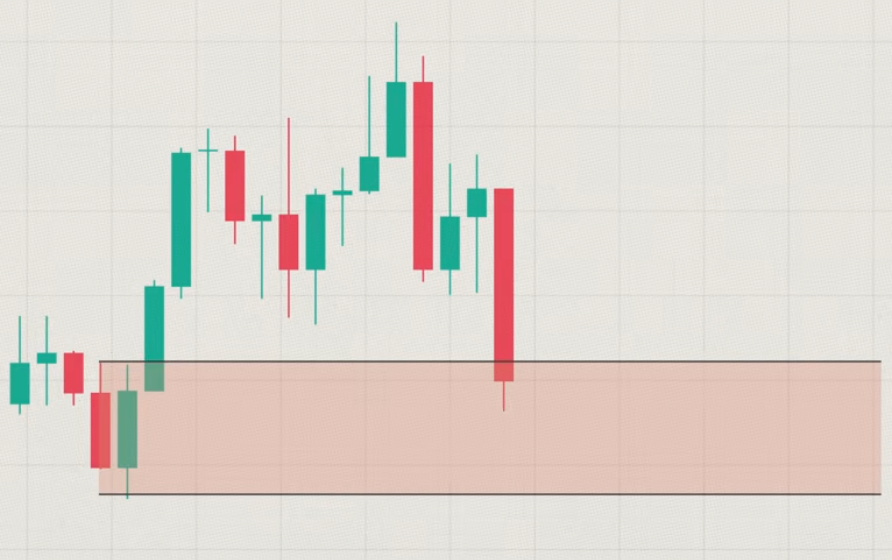
Once you identify the momentum sequence, locate the candle where the move originated. For a demand zone, trace back to the candle just before the rally began. Use a rectangle tool to mark from the low of that origin candle to the high of the candle preceding it. That box is your demand zone.
For a supply zone, reverse the logic. Mark from the high of the origin candle to the low of the candle before it. That box is your supply zone.
The zone represents the last known area of large-order absorption before displacement. Price returning to this area is price returning to unfinished business.
Quick practical note:
When first learning to draw these zones, it is common to mark them too wide. Precision matters. A zone that spans 30 points on a contract where you are risking 15 is structurally compromised from the outset.
Method 2: Consolidation Breakouts
Sometimes, large operators accumulate or distribute positions over a period of sideways price action before committing to a directional move.
When you see price consolidating in a tight horizontal range and then breaking out sharply with large candles, the consolidation area itself becomes the zone.
Mark the full consolidation range as the zone. When price returns to test that range, it is testing the area where the distribution or accumulation occurred. The same operators who built their position there will react to defend or extend it.
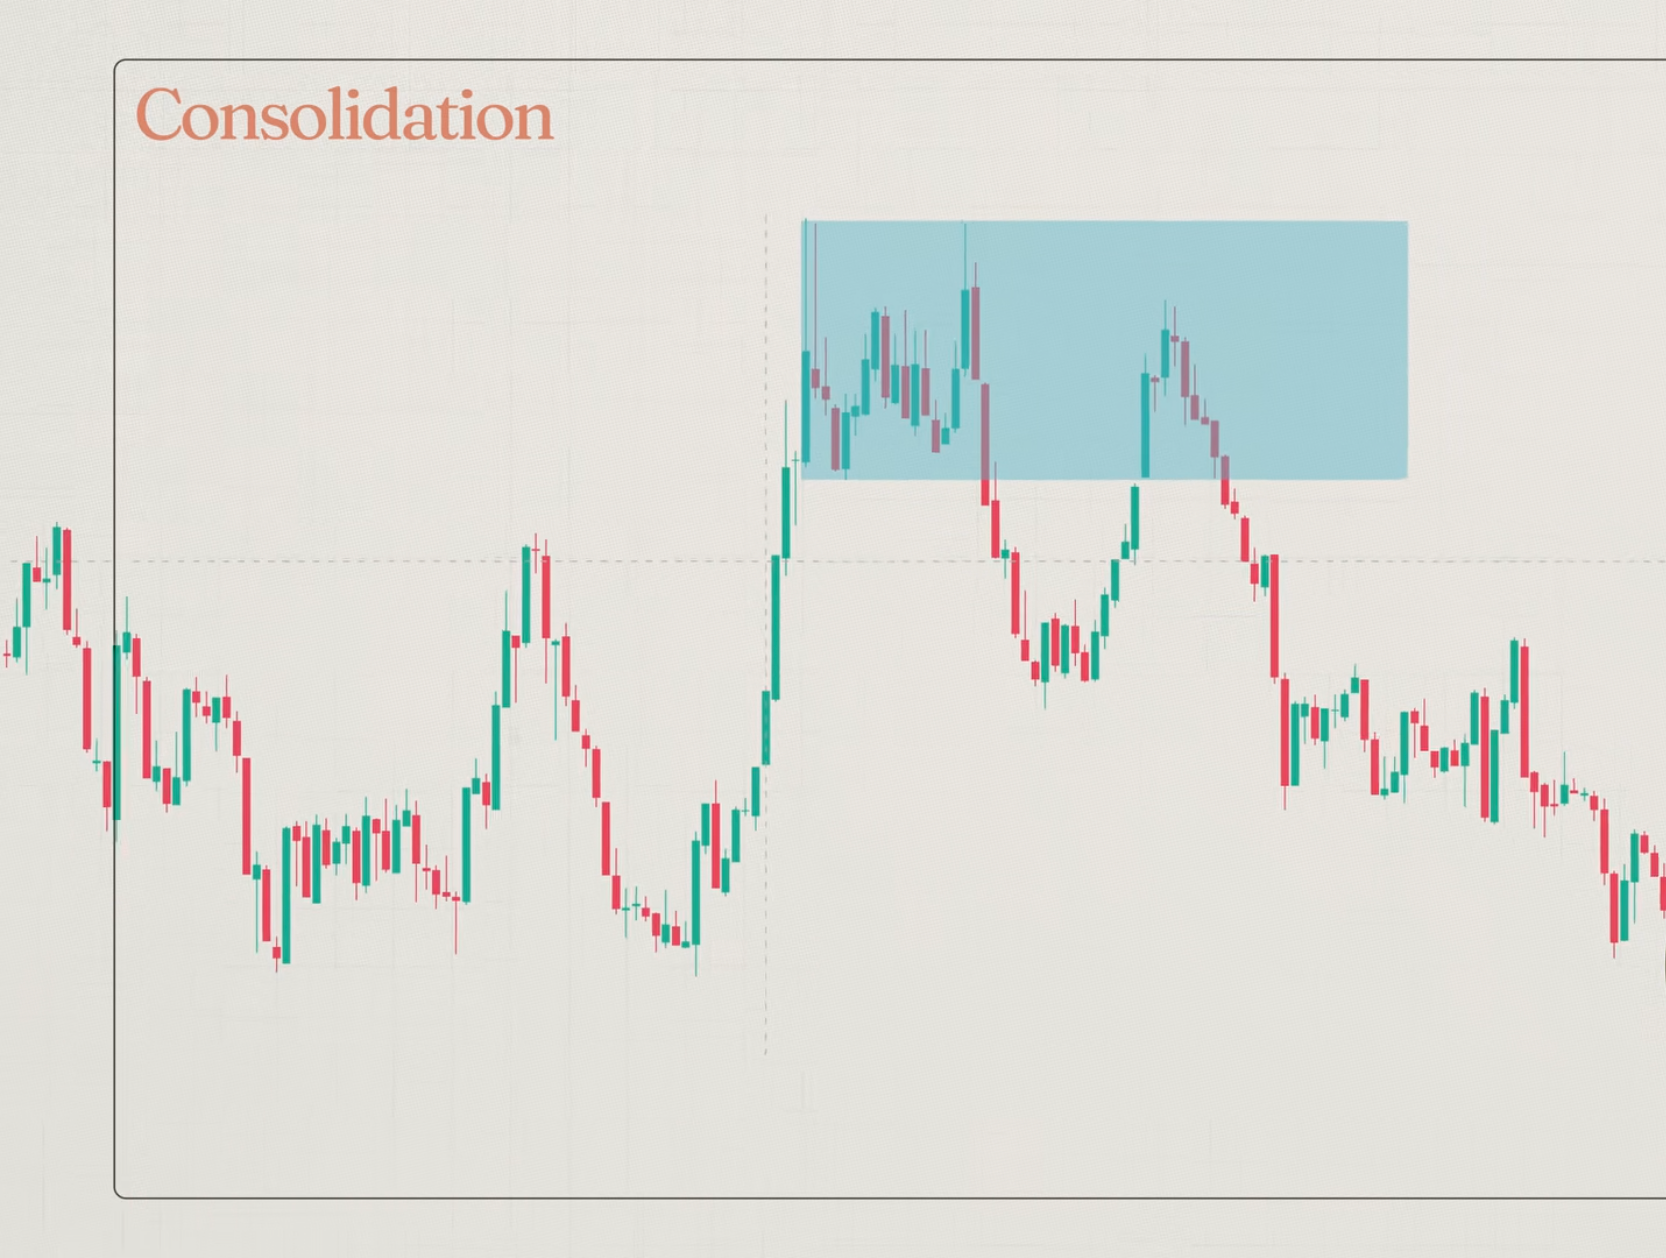
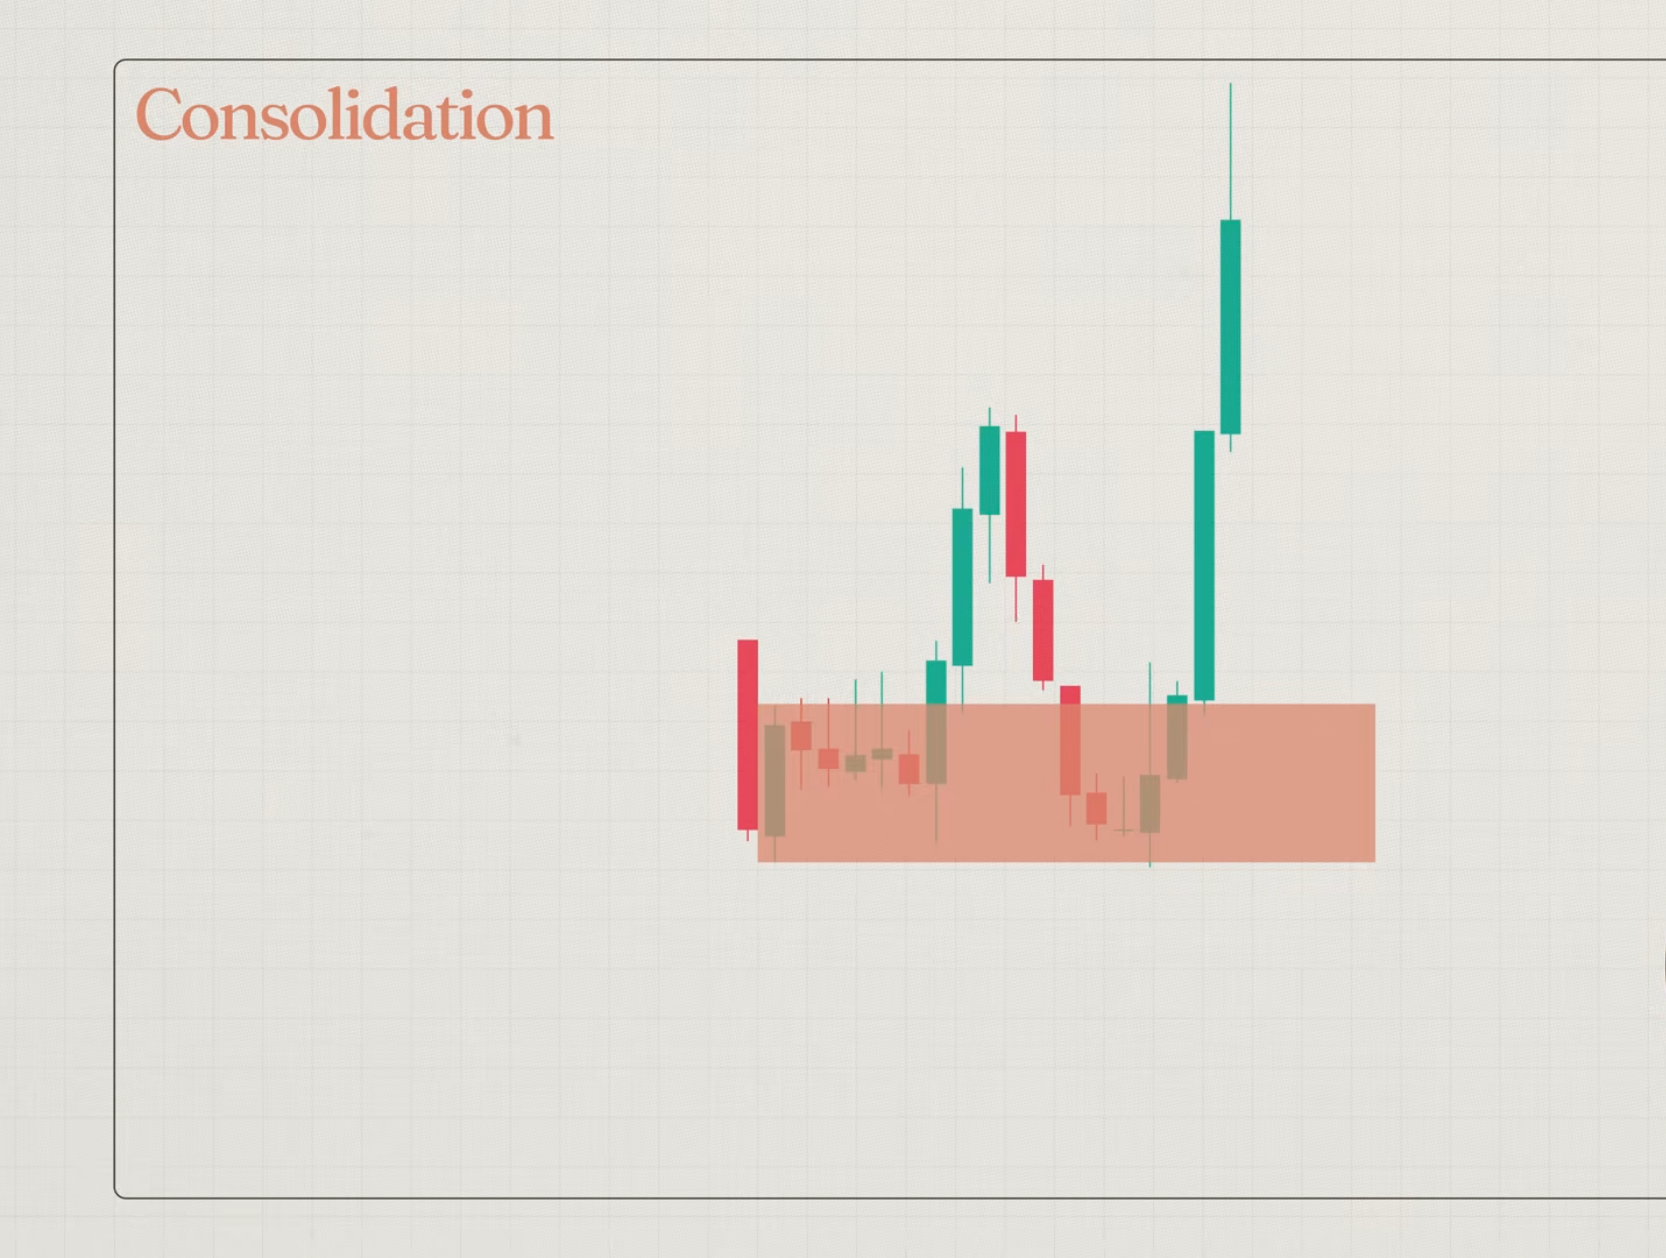
This method works particularly well on higher timeframes where institutional accumulation takes longer to complete. On the daily chart, we often see consolidation zones holding for three to six weeks before a meaningful breakout resolves the range.
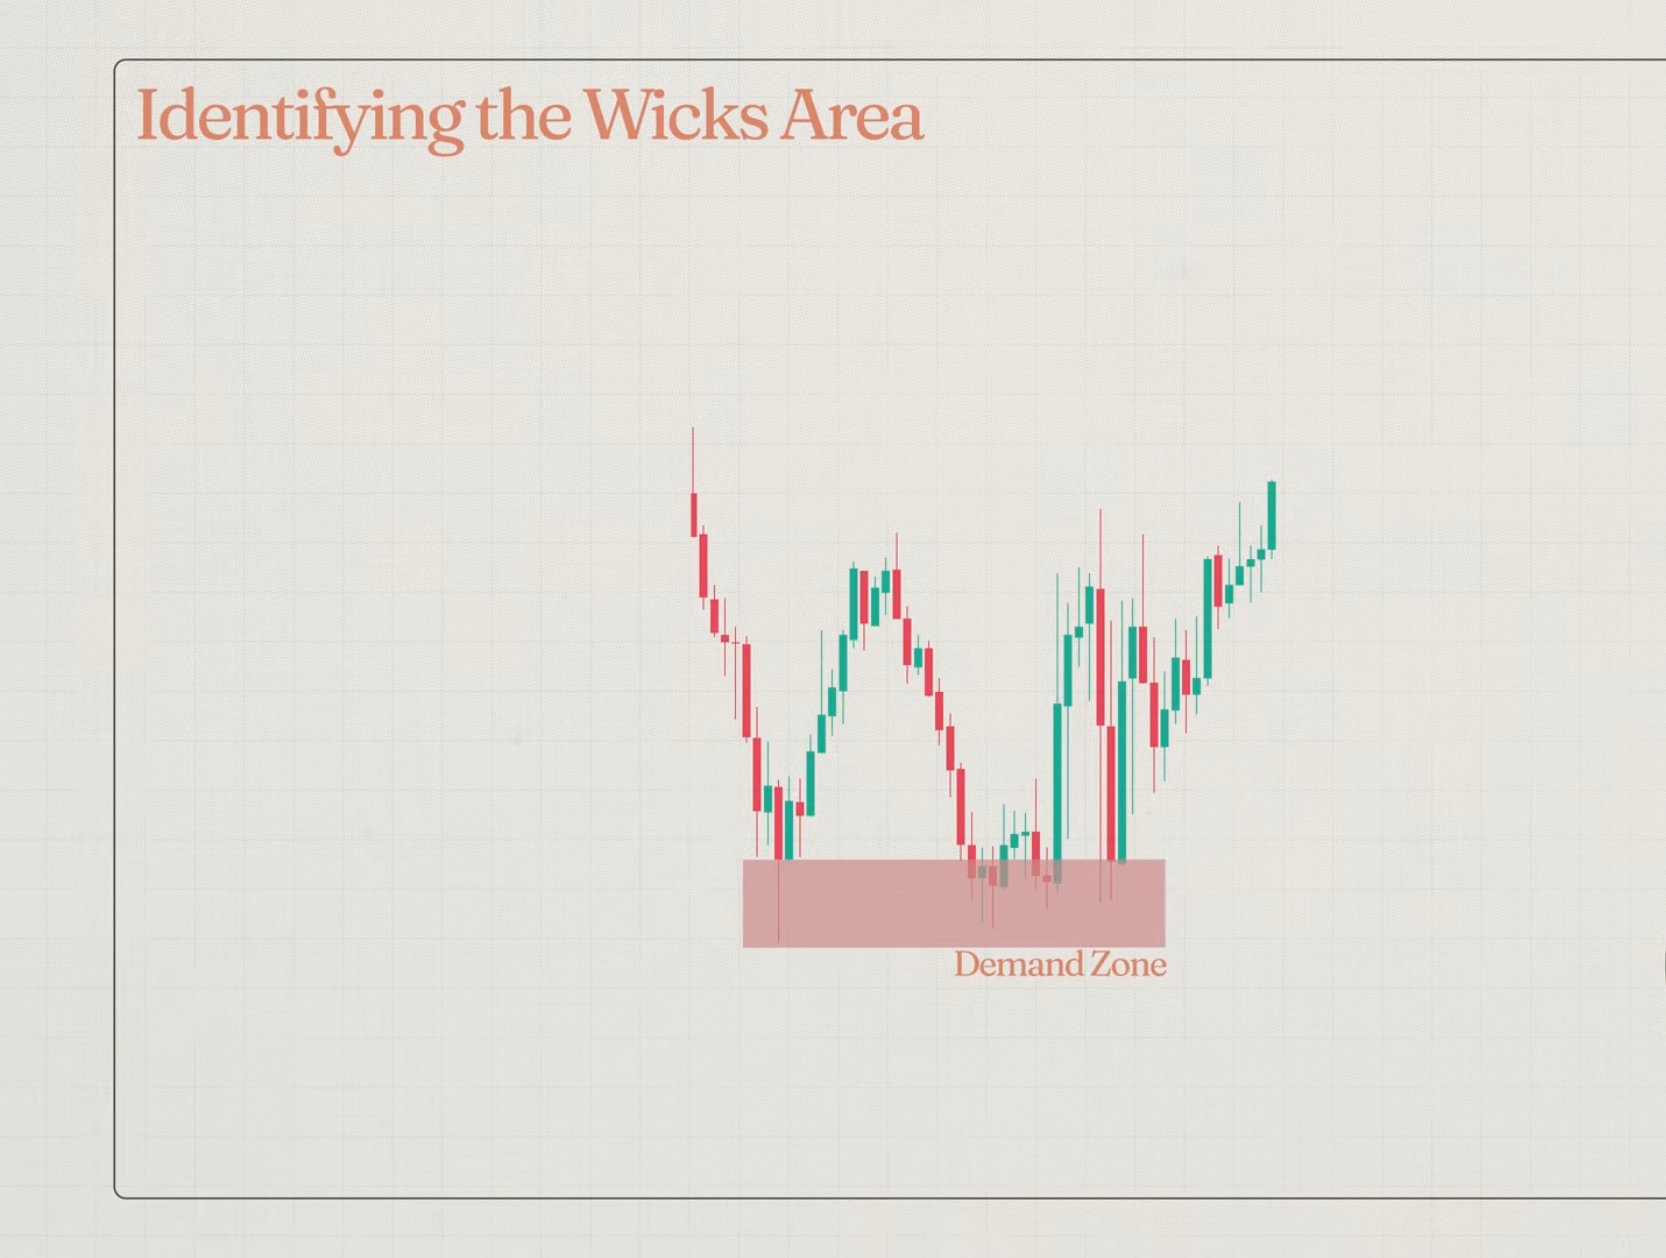
Method 3: Rejection Wicks
Multiple long wicks rejecting from the same price area signal that the price is being absorbed and pushed back repeatedly from a specific level.
Mark a box around the wick rejection area and extend it forward on the chart. The more consistent the rejection and the longer the wicks, the higher the probability that the zone holds on the next test.
Wick-based zones often overlap with the first two methods, which makes the overlap area a higher-conviction trade location.
How to Trade Supply and Demand Zones?
Identification is only half the work.
Execution discipline separates traders who find good zones from traders who make money from them.
Let’s take a structured approach.
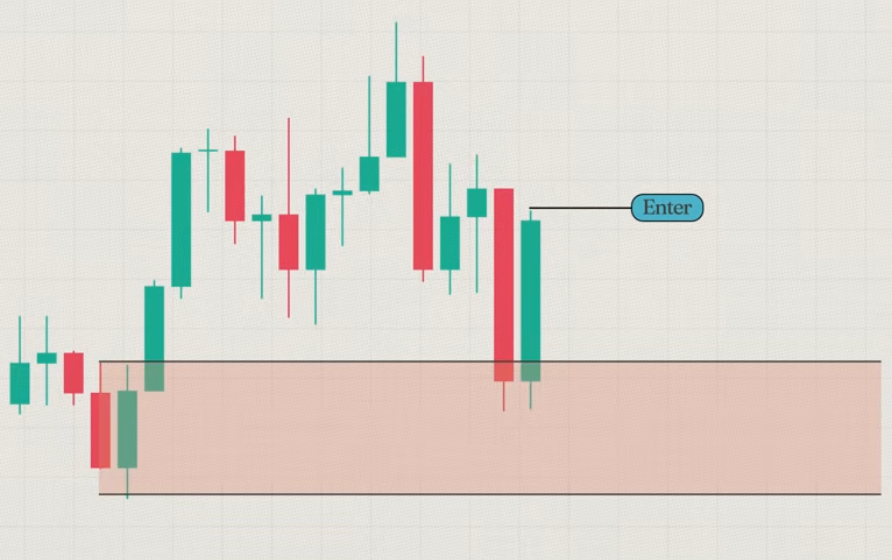
Step 1: Mark the zone.
Use one of the three methods explained above. The zone must be clean, derived from clear momentum or consolidation, not forced onto a chart because you want a trade.
Step 2: Wait for the price to return.
Do not chase price mid-move. The edge lives in the zone, not in momentum. Let the price come to your area.
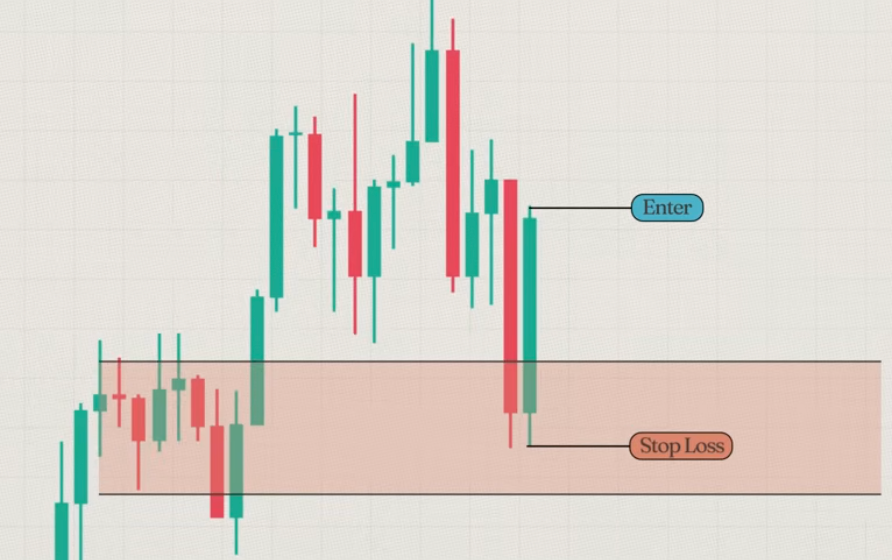
Step 3: Confirm reaction before entry.
When price enters the zone, do not assume it will hold. Watch how the price responds. A strong rejection candle, an engulfing pattern, or a clear reversal wick inside the zone is confirmation that the zone is active.
Entering this confirmation, rather than blindly at zone entry, reduces false entries significantly.
Step 4: Place your stop loss.
Two options exist. The conservative placement is just below the zone for a demand trade, or just above it for a supply trade. The tighter option is just below or above the confirmation candle’s extreme.
The tighter stop improves the reward ratio but requires more precise zone identification. Choose based on how clean and well-defined the zone is.
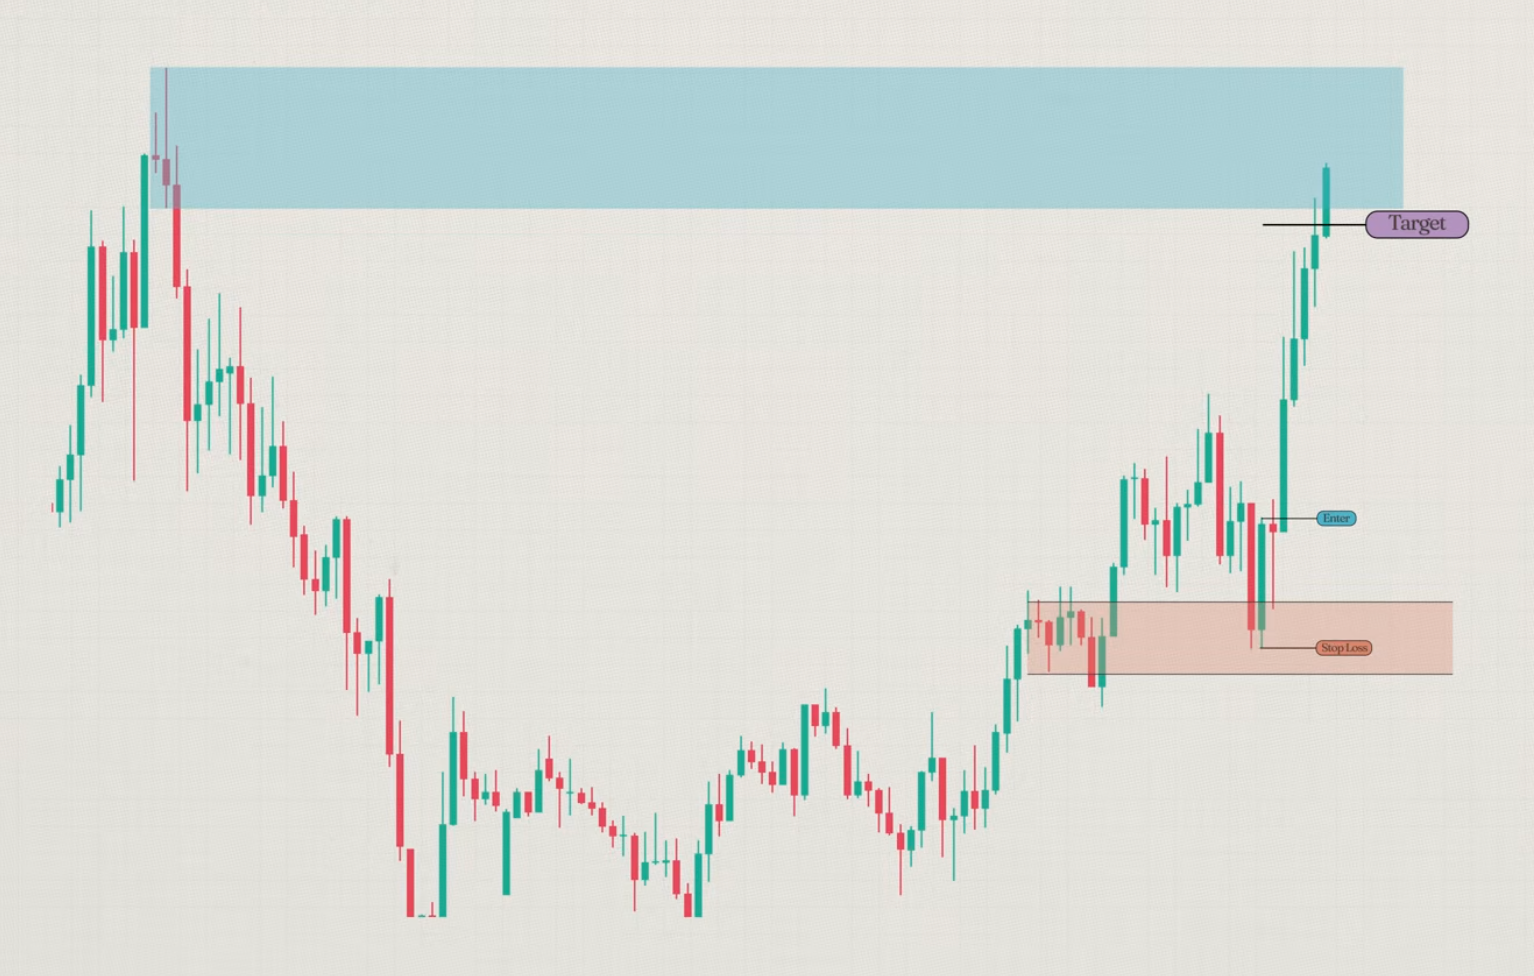
Step 5: Set your target.
Your target is the nearest opposing zone. If you are long from a demand zone, target the start of the next supply zone above, not the midpoint, not beyond it. Price may break through that supply zone, but exiting at its beginning locks in the high-probability portion of the move. You can always re-enter if the price continues.
One important execution note:
Some traders use limit orders placed inside the zone, triggering automatically when the price arrives. Others use market orders after watching the price react. Both are valid. The difference is that limit orders carry the risk of price blowing through the zone without a recovery.
Market orders after confirmation carry a slightly worse entry price but higher zone validity. In choppy or low-liquidity sessions, waiting for confirmation before using a market order is the more controlled approach. I have seen limit orders fill cleanly and then sit in drawdown for the remainder of a session because the confirmation step was skipped entirely.
How to Identify Strong Supply and Demand Zones (5 Criteria)?
Not all zones are equal. Plotting a rectangle on a chart and calling it a zone is not analysis. A zone is only as useful as the institutional participation that created it.
Here are the five criteria that indicate a zone has genuine strength behind it.
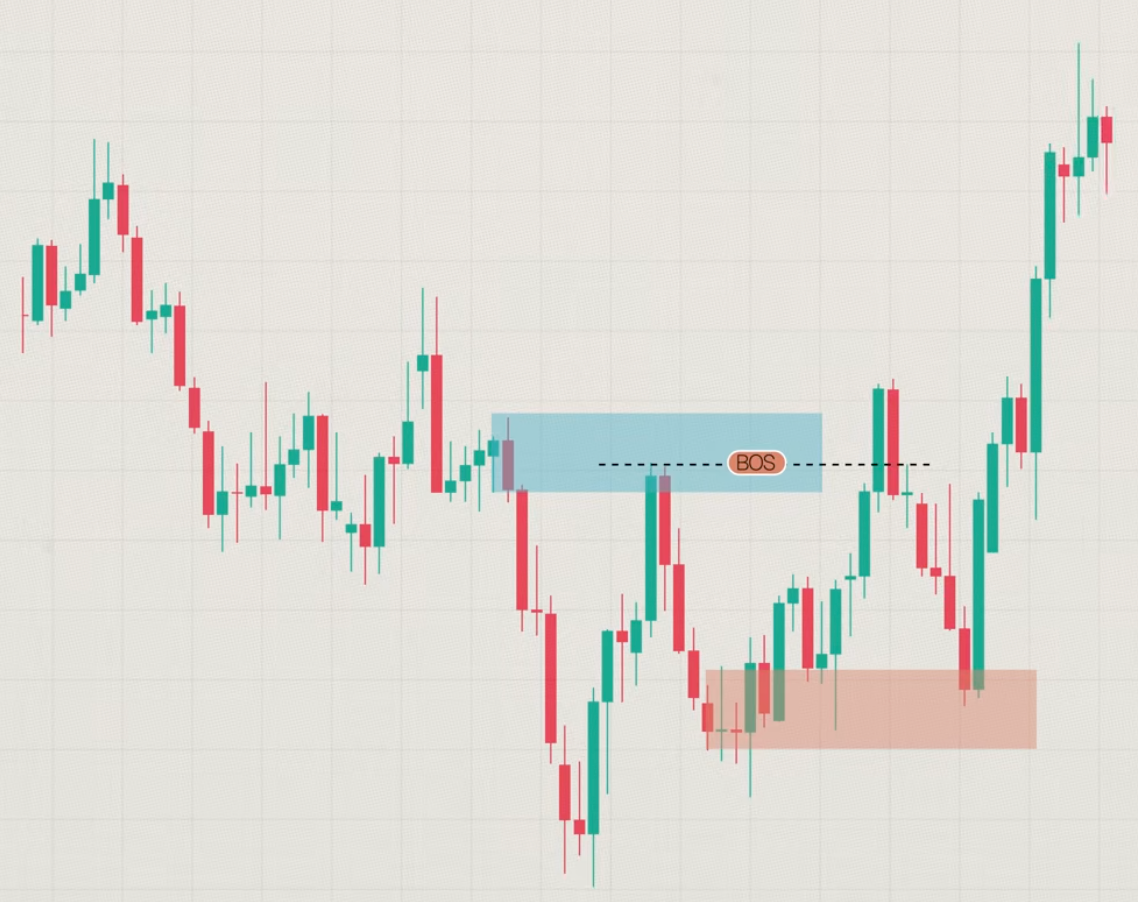
Criterion 1: The Zone Produced a Break of Structure
A zone that led to a break of structure (BOS) confirms that the buying or selling pressure at that origin was strong enough to shift market structure in its favour.
Breaking a previous swing high in a downtrend, or a previous swing low in an uptrend, requires concentrated effort. If a zone triggered that kind of structural shift, the order flow behind it was substantial.
When price returns to such a zone, the probability of another strong reaction is significantly higher than at a zone that only produced a minor move.
Always prioritise zones that caused structural breaks over zones that produced modest corrections.
Criterion 2: Flip Zones
A flip zone occurs when a level that previously acted as a supply zone is broken, converting into demand, or vice versa.
These zones carry extra weight because they mark a point where buyer-seller dynamics fundamentally shifted. The sellers who controlled that area were overwhelmed. When price returns, the same buyers who overcame that supply are likely to defend the converted demand zone aggressively.
Flip zones are among the highest-probability trade locations on any timeframe. When you see one aligned with the other four criteria, the setup quality improves significantly.
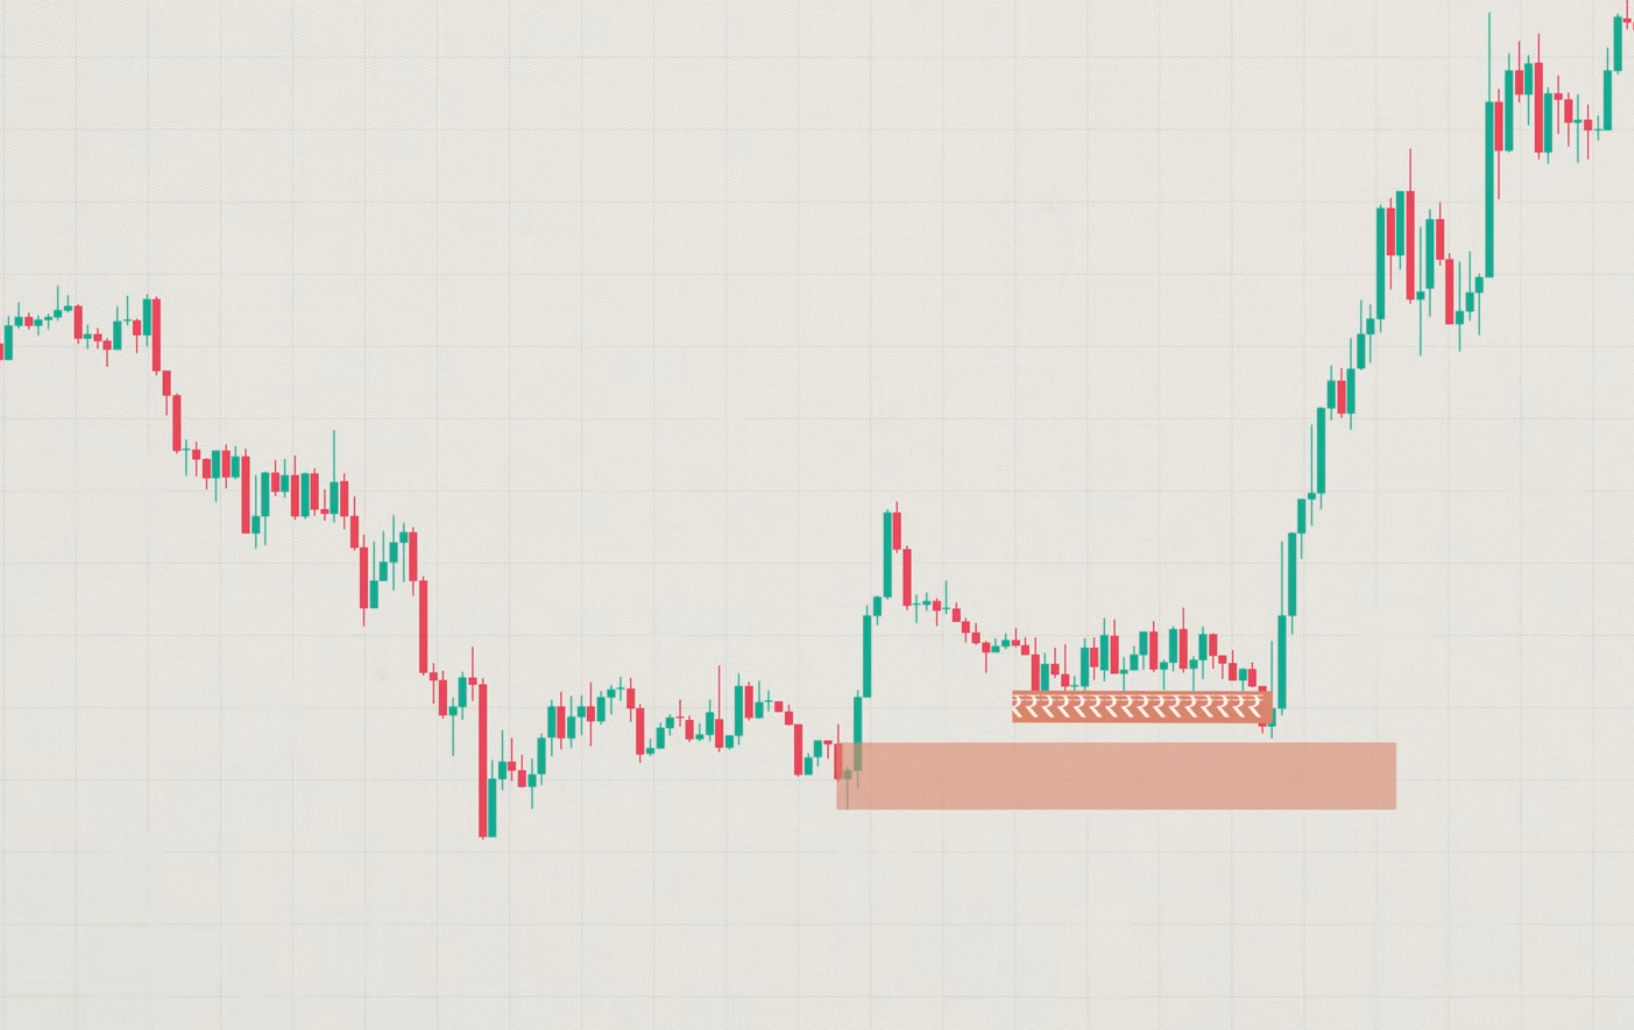
Criterion 3: Liquidity Sweep Before the Zone Forms
Large operators need liquidity to fill large orders.
When a sharp move occurs after price sweeps through a recent swing low or high, that sweep was the mechanism for absorbing the necessary opposing orders. The operators triggered stop losses or breakout entries sitting beyond those swing points to fill their own positions at scale.
A zone formed immediately after a liquidity sweep carries the confirmation that an informed participant was behind the move. That participant now has a vested interest in defending the zone where they completed their position.
If a zone did not sweep liquidity before forming, the order behind it may be smaller. That does not disqualify the zone, but liquidity sweeps at the zone origin strengthen the case considerably.
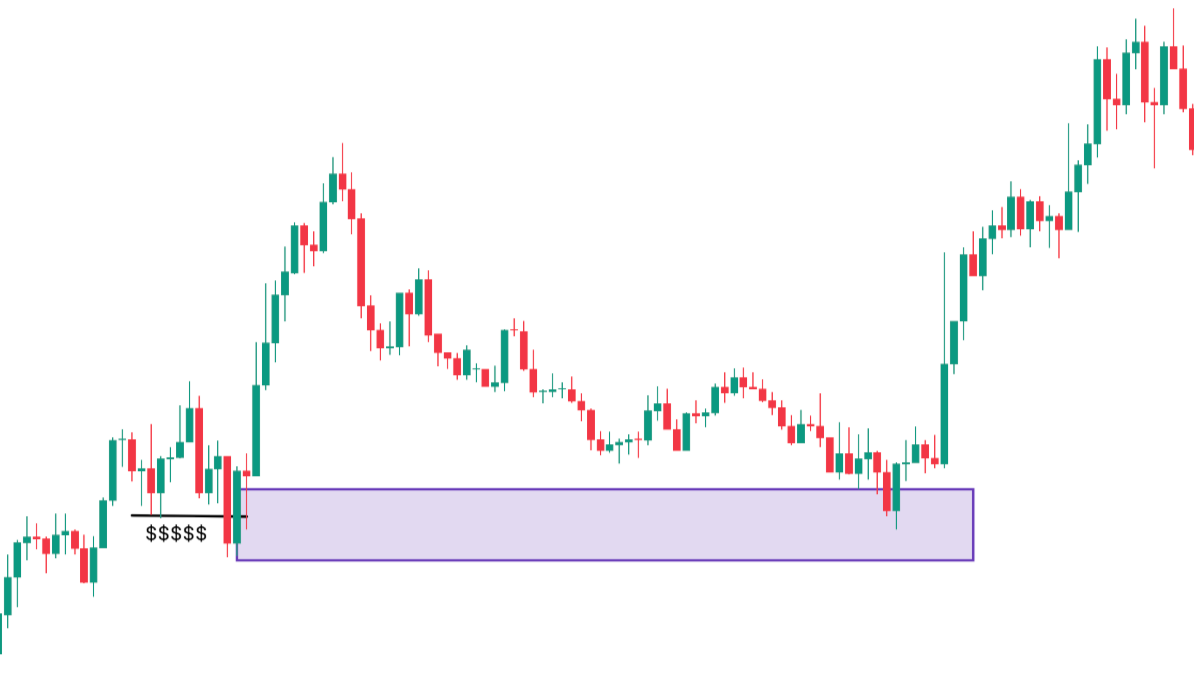
Criterion 4: Inducement Present Near the Zone
Inducement refers to a visible liquidity pool sitting just beyond the zone boundary, in the direction where retail traders would place stop losses.
This matters because large operators entering near a zone want the liquidity that retail traders leave just outside it. The presence of that liquidity near your zone suggests operators may push price into the zone specifically to collect it before reversing.
When a demand zone has a swing low with visible stop accumulation just below it, or a supply zone has a swing high with breakout entries clustered just above it, the zone becomes more attractive to institutional participation. That makes it more likely to produce a strong reaction.
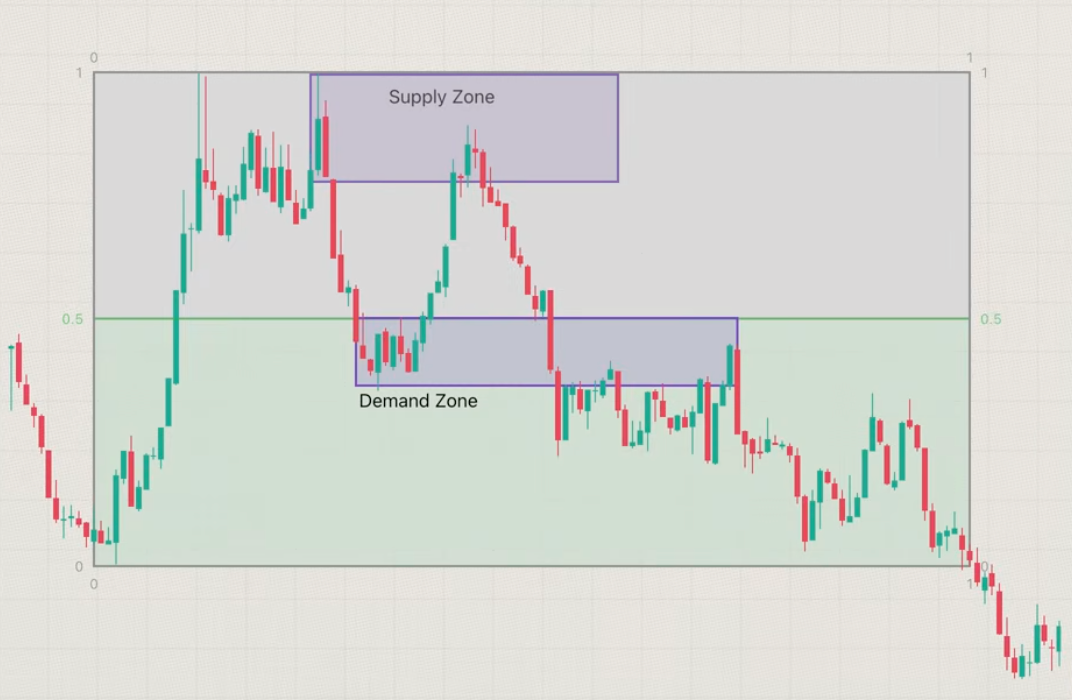
Criterion 5: Zone Location Within the Broader Price Range (Discount or Premium)
Demand zones in the lower half of a broader price range, the discount zone, carry a higher probability than demand zones forming near the middle or top of a range.
Supply zones in the upper half, the premium zone, carry a higher probability than supply zones forming near the range midpoint.
The logic is straightforward. Buyers want to buy at value, which is the lower portion of any measured range. Sellers want to sell at inflated levels, which is the upper portion. Zones that form outside of their natural price territory tend to be weaker and less defended.
When a zone sits in the appropriate pricing region relative to the broader structure, and all five criteria align, that is where the highest-quality setups live.
Common Mistakes Traders Make with Supply and Demand
Some of the most obvious mistakes that traders make while trading supply and demand zones are:
Trading every zone without criteria:
Zones appear frequently on any chart. Trading all of them guarantees mediocre results. The filter of these five criteria exists precisely to reduce the number of trades you take while improving the quality of each. Early on, most traders err toward overtrading zones, not undertrading them.
Entering before zone reaction confirmation:
The zone is a probability area, not a guarantee. Price can and does break through zones, especially those created in low-volume sessions or without strong structural backing. Waiting for the first sign of rejection before entering is the discipline that keeps you out of failed zone trades.
Ignoring the broader trend context:
A demand zone in a strong downtrend is fighting the dominant order flow. It may hold briefly and fail catastrophically. Always identify the higher-timeframe trend before treating a lower-timeframe zone as a strong reversal point.
Overlapping zones without prioritisation:
On active trading instruments, zones stack on top of each other. When two zones overlap, treat the combined area as the trade zone but apply the five criteria to determine which one is the dominant level. The zone with the most criteria satisfied is the one worth trading.
Neglecting execution costs:
In fast-moving instruments, the entry price relative to zone boundaries matters. Entering at the far edge of a zone or in the middle of a wide zone erodes the risk-to-reward before the trade even begins. Precision at entry protects the mathematical edge of the setup.
How Supply and Demand Apply Across Timeframes?
The framework works on every timeframe, but the implications differ.
On a 5-minute chart, zones form and resolve within the same session. The moves are smaller, the reactions faster, and the windows for entry are narrow. Scalping from intraday supply and demand zones requires clean charts, fast decision cycles, and a platform capable of precise order execution without lag. Platforms engineered for execution speed and order flow clarity, like CapMint, reduce the friction between zone identification and trade placement in these high-speed environments.
On a 15-minute to 1-hour chart, zones tend to represent the previous session’s significant activity. These are the zones most intraday traders work with, offering a balance between frequency and validity.
On a daily or weekly chart, zones can hold relevance for weeks or months. These are the zones that swing traders and position investors reference when determining where to accumulate or reduce exposure. A demand zone on the weekly chart that meets all five criteria is not a scalping setup. It is a potential multi-week-long opportunity.
Aligning your trade timeframe with the zone timeframe is what keeps your risk consistent with the move potential.
FAQs Related to Supply and Demand Zones in Trading
How many candles are needed to confirm a valid zone?
A minimum of three consecutive momentum candles establishes a qualifying move. Four or five add conviction. The size of the candles matters more than the count. Large-bodied candles with minimal wicks reflect a cleaner institutional intent than a series of small candles.
Can supply and demand zones be used alone without other indicators?
Yes. The framework is self-contained because it reads order flow directly from the price structure. Adding volume confirmation or a higher-timeframe structural analysis improves accuracy, but additional indicators are not required. The five criteria serve as the internal quality filter.
What happens when the price breaks through a zone?
A broken demand zone becomes a supply zone, and a broken supply zone becomes a demand zone. This is the flip zone concept. When price decisively closes beyond a zone with strong momentum, stop treating the broken zone as support or resistance in its original role. Reassess it as a potential flip zone for the next directional trade.
How tight should the stop loss be relative to the zone?
The stop should sit just beyond the zone boundary, not in the middle of it. If the zone is wide, a tighter stop below or above the rejection confirmation candle is preferred. The goal is to be wrong quickly and cheaply when the trade does not work, not to give the price so much room that the loss becomes disproportionate to the intended target.
Is supply and demand more suitable for intraday trading or swing trading?
Both. The underlying logic is identical regardless of the timeframe. What changes are the zone formation period, the holding duration, and the order execution speed required?
Intraday traders need tighter execution and faster reaction. Swing traders need patience to let the price travel back to the zone, sometimes over several sessions.
Closing Thoughts
Supply and demand analysis is not a system for predicting markets.
It is a framework for reading what already happened, understanding who caused it, and making a rational bet on whether those same participants will act again when the price returns to their territory.
The trader who benefits from this approach is the one who has stopped looking for certainty in price and started looking for evidence of intent.
You will not catch every move. You will miss zones. You will take trades that fail even when all five criteria are met, because markets are probabilistic, not deterministic.
What this framework builds, over time, is a consistent edge: better average entries, tighter stops, higher reward ratios, and a structural understanding of why price does what it does.
The work is repetitive. Study the zones that worked and the ones that failed. Understand which criteria were present and which were absent. That review process, done honestly and consistently, is what separates a trader who understands the concept from one who has internalised the skill.
Markets are not random. They are competitive.
The participants who act with the most capital, the most information, and the most planning leave traces.
Your job is to read those traces accurately and act accordingly.
Disclaimer: This content is for educational purposes only and does not constitute financial or investment advice. Investments in securities or other financial instruments are subject to market risk, including partial or total loss of capital. Past performance is not indicative of future results. Always consider your financial situation carefully and consult a licensed financial advisor before making investment or trading decisions.
Table of Content
- What are Supply and Demand Zones?
- Why Supply and Demand Trading Works?
- How to Identify Supply and Demand Zones?
- How to Trade Supply and Demand Zones?
- How to Identify Strong Supply and Demand Zones (5 Criteria)?
- Common Mistakes Traders Make with Supply and Demand
- How Supply and Demand Apply Across Timeframes?
- FAQs Related to Supply and Demand Zones in Trading
- Closing Thoughts
Engineered for the obsessed. Built for traders.

Purpose-built terminals.
Zero compromise.
Built for speed.
Plot No 1290, 2nd Floor, 17th Cross, 5th Main, Sector-7, HSR Layout, Bangalore 560102
Follow us on
Mintcap Brokers Private Limited
CIN – U66110KA2023PTC178706 | Registered Address: Plot No 1290, Second Floor, 17th Cross, 5th Main, Sector-7, HSR Layout, Bangalore 560102 | Tel: 080 – 49552310 | Email ID: compliance@capmint.com | SEBI registered Stock Broker: INZ000322732 | NSE Cash/F&O Member ID: 90430 | BSE Cash/F&O Member ID: 6903 | MCX Member ID: 57400 | NCDEX Member ID: 1312 | SEBI registered Depository Participant: IN-DP-806-2025 | CDSL DP ID: 12102300 | NSE Clearing Member code: M70108 | AMFI-Registered Mutual Fund Distributor: ARN-289109 (Valid upto 28-Feb-2027) | Category II Execution Only Platform : E6903
Details of Client Bank Account
Compliance Officer: Ms. Shridevi Vungarala | Email ID: compliance@capmint.com | Tel no. + 91 9035330126 | Grievance Redressal Officer (GRO) – Ms. Shikha Gupta | Email ID: Grievance@capmint.com | Tel no: 9035331595.
Procedure to file a complaint on SEBI SCORES: Register on SCORES portal. Mandatory details for filing complaints on SCORES: Name, PAN, Address, Mobile Number, E-mail ID. Benefits: Effective Communication, Speedy redressal of the grievances. You may refer the website https://scores.sebi.gov.in/ for more information. You may also download the SEBI Scores app to log a complaint Android: https://play.google.com > store > apps > sebiscores iOS: https://apps.apple.com > app > sebiscores
Disclaimer
Investment in the securities market are subject to market risks, read all the related documents carefully before investing. Brokerage will not exceed the SEBI prescribed limit.
Mutual fund investments are subject to market risks, read all scheme related documents carefully before investing. Mutual Funds are not exchange-traded products.
Attention Investor:
- Stock Brokers can accept securities as margin from clients only by way of pledge in the depository system w.e.f. September 1, 2020.
- Update your mobile number & email Id with your stock broker/depository participant and receive OTP directly from depository on your email id and/or mobile number to create pledge.
- Pay 20% as upfront margin of the transaction value to trade in cash market segment.
- Investors may please refer to the Exchange’s Frequently Asked Questions (FAQs) issued vide circular reference NSE/INSP/45191 dated July 31, 2020 and NSE/INSP/45534 dated August 31, 2020 and other guidelines issued from time to time in this regard.
- Check your Securities /MF/ Bonds in the consolidated account statement issued by NSDL/CDSL every month.