
Link copied!
Parabolic SAR
The Parabolic SAR is a technical indicator that helps identify potential reversals in market price direction.
Key Takeaways
- Parabolic SAR full form: Parabolic Stop and Reverse – It is a technical indicator used to identify potential reversal points in the price direction of an asset by placing dots above or below the
- Parabolic SAR helps spot trend reversals: It shows when the market might change direction by placing dots above or below the price. When dots are below, the trend is up. When dots are above, the trend is down.
- It gives easy buy and sell signals: A buy signal appears when the dots move below the price, and a sell signal appears when they move above the price. This helps traders make quick decisions.
- It can be used to trail stop-loss: Traders move their stop-loss along with the dots to protect profits as the price moves in their favour, without guessing the exact top or bottom.
- Works best with trends, not sideways markets: It’s accurate in trending conditions but may give false signals in flat markets. That’s why it’s better to use it with other indicators like ADX to confirm the strength of the trend.
What is Parabolic SAR?
The Parabolic SAR is a popular technical indicator used to spot potential turning points in the market. It helps traders identify when a trend might be ending, and a reversal could be starting. SAR stands for “Stop and Reverse,” which reflects its primary purpose: to signal when to exit a trade and possibly take the opposite position.
This indicator appears on a chart as a series of dots placed either above or below the price. When the dots are below the price, it indicates an uptrend. When they shift above the price, it signals a downtrend. Traders often use it alongside other indicators to confirm signals and avoid false entries.
Calculation Methodology for Parabolic SAR
The basic formula to calculate the next value of the Parabolic SAR is:
SAR(next) = SAR(current) + AF × (EP − SAR(current))
Where:
- SAR (current) is the current value of the Parabolic SAR
- AF is the Acceleration Factor
- EP is the Extreme Point (highest high or lowest low, depending on the trend)
Here is the breakdown of the components of SAR
- Acceleration Factor (AF): Starts at 0.02 and increases by 0.02 with each new EP, up to a maximum of 0.2.
- Extreme Point (EP): The highest high in an uptrend or the lowest low in a downtrend
Most trading platforms calculate the Parabolic SAR automatically, so manual computation is often unnecessary.
Here is how parabolic SAR looks on the chart
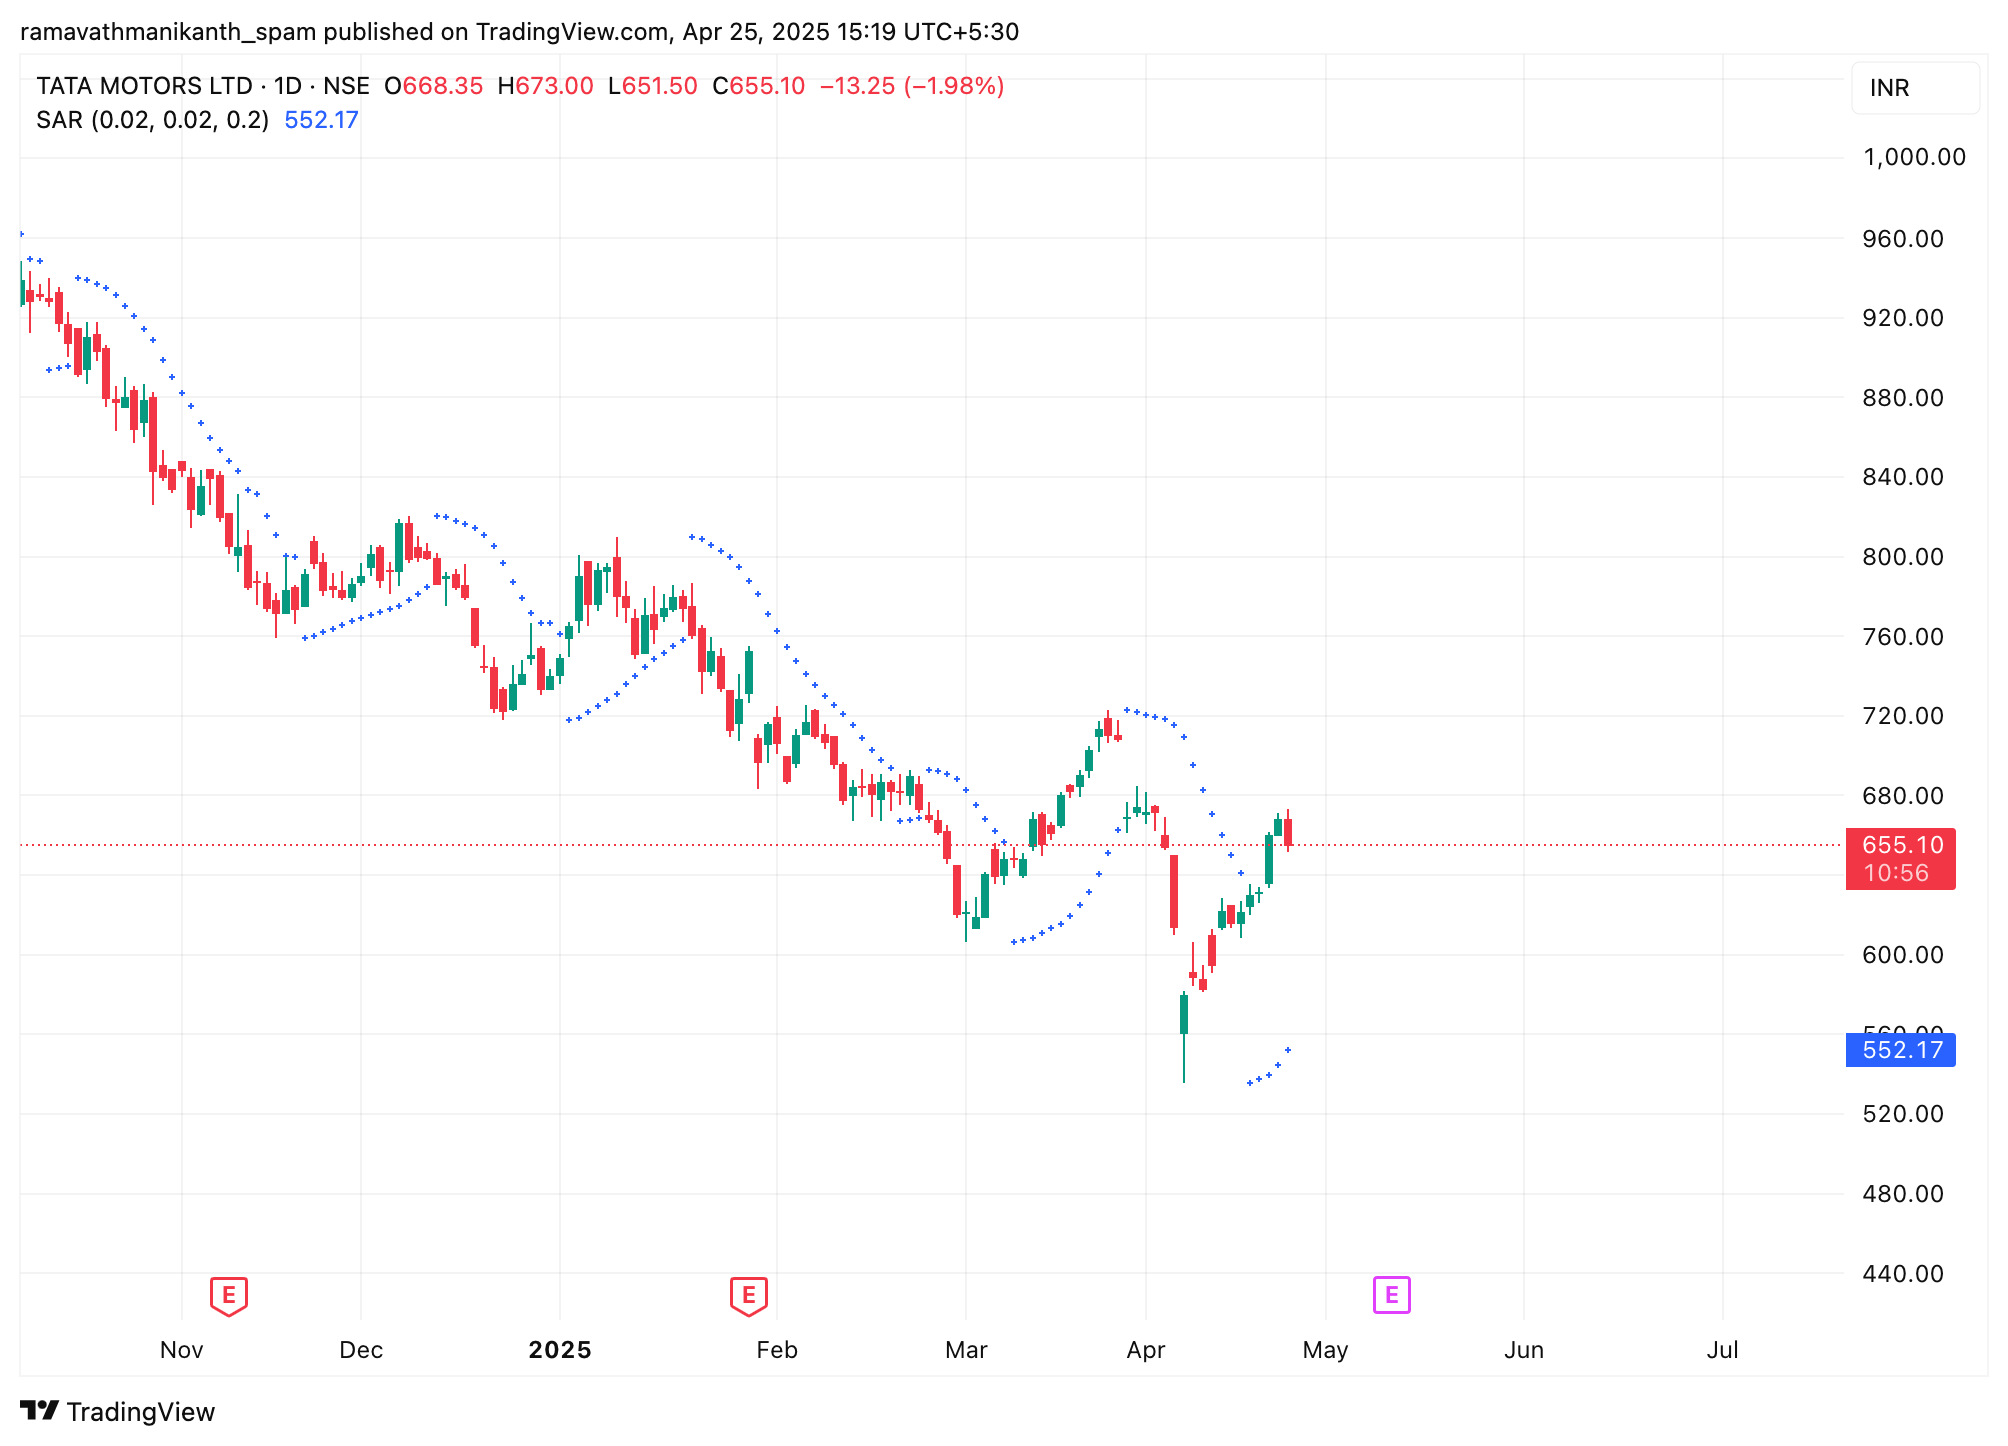
(Source: Tata Motors, Tradingview, 25th April 25)
Trading Signals and Strategies
Now that we understand how the Parabolic SAR strategy works, let’s see how it gives buy and sell signals and how traders actually use it in real strategies.
Signal Generation:
- Buy Signal: Occurs when the dots move from above to below the price, indicating a potential upward reversal.
- Sell Signal: Occurs when the dots move from below to above the price, indicating a potential downward reversal.
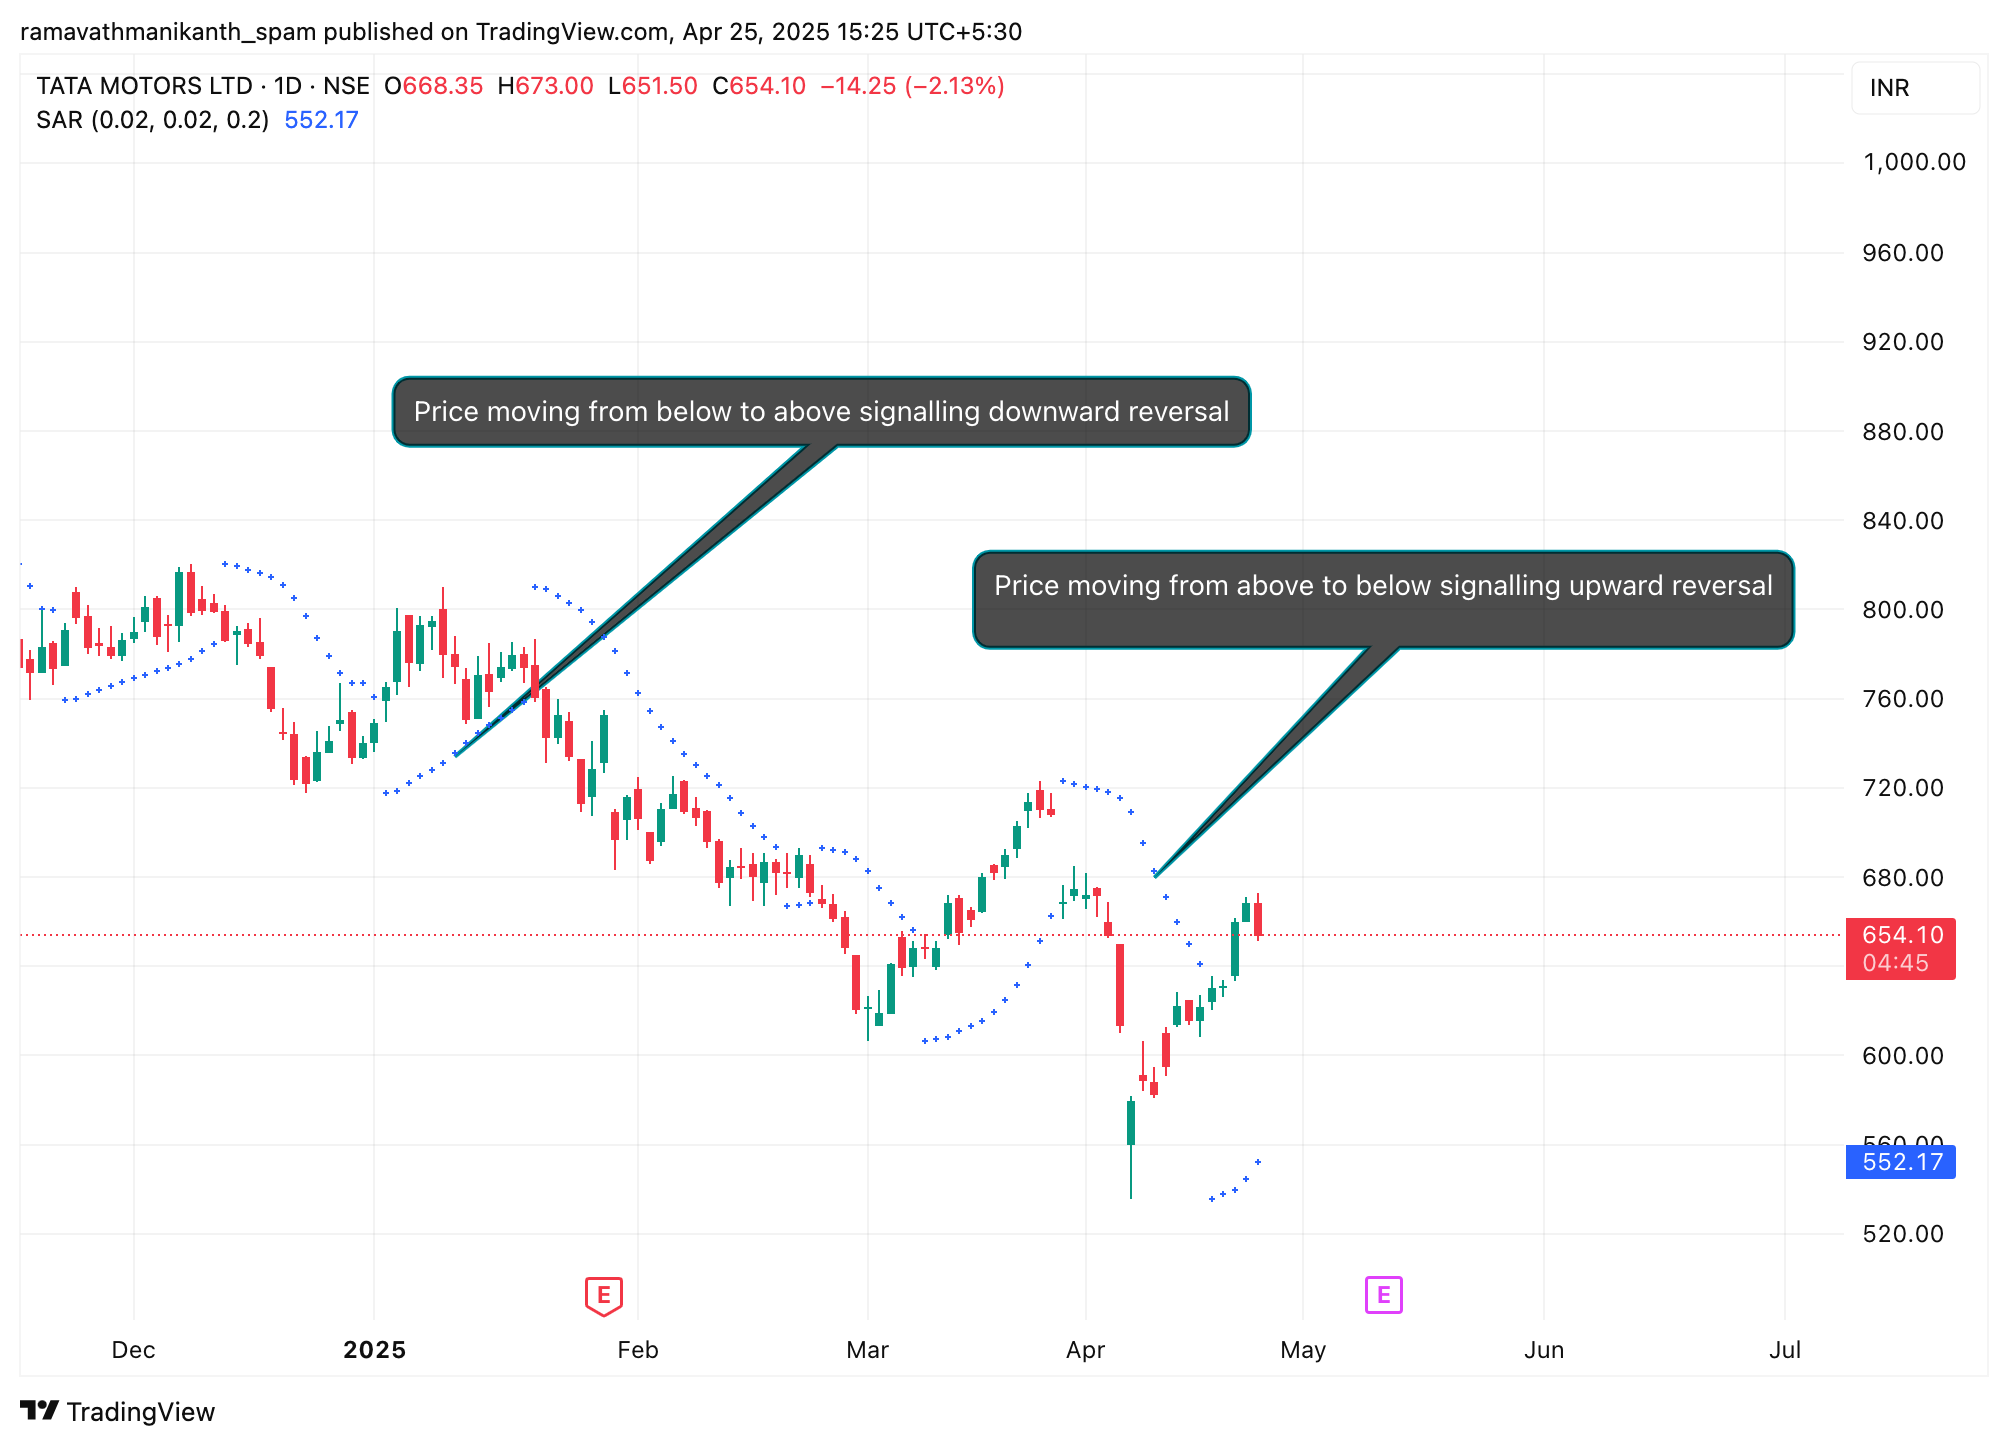
(Source: Tata Motors, Tradingview,25th April 25)
Trailing Stop-Loss with Parabolic SAR
Traders often use the Parabolic SAR to lock in profits by setting a trailing stop-loss. As the trend moves in their favour, they adjust their stop-loss level to follow the SAR dots.
For example, in an uptrend, as the price rises and the SAR dots climb higher, traders move their stop-loss just below the latest SAR value. This way, if the price suddenly drops and hits the SAR, they automatically exit the trade with the profits they’ve captured. It’s a simple way to stay in the trend while protecting gains without needing to guess the exact top or bottom.
Indicators that Complement Parabolic SAR
While the Parabolic SAR is great for spotting potential trend reversals, it can sometimes give false signals, especially in sideways or choppy markets. That’s why many traders combine it with other indicators to confirm the trend.
One popular combination is with the Average Directional Index (ADX), which measures trend strength. Here’s how it works:
- If Parabolic SAR gives a buy or sell signal, and
- ADX is above 25, which confirms a strong trend, making the SAR signal more reliable.
- If ADX is below 20–25, the trend is weak, and the SAR signal should be treated with caution.
By combining both, traders can filter out noise and make more confident decisions.
Advantages Of Parabolic SAR
Clear Signals in Trending Markets
Parabolic SAR works best when the market is strongly trending. It provides clear entry and exit points, making it easier for traders to follow the trend.
Useful for Setting Stop-Loss Levels
The indicator is often used as a trailing stop-loss tool, helping traders lock in profits as the trend continues by following the SAR dots.
Visual and straightforward
It’s easy to understand and apply. The dots on the chart visually show whether you should be in a buy or sell position, making it suitable even for beginners.
Limitations Of Parabolic SAR
Weak Performance in Sideways Markets
In flat or choppy markets, the indicator can give frequent false signals, since there’s no clear trend to follow.
Can Signal Too Early or Too Often
Because of how it’s calculated, the SAR might shift positions even if the price hasn’t truly reversed. This can lead to premature entries or exits.
Conclusion
The Parabolic SAR is a simple yet powerful tool for identifying trend direction and potential reversals in the market. It works best in trending conditions and is especially useful for setting dynamic stop-loss levels to protect profits. While it offers clear visual signals, traders should be cautious in sideways markets where it may produce false entries. To improve accuracy, it’s often paired with trend confirmation indicators like the ADX. With a solid understanding of how it works and when to use it, the Parabolic SAR can become a valuable part of any trader’s technical analysis toolkit.
Frequently Asked Questions (FAQs)
Is Parabolic SAR a good indicator?
Yes, but with a condition. Parabolic SAR works well in strong trending markets – it helps you ride the trend and know when to exit. But in sideways (range-bound) markets, it gives too many false signals. So, it’s best used along with other indicators like ADX or moving averages.
Which timeframe is best for Parabolic SAR?
It depends on your trading style. For intraday traders, shorter timeframes like 5-min or 15-min work well. For swing or positional traders, 1-hour, daily, or weekly timeframes give more reliable signals. Always test it on charts before using it in live trades.
Is Parabolic SAR leading or lagging?
It reacts to price changes after they happen. It doesn’t predict reversals ahead of time, but helps you spot when a trend is likely ending. It’s useful for confirming trend direction rather than predicting it.
What is the difference between Parabolic SAR and RSI?
Parabolic SAR helps you follow the trend and find exit points using dots on the price chart.
RSI shows momentum by identifying overbought or oversold levels using a line below the chart.
How to use Parabolic SAR effectively?
Use Parabolic SAR to follow trends. Enter trades when dots flip below (buy) or above (sell) the price. Always confirm with trend indicators like moving averages or ADX to avoid false signals in sideways markets.
What do Parabolic SAR dots indicate?
Parabolic SAR dots show trend direction and potential reversals. Dots below price indicate an uptrend, while dots above the price suggest a downtrend. A flip in dots signals a possible trend change.
How to make Parabolic SAR more sensitive?
Increase the acceleration factor (AF) to make Parabolic SAR more sensitive. This makes dots react faster to price changes, giving early signals but also increasing the chances of false signals.
Disclaimer: This content is for educational purposes only and does not constitute financial or investment advice. Investments in securities or other financial instruments are subject to market risk, including partial or total loss of capital. Past performance is not indicative of future results. Always consider your financial situation carefully and consult a licensed financial advisor before making investment or trading decisions.
Engineered for the obsessed. Built for traders.

Purpose-built terminals.
Zero compromise.
Built for speed.
Plot No 1290, 2nd Floor, 17th Cross, 5th Main, Sector-7, HSR Layout, Bangalore 560102
Follow us on
Mintcap Brokers Private Limited
CIN – U66110KA2023PTC178706 | Registered Address: Plot No 1290, Second Floor, 17th Cross, 5th Main, Sector-7, HSR Layout, Bangalore 560102 | Tel: 080 – 49552310 | Email ID: compliance@capmint.com | SEBI registered Stock Broker: INZ000322732 | NSE Cash/F&O Member ID: 90430 | BSE Cash/F&O Member ID: 6903 | MCX Member ID: 57400 | NCDEX Member ID: 1312 | SEBI registered Depository Participant: IN-DP-806-2025 | CDSL DP ID: 12102300 | NSE Clearing Member code: M70108 | AMFI-Registered Mutual Fund Distributor: ARN-289109 (Valid upto 28-Feb-2027) | Category II Execution Only Platform : E6903
Details of Client Bank Account
Compliance Officer: Ms. Shridevi Vungarala | Email ID: compliance@capmint.com | Tel no. + 91 9035330126 | Grievance Redressal Officer (GRO) – Ms. Shikha Gupta | Email ID: Grievance@capmint.com | Tel no: 9035331595.
Procedure to file a complaint on SEBI SCORES: Register on SCORES portal. Mandatory details for filing complaints on SCORES: Name, PAN, Address, Mobile Number, E-mail ID. Benefits: Effective Communication, Speedy redressal of the grievances. You may refer the website https://scores.sebi.gov.in/ for more information. You may also download the SEBI Scores app to log a complaint Android: https://play.google.com > store > apps > sebiscores iOS: https://apps.apple.com > app > sebiscores
Disclaimer
Investment in the securities market are subject to market risks, read all the related documents carefully before investing. Brokerage will not exceed the SEBI prescribed limit.
Mutual fund investments are subject to market risks, read all scheme related documents carefully before investing. Mutual Funds are not exchange-traded products.
Attention Investor:
- Stock Brokers can accept securities as margin from clients only by way of pledge in the depository system w.e.f. September 1, 2020.
- Update your mobile number & email Id with your stock broker/depository participant and receive OTP directly from depository on your email id and/or mobile number to create pledge.
- Pay 20% as upfront margin of the transaction value to trade in cash market segment.
- Investors may please refer to the Exchange’s Frequently Asked Questions (FAQs) issued vide circular reference NSE/INSP/45191 dated July 31, 2020 and NSE/INSP/45534 dated August 31, 2020 and other guidelines issued from time to time in this regard.
- Check your Securities /MF/ Bonds in the consolidated account statement issued by NSDL/CDSL every month.