

Link copied!
Commodity Channel Index (CCI)

The Commodity Channel Index (CCI) is one of the momentum indicators that compares the current price level to an average price level over a given period (commonly 14 or 20 days).CCI helps traders identify overbought and oversold signals.
Key Takeaways
- CCI is a momentum indicator that shows how far the current price is from its average. It helps traders spot when an asset might be overbought or oversold.
- When CCI goes above +100, it may mean prices have gone too high and could come down. When it falls below -100, prices may have dropped too much and could bounce back.
- Traders use CCI to find entry points, but get better results when they also look at support/resistance, trendlines, or confirmation candles.
- CCI is helpful but not perfect. It can give false signals in sideways markets, so it’s best to use it with other tools like volume or moving averages.
What is the CCI Indicator?
This momentum indicator was developed by Donald Lambert in 1980. Despite its name, the Commodity Channel Index is not limited to commodities; it can be used for all types of assets, including stocks, indices, and currencies.
At its core, CCI measures the gap between the current price and its average price over a specific period. The goal is to spot extreme price movements, which might mean the asset is either overbought or oversold and could soon reverse direction.
Like other momentum indicators, CCI helps traders identify these overbought and oversold conditions. It also helps spot possible trend reversals. On the other hand, when the market is trending strongly, CCI can confirm the strength of that trend instead of signalling a reversal.
How is CCI calculated?
To calculate CCI, these components are needed: the stock’s High Price, Low Price, and Closing Price for a period. Here is the formula for calculating CCI:
Formula: CCI = (Typical Price – SMA) / (0.015 × Mean Deviation)
Let’s break it down:
- Typical Price = (High + Low + Close) / 3
- SMA = Simple Moving Average of the Typical Price
- Mean Deviation = The average of how much each day’s typical price differs from the SMA. It tells us how far prices usually move away from the average.
- 0.015 is just a fixed number used to keep most CCI values within the range of +100 to -100.
In short, CCI checks how far the current price is from its average, compared to how much it normally moves. If the price is much higher or lower than usual, the CCI will reflect that.
Interpreting CCI Values
CCI values range from 0 to 100; values under and above certain levels categorise them under overbought and oversold zones. Here is the interpretation of the values:
CCI above 100:
When the CCI value is above 100, it means that a sharp rise often happens due to strong buying pressure, but such moves are usually not sustainable. So, the market may soon face a pullback or correction, as prices tend to return toward their average over time.
CCI below -100:
When the CCI value is below -100, it means the price has dropped sharply below its average. This usually happens due to strong selling pressure, but such steep declines are often temporary. Since prices don’t stay far from their average for too long, the market may soon bounce back or reverse upward.
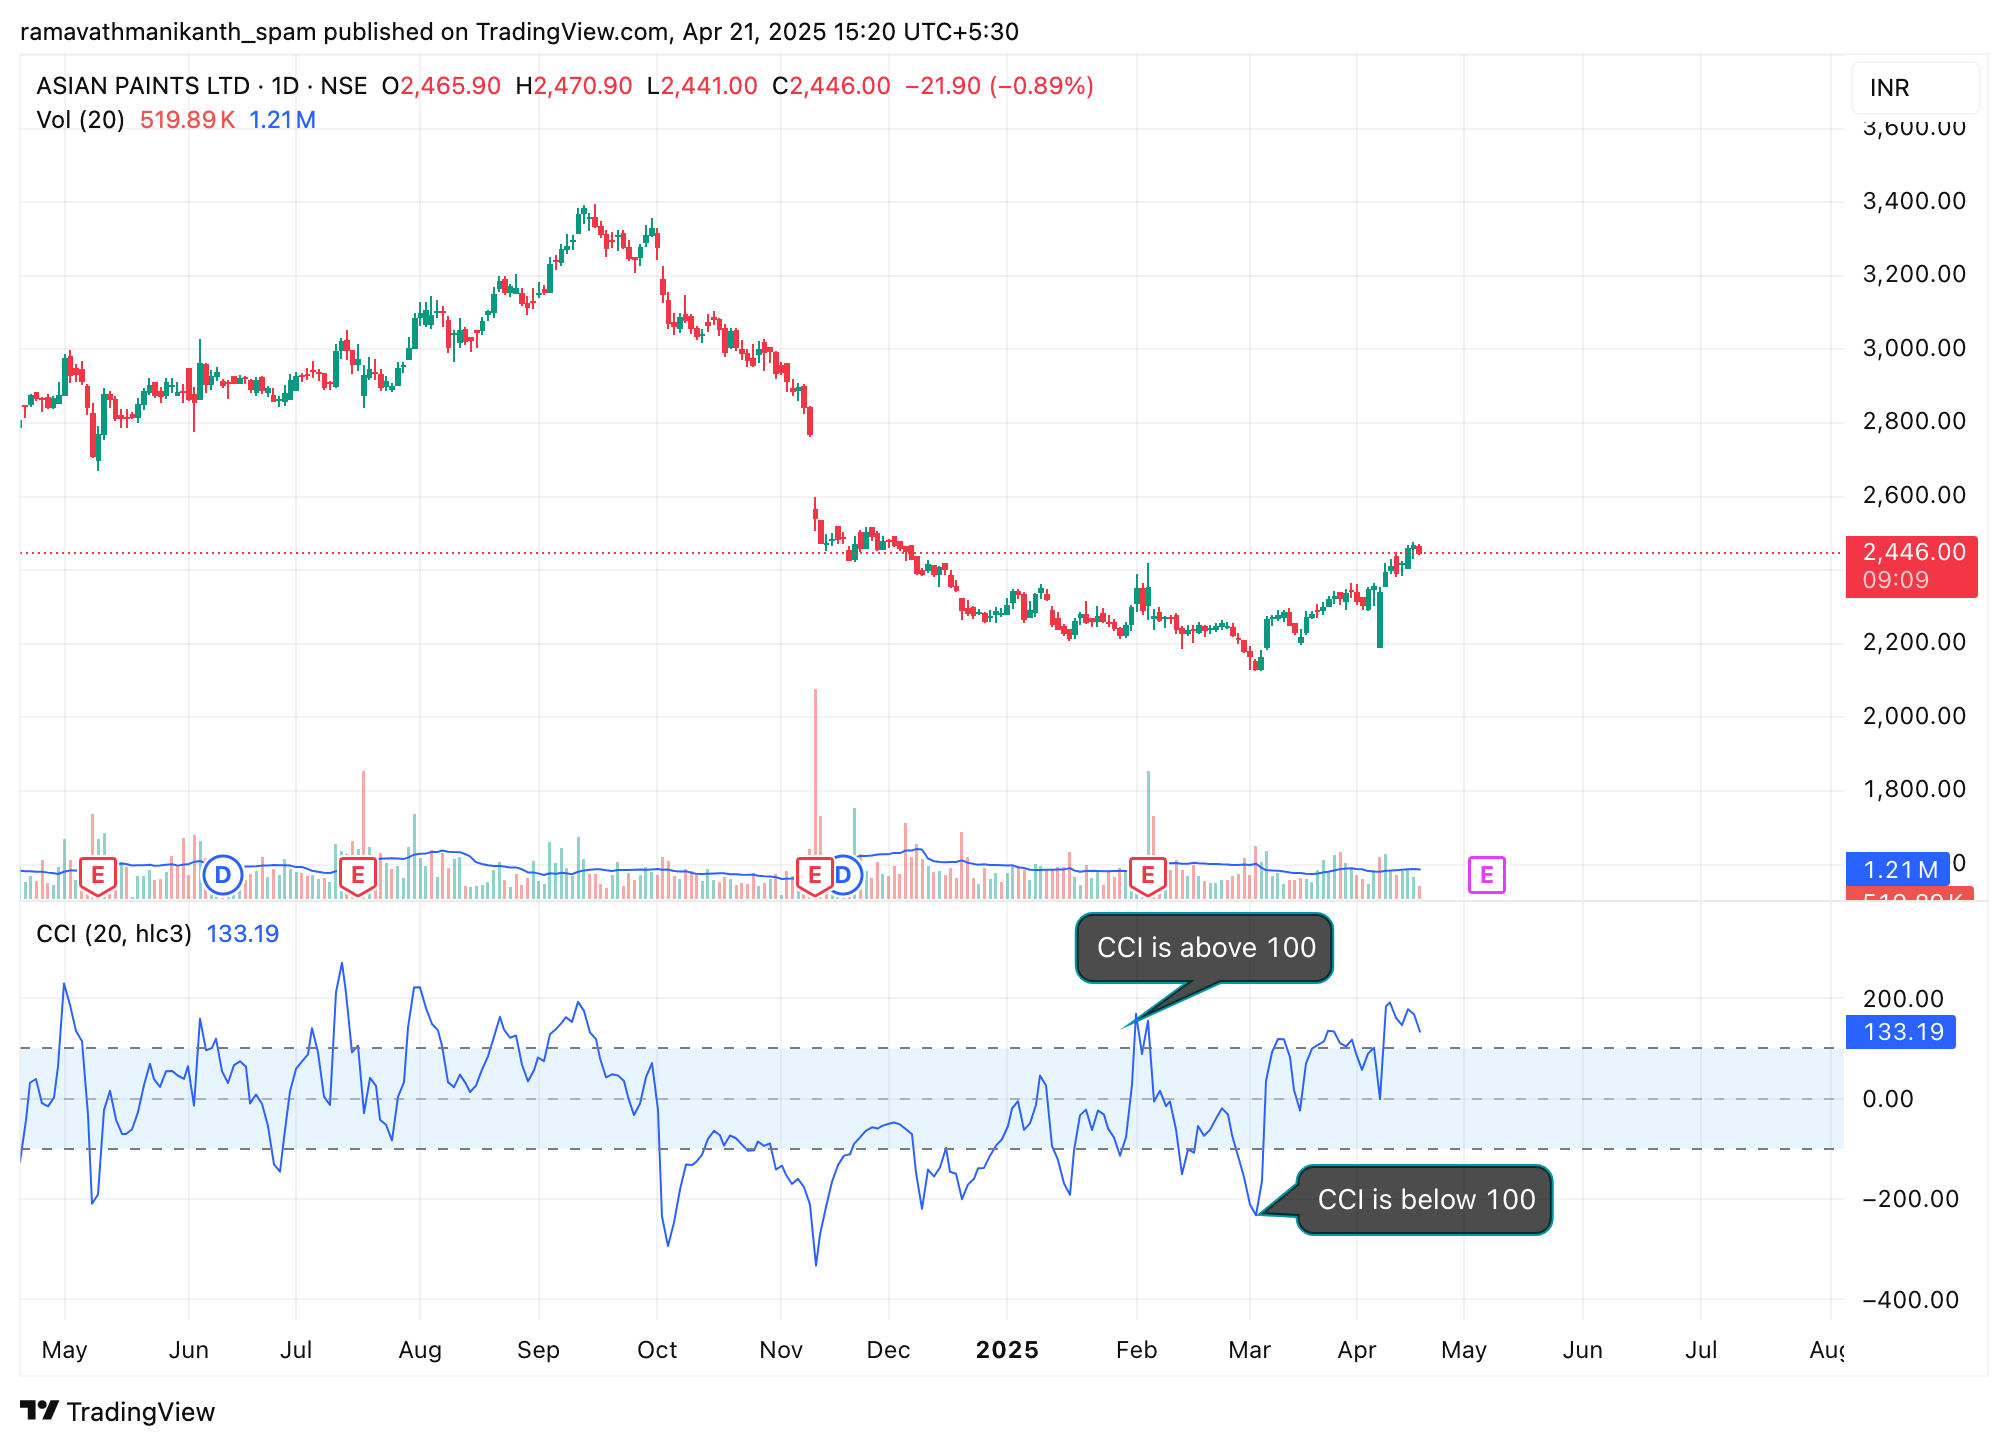
This chart of Asian Paints shows the CCI indicator turning above +100 in February, signalling strong buying momentum, and below -100 in March, indicating heavy selling pressure. These extreme CCI levels often suggest a possible price reversal or short-term correction.
How Traders Use CCI – Entry Signals
Traders closely watch the CCI technical indicator and find the entry points in the index and stock.
When to Buy
If the CCI is below -100 and starts climbing back above it, that’s a hint that the stock might be bouncing back. The selling seems to be done, and some fresh buying interest is kicking in. For traders, it’s like the first green light saying.
When to Sell
Now, if the CCI is above +100 but slips back under it, that’s a signal that the strong upward move might be running out of steam. It doesn’t always mean a crash, but traders see it as a warning sign.
How to use the CCI indicator?
These signals can be useful, but like any indicator, CCI isn’t perfect on its own. To get the most out of it, traders follow a few best practices. Here are some of them:
Use with support/resistance or trendlines:
CCI works even better when you combine it with support and resistance levels or trendlines. For example, if CCI gives a buy signal near a strong support zone, it adds more confidence to the trade. Similarly, if CCI shows a sell signal near a resistance or a downward trendline, it can help you spot a potential reversal early.
Wait For Confirmation Candles
Before acting on a CCI signal, it’s a good idea to wait for the price to confirm the move. For a buy signal, look for bullish candles like a bullish engulfing, hammer, or morning star near support. For a sell signal, look for bearish patterns like a bearish engulfing, shooting star, or evening star near resistance. These candles help confirm that momentum is actually shifting in the direction CCI is pointing.
Downsides Of CCI
Here are some limitations of CCI
Can give false signals in choppy or sideways markets:
CCI is a momentum indicator, which means it works best when there’s a clear trend—either up or down. But in sideways or highly volatile markets, prices swing back and forth without real direction. In such cases, CCI can move above +100 or below -100 often, but these signals don’t always lead to actual trend changes. This can result in fake breakouts, frequent stop-loss hits, and overall frustration.
Not ideal in isolation; works better with confirmation tools:
CCI doesn’t consider volume or long-term trends, so using it without any backup can be risky. For example, a CCI buy signal might appear during a long-term downtrend, which could be a trap. To avoid this, traders often combine CCI with trend-following indicators like moving averages or look at volume spikes to confirm strength behind the move. The goal is to avoid acting on signals that lack momentum or go against the bigger trend.
Conclusion
The Commodity Channel Index (CCI) is a helpful tool for spotting momentum shifts in the market. It shows when prices may be too high or too low compared to their usual range, giving early signs of possible reversals. But like any indicator, it’s not always right. CCI works best when used with other tools like trendlines, volume, or support/resistance levels. By waiting for confirmation from the price itself, traders can reduce false signals and make more confident decisions. With the right approach, CCI can be a valuable part of any trader’s technical analysis toolkit.
Frequently Asked Questions (FAQs)
Which is better, RSI or CCI?
Both RSI and CCI are momentum indicators, but they serve slightly different purposes. RSI is better for identifying clear overbought and oversold levels and is easier to use for beginners. CCI is more sensitive and helps spot early trend reversals, but can give more false signals in sideways markets. So, it depends on your trading style if you want smoother signals, go with RSI; if you want early entries, CCI might suit you better.
What is the CCI index?
The CCI (Commodity Channel Index) is a technical indicator that compares the current price of a stock to its average price over a set period. It helps traders find out if an asset is overbought or oversold and spot possible trend changes. Despite the name, it can be used for all types of assets, not just commodities.
Is CCI a good indicator?
Yes, the Commodity Channel Index (CCI) is considered a useful momentum indicator for identifying overbought and oversold conditions, spotting potential trend reversals, and confirming trend strength. However, it works best when combined with other technical analysis tools such as moving averages, support and resistance, volume, or candlestick patterns rather than being used on its own.
What is the best setting for the CCI indicator?
The most commonly used CCI setting is 20 periods, as originally recommended by Donald Lambert. Some short-term traders prefer a 14-period CCI to generate faster signals, while swing traders may use 30 or 50 periods to reduce market noise. The ideal setting ultimately depends on the trading style, market conditions, and timeframe being analysed.
Disclaimer: This content is for educational purposes only and does not constitute financial or investment advice. Investments in securities or other financial instruments are subject to market risk, including partial or total loss of capital. Past performance is not indicative of future results. Always consider your financial situation carefully and consult a licensed financial advisor before making investment or trading decisions.
Engineered for the obsessed. Built for traders.

Purpose-built terminals.
Zero compromise.
Built for speed.

Plot No 1290, 2nd Floor, 17th Cross, 5th Main, Sector-7, HSR Layout, Bangalore 560102
Follow us on


Mintcap Brokers Private Limited
CIN – U66110KA2023PTC178706 | Registered Address: Plot No 1290, Second Floor, 17th Cross, 5th Main, Sector-7, HSR Layout, Bangalore 560102 | Tel: 080 – 49552310 | Email ID: compliance@capmint.com | SEBI registered Stock Broker: INZ000322732 | NSE Cash/F&O Member ID: 90430 | BSE Cash/F&O Member ID: 6903 | MCX Member ID: 57400 | NCDEX Member ID: 1312 | SEBI registered Depository Participant: IN-DP-806-2025 | CDSL DP ID: 12102300 | NSE Clearing Member code: M70108 | AMFI-Registered Mutual Fund Distributor: ARN-289109 (Valid upto 28-Feb-2027) | Category II Execution Only Platform : E6903
Details of Client Bank Account
Compliance Officer: Ms. Shridevi Vungarala | Email ID: compliance@capmint.com | Tel no. + 91 9035330126 | Grievance Redressal Officer (GRO) – Ms. Shikha Gupta | Email ID: Grievance@capmint.com | Tel no: 9035331595.
Procedure to file a complaint on SEBI SCORES: Register on SCORES portal. Mandatory details for filing complaints on SCORES: Name, PAN, Address, Mobile Number, E-mail ID. Benefits: Effective Communication, Speedy redressal of the grievances. You may refer the website https://scores.sebi.gov.in/ for more information. You may also download the SEBI Scores app to log a complaint Android: https://play.google.com > store > apps > sebiscores iOS: https://apps.apple.com > app > sebiscores
Disclaimer
Investment in the securities market are subject to market risks, read all the related documents carefully before investing. Brokerage will not exceed the SEBI prescribed limit.
Mutual fund investments are subject to market risks, read all scheme related documents carefully before investing. Mutual Funds are not exchange-traded products.
Attention Investor:
- Stock Brokers can accept securities as margin from clients only by way of pledge in the depository system w.e.f. September 1, 2020.
- Update your mobile number & email Id with your stock broker/depository participant and receive OTP directly from depository on your email id and/or mobile number to create pledge.
- Pay 20% as upfront margin of the transaction value to trade in cash market segment.
- Investors may please refer to the Exchange’s Frequently Asked Questions (FAQs) issued vide circular reference NSE/INSP/45191 dated July 31, 2020 and NSE/INSP/45534 dated August 31, 2020 and other guidelines issued from time to time in this regard.
- Check your Securities /MF/ Bonds in the consolidated account statement issued by NSDL/CDSL every month.