
Table of Content
- Key Takeaways
- What is a Downward Sloping Trendline?
- How to Draw a Downward Sloping Trendline?
- Importance of Downward Sloping Trendlines
- Features of a Downward Sloping Trendline
- How to Use a Downward Sloping Trendline for Trading?
- Common Mistakes to Avoid
- Downward Sloping Trendline vs. Upward Sloping Trendline
- Conclusion
- Frequently Asked Questions (FAQs)
- Articles to Read Further
Link copied!
Downward Sloping Trendline
A downward sloping trendline is a straight line drawn on a price chart that connects two or more lower highs. It visually represents a downtrend, indicating that the asset’s price is generally moving lower over time.
Key Takeaways
- Visual Guide to Bearish Trend: A downward sloping trendline connects lower highs, signalling sustained selling and weakening bullish momentum.
- Dynamic Resistance Tool: In a downtrend, the trendline acts as resistance, helping traders spot short entries and assess trend strength.
- High-Probability Trade Setups: Traders short near the trendline, place stop-losses above it, and confirm with RSI, MACD, or volume signals.
- Mistakes and Reversal Signals: Avoid random highs and watch for breakouts. Strong moves above the trendline may signal a bullish reversal.
What is a Downward Sloping Trendline?
A downward sloping trendline is a concept in technical analysis used to identify and confirm downtrends in the price of a security. It is drawn by connecting two or more lower highs on a chart. The line moves from the upper left to the lower right, indicating that prices are gradually moving lower over time.
This trendline visually captures the essence of bearish sentiment, as each rally attempt fails to reach the high of the previous one. It reflects growing selling pressure and a lack of sustained buying interest, often leading to lower prices ahead.
How to Draw a Downward Sloping Trendline?
Drawing a downward sloping trendline is simple in principle, but accuracy is key:
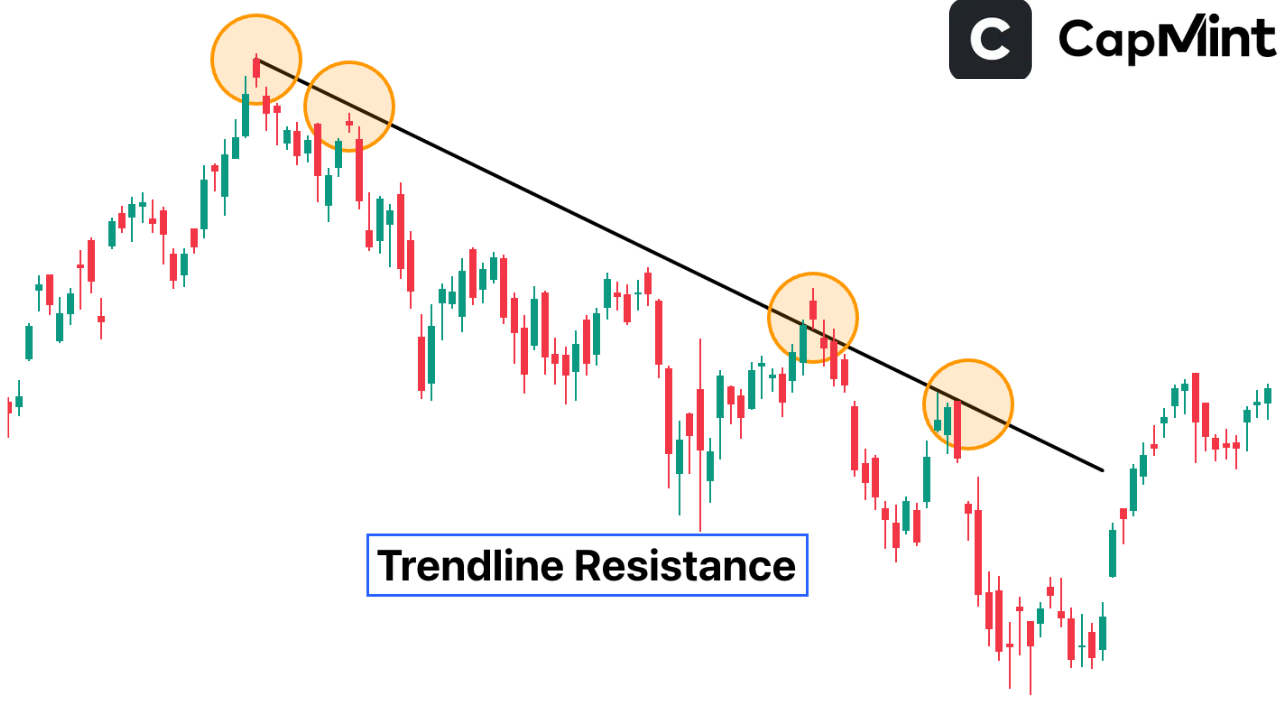
- Identify at least two lower highs; these are peaks in price that are lower than the ones before them. These points are also known as trendline resistance.
- Use a straight line to connect these highs.
- Extend the line to the right, projecting it forward as a potential resistance level for future price action.
Charting platforms often provide tools to draw trendlines, but even when done manually, the key is consistency; you must use clean, obvious swing highs and stick to the timeframe you’re analysing.
Importance of Downward Sloping Trendlines
Downward trendlines do more than just indicate that prices are falling; they give traders a deeper insight into how the market is behaving and where it might go next.
Identifying Resistance
One of the most practical uses of a downward trendline is spotting potential resistance. As the price climbs back up during a downtrend, it often bumps into the trendline and struggles to go higher. This behaviour is common because traders see that line as a selling zone, where the bears step back in.
Confirming Trend Strength
The angle of the trendline tells its own story. A steep slope typically signals strong selling pressure; buyers are either cautious or completely absent. A gentler slope, on the other hand, might mean the market is declining more slowly or taking a breather. This helps traders gauge whether they’re facing a rapid drop or a slow bleed.
Spotting Shorting Opportunities
For traders who like to go short, downward trendlines are gold. Every time the price nears the line and fails to break above it, it’s a signal that sellers are still in control. These moments often create great short setups, especially when combined with other bearish indicators.
Monitoring for Breakouts
Even in a downtrend, things can change. When the price manages to break above the downward trendline and hold there, it could be an early sign that the bears are losing grip. Traders watch this closely to catch possible reversals or at least short-term rallies. This breakout might not always mean a full reversal, but it certainly warrants attention.
Features of a Downward Sloping Trendline
A downward sloping trendline has several characteristics that make it a valuable tool for traders analysing bearish markets. Understanding these features can help traders identify trends more accurately and improve decision-making.
Connects Lower Highs
The primary feature of a downward sloping trendline is that it connects a series of lower highs on the chart. This pattern indicates that sellers are consistently entering the market at lower price levels, preventing the asset from moving higher.
Acts as Dynamic Resistance
Unlike horizontal resistance levels, a downward trendline moves with price action. As the trend develops, the trendline creates a dynamic resistance zone where sellers may continue to dominate and reject higher prices.
Reflects Bearish Market Sentiment
A downward-sloping trendline visually represents bearish sentiment in the market. The inability of buyers to push prices above previous highs suggests weakening demand and growing selling pressure.
Helps Identify Trend Continuation
As long as the price continues respecting the trendline, the prevailing downtrend remains intact. Multiple successful rejections from the trendline strengthen its validity and increase trader confidence in the trend.
Signals Potential Trend Reversals
A strong breakout above a downward-sloping trendline may indicate that bearish momentum is fading. When accompanied by higher trading volume or bullish confirmation signals, such breakouts can act as early warnings of a possible trend reversal.
How to Use a Downward Sloping Trendline for Trading?
Here’s how many traders use downward trendlines in real setups:
Sell Near the Line
When the price moves up to touch the trendline and starts to turn lower, traders see this as a strong entry for a short position. It often signals that sellers are stepping back in. This setup can be especially effective when supported by weak momentum or a resistance zone aligning with the trendline.
Place Stop-Losses Above the Line
Protecting your capital is key. Traders usually place their stop-loss orders just above the trendline in case the price breaks out unexpectedly. This way, if the market proves them wrong, the loss is limited and manageable.
Use Supporting Indicators
Trendlines become even more powerful when used alongside other technical tools. For example, if the RSI shows an overbought condition as price hits the trendline, or if MACD signals a bearish crossover, the trade idea gains more credibility. Volume spikes on rejections can further confirm bearish intent.
For example, if a stock consistently gets rejected at the trendline while momentum fades and bearish signals show up on indicators, it can offer a high-probability setup for short sellers. These confluences improve conviction and help filter out false signals.
Note –before jumping into any trade based on trend lines, traders must make sure that they identify at least two lower highs.
Common Mistakes to Avoid
Even experienced traders can slip up when using trendlines. Here are common mistakes to watch out for:
Connecting Random Highs
One of the biggest mistakes is forcing a trendline by connecting price peaks that don’t reflect the trend. Always stick to clearly visible, meaningful swing highs that align with the broader market direction. Random connections create misleading signals.
Relying on Only Two Points
While two points are technically enough to draw a line, using only two touchpoints makes the trendline less reliable. The more times the price respects the line, the stronger and more dependable it becomes.
Ignoring Breakouts
Sometimes, traders are so focused on the trendline that they ignore when the price convincingly breaks through it. A strong breakout, especially with volume and follow-through, often signals that the trend is changing, and ignoring it can lead to missed opportunities or losses.
Downward Sloping Trendline vs. Upward Sloping Trendline
Understanding the contrast between upward and downward sloping trendlines can offer key insights into market sentiment and trading opportunities. Here’s a friendly breakdown:
Downward Sloping Trendline
This one links a series of lower highs. It’s like watching a market slowly lose its footing. Sellers are dominating, and every attempt to rally is weaker than the last. This points to a bearish trend, suggesting that traders are expecting prices to continue dropping. It reflects caution or even fear among market participants.
Upward Sloping Trendline
This connects a series of higher lows on a chart. It essentially shows that buyers are in control, consistently stepping in at higher prices after each dip. This is a classic sign of a bullish trend, where optimism drives the market higher over time. If you’re seeing this kind of trendline, it usually means there’s strong demand and growing confidence in the asset.
Conclusion
Downward sloping trendlines are a must-know for traders looking to capitalise on bearish momentum. They help pinpoint resistance zones, improve short-entry timing, and warn of potential reversals.
But remember, no single tool tells the whole story. Always pair trendlines with broader market context and additional indicators for the best results.
Frequently Asked Questions (FAQs)
What does a Downward Sloping Trendline Indicate?
It shows a bearish trend where the price is making lower highs, reflecting increasing selling pressure and waning demand. This usually hints at limited buyer interest and potential for further downside.
How many points are needed to draw a valid trendline?
At least two, but more is better. A trendline with three or more touches is more trustworthy and respected by market participants. It helps confirm that the line holds real relevance in the market.
Can a downward trendline become upward sloping over time?
Yes, if the price breaks out and begins forming higher highs and higher lows, the trend has reversed. This shift can signal a change in sentiment from bearish to bullish among traders and investors.
Is it wise to short every time the price touches the trendline?
Not always. Look for confirmation like rejection candlesticks, resistance from other indicators, or declining volume on rallies. Blindly shorting can be risky without confluence or confirmation.
What happens when the price breaks above a downward-sloping trendline?
It could signal a trend reversal or a breakout rally. Confirmation is key—watch price action and volume to assess follow-through. A breakout may attract buyers, changing the market dynamic.
Articles to Read Further
Disclaimer: This content is for educational purposes only and does not constitute financial or investment advice. Investments in securities or other financial instruments are subject to market risk, including partial or total loss of capital. Past performance is not indicative of future results. Always consider your financial situation carefully and consult a licensed financial advisor before making investment or trading decisions.
Table of Content
- Key Takeaways
- What is a Downward Sloping Trendline?
- How to Draw a Downward Sloping Trendline?
- Importance of Downward Sloping Trendlines
- Features of a Downward Sloping Trendline
- How to Use a Downward Sloping Trendline for Trading?
- Common Mistakes to Avoid
- Downward Sloping Trendline vs. Upward Sloping Trendline
- Conclusion
- Frequently Asked Questions (FAQs)
- Articles to Read Further
Engineered for the obsessed. Built for traders.

Purpose-built terminals.
Zero compromise.
Built for speed.
Plot No 1290, 2nd Floor, 17th Cross, 5th Main, Sector-7, HSR Layout, Bangalore 560102
Follow us on
Mintcap Brokers Private Limited
CIN – U66110KA2023PTC178706 | Registered Address: Plot No 1290, Second Floor, 17th Cross, 5th Main, Sector-7, HSR Layout, Bangalore 560102 | Tel: 080 – 49552310 | Email ID: compliance@capmint.com | SEBI registered Stock Broker: INZ000322732 | NSE Cash/F&O Member ID: 90430 | BSE Cash/F&O Member ID: 6903 | MCX Member ID: 57400 | NCDEX Member ID: 1312 | SEBI registered Depository Participant: IN-DP-806-2025 | CDSL DP ID: 12102300 | NSE Clearing Member code: M70108 | AMFI-Registered Mutual Fund Distributor: ARN-289109 (Valid upto 28-Feb-2027) | Category II Execution Only Platform : E6903
Details of Client Bank Account
Compliance Officer: Ms. Shridevi Vungarala | Email ID: compliance@capmint.com | Tel no. + 91 9035330126 | Grievance Redressal Officer (GRO) – Ms. Shikha Gupta | Email ID: Grievance@capmint.com | Tel no: 9035331595.
Procedure to file a complaint on SEBI SCORES: Register on SCORES portal. Mandatory details for filing complaints on SCORES: Name, PAN, Address, Mobile Number, E-mail ID. Benefits: Effective Communication, Speedy redressal of the grievances. You may refer the website https://scores.sebi.gov.in/ for more information. You may also download the SEBI Scores app to log a complaint Android: https://play.google.com > store > apps > sebiscores iOS: https://apps.apple.com > app > sebiscores
Disclaimer
Investment in the securities market are subject to market risks, read all the related documents carefully before investing. Brokerage will not exceed the SEBI prescribed limit.
Mutual fund investments are subject to market risks, read all scheme related documents carefully before investing. Mutual Funds are not exchange-traded products.
Attention Investor:
- Stock Brokers can accept securities as margin from clients only by way of pledge in the depository system w.e.f. September 1, 2020.
- Update your mobile number & email Id with your stock broker/depository participant and receive OTP directly from depository on your email id and/or mobile number to create pledge.
- Pay 20% as upfront margin of the transaction value to trade in cash market segment.
- Investors may please refer to the Exchange’s Frequently Asked Questions (FAQs) issued vide circular reference NSE/INSP/45191 dated July 31, 2020 and NSE/INSP/45534 dated August 31, 2020 and other guidelines issued from time to time in this regard.
- Check your Securities /MF/ Bonds in the consolidated account statement issued by NSDL/CDSL every month.