
Table of Content
Link copied!
Resistance Levels
In technical analysis, a resistance level is a price point where a stock stops rising and may reverse downward. It acts like a ceiling where selling pressure overcomes buying interest.
Key Takeaways
- Resistance is a price ceiling: It’s where upward momentum stalls due to increased selling pressure, often leading to a price reversal.
- Comes in many forms: Resistance can be horizontal, trendline-based, moving average-based, or psychological (e.g., round numbers like 100 or 500).
- Essential for trade decisions: Helps in setting profit targets, stop-losses, and short entry points, and signals possible trend reversals or breakouts.
- It is not always reliable. False breakouts, news events, or a lack of confirmation can weaken resistance. Always combine with volume and indicators.
Introduction to Resistance Levels
While support levels mark where prices are likely to stop falling, resistance levels define where a price advance may stall or reverse. Recognising these levels can help traders time exits, place stop-losses, and even initiate short positions.
While trading, predicting where a trend might reverse or pause is as crucial as knowing where to enter, as it helps us keep the profits. While support levels mark where prices tend to stop falling, resistance levels show where they tend to stop rising or reverse.
Recognising resistance zones helps traders:
- Time exists more efficiently
- Place stop-losses strategically
- Initiate short positions effectively
In this article, we will break down how resistance works and how to use it to gain a trading edge.
What Are Resistance Levels?
Resistance levels are price points on a chart where an asset tends to encounter selling pressure. In other words, a resistance level is a price area where sellers overpower buyers and thus prevent upward momentum.
It acts like a ceiling that prevents the price from rising further. At resistance, supply typically outweighs demand, causing the upward momentum to pause or reverse. These levels often emerge due to the market psychology of traders who previously bought at this price and faced losses may want to exit at break-even, while others may see it as a good point to sell and book profits.
How Resistance Levels Work?
The concept of resistance hinges on the laws of supply and demand. As prices rise and approach a certain level, more sellers emerge, believing the asset is overvalued. This increased selling pressure curbs the upward momentum. If the price fails to break through resistance, it usually retraces or consolidates. However, if it does manage to break out decisively, that resistance level may turn into a new support, a key concept in technical trading.
Types of Resistance Levels
Just like support, resistance comes in different forms. Understanding these variations is essential for chart analysis:
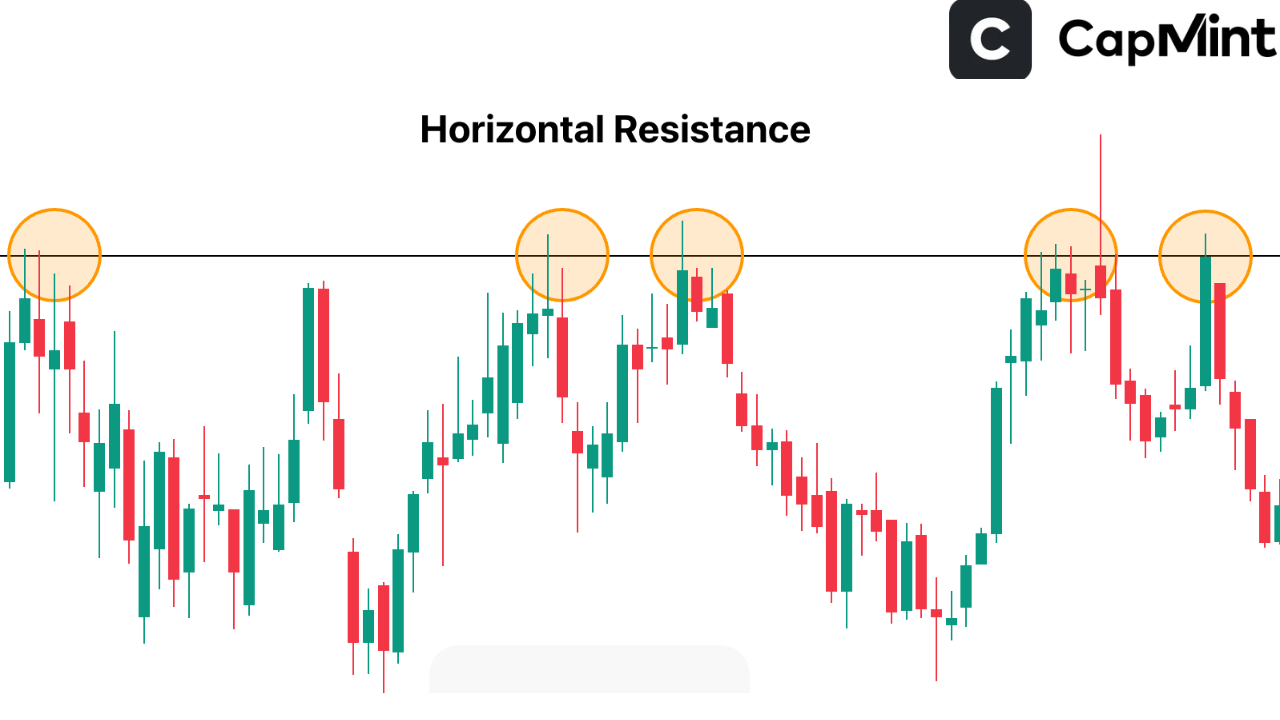
Horizontal Resistance
The most basic form, where prices have consistently failed to rise above a particular level.
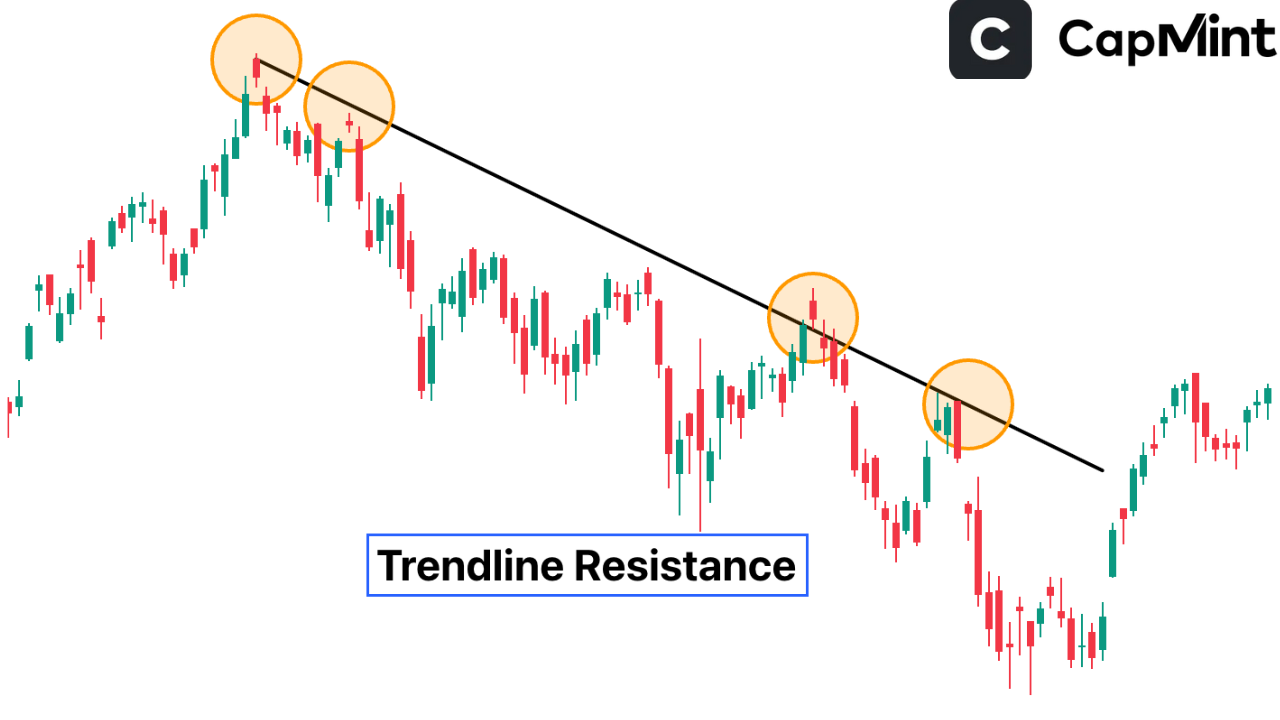
Trendline Resistance
Formed by drawing a line along the highs of a downtrend. Each touch and rejection of the line confirms its strength.
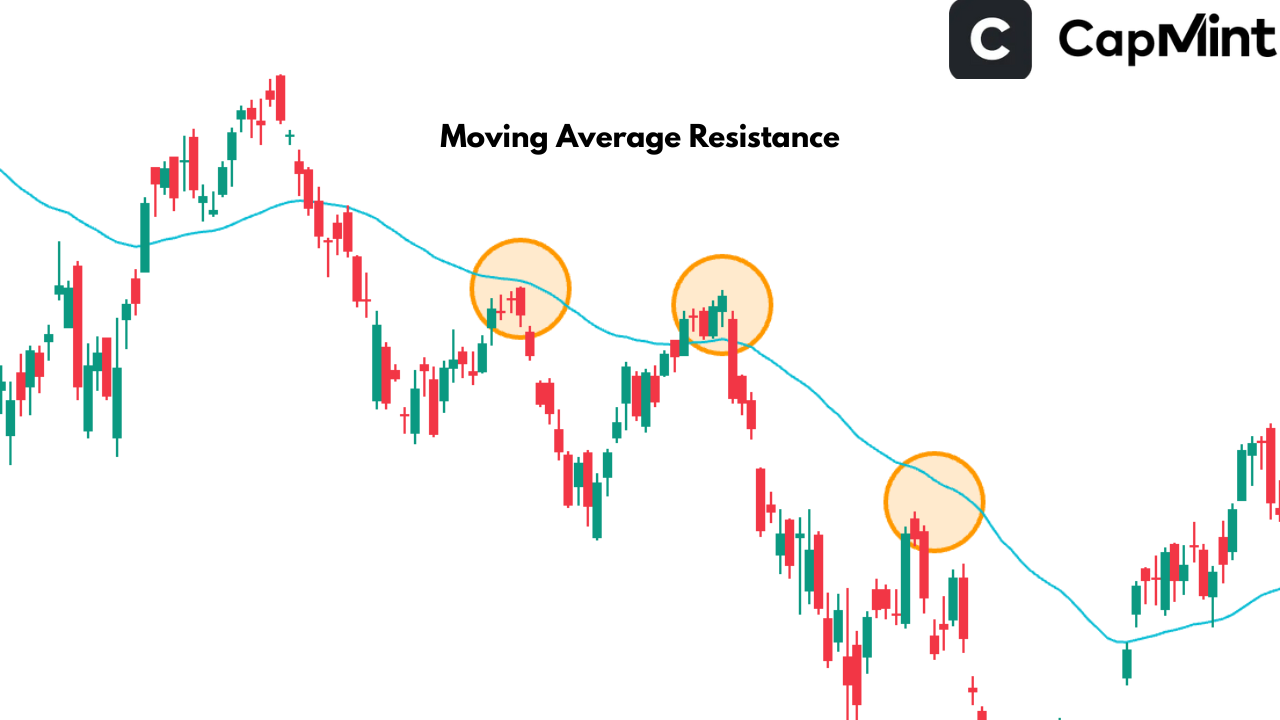
Moving Average Resistance
Certain moving averages, like the 50-day or 200-day, often act as dynamic resistance levels. Price tends to face difficulty moving past these points.
Psychological Resistance
Due to collective trader behaviour, round numbers such as 100, 500, or 1000 often act as natural resistance levels.
Identifying Resistance Levels
Accurate resistance identification improves decision-making and trade execution. Here are a few techniques traders use:
Historical Price Data:
Look for price levels where the asset repeatedly topped out in the past. These past peaks often attract sellers again, making them valuable indicators for future resistance.
Volume Clusters:
High trading volumes at specific price levels suggest heightened interest and activity. When these clusters occur at the top, they can signal strong resistance areas.
Technical Indicators:
Use tools like RSI and MACD to identify overbought zones. These indicators often align with resistance points where price momentum begins to slow.
Multi-Timeframe Analysis:
Confirm resistance zones across daily, weekly, or monthly charts. The more timeframes a resistance level appears on, the more traders notice and respect it.
Candlestick Patterns:
Watch for reversal patterns like shooting star, bearish engulfing, or doji. When these form near a known resistance, they often forecast a potential price decline.
Pro Tip: Like support, resistance is better viewed as a zone rather than an exact line. Price may briefly breach resistance before reversing, so allow room for small overshoots or fakeouts. We can see the same in the figures attached in the examples above.
Support and Resistance: The Dynamic Duo
Support and resistance form the backbone of technical trading. While support indicates where buying pressure steps in, resistance shows where selling dominates. When a resistance level is broken with strength and volume, it often flips roles and becomes a support level. This concept is widely used in breakout trading strategies.
Trading With Resistance Levels
Understanding and plotting resistance levels can significantly improve trade outcomes. Here’s why they matter:
Profit Targets
Resistance zones act as logical areas to book profits. If you’ve bought near a support level, resistance provides a reference point for exits.
Short Entry Triggers
For traders who short-sell, resistance levels are crucial. A failed rally near resistance might be a good entry point for a short position.
Stop-Loss Placement
In bearish setups, stop-losses are often placed just above resistance to manage risk in case of a breakout.
Trend Continuation or Reversal Signals
If the price breaks through a resistance level, it may indicate a bullish breakout and continuation of the uptrend. Conversely, rejection at resistance may signal weakening momentum.
Improved Trade Timing
Resistance levels help traders avoid entering long positions too late in an uptrend, preventing them from buying into exhaustion.
Overall, resistance levels act as guideposts for traders, helping with timing, risk control, and trade management.
Limitations of Resistance Levels
Despite their utility, resistance levels have limitations that every trader should be aware of:
False Breakouts
Prices can rise above a resistance level only to reverse quickly, trapping breakout traders. These false signals often occur in low-volume environments or during news-driven volatility.
Unpredictable News Events
Earnings announcements, economic data, or geopolitical news can abruptly change market direction, pushing prices well past resistance and invalidating prior technical setups.
Overemphasis on Historical Data
Resistance based on past price action might not always hold, particularly during strong bullish rallies or when new catalysts drive buyer enthusiasm.
Lack of Confluence
Resistance is more trustworthy when supported by other indicators or chart patterns. Without confluence from tools like RSI, volume, or trendlines, traders risk relying on weak signals.
Remember, resistance levels are guidelines, not guarantees. Always validate them with other analytical tools, manage risk carefully, and be prepared for exceptions in dynamic markets.
Conclusion
Resistance levels are essential components of any trader’s technical toolkit. They help identify areas where price may struggle to move higher, guiding traders on when to exit, short, or tighten stops. Like support, resistance is most effective when used in conjunction with other indicators and a solid trading plan. Mastering resistance analysis can add precision and confidence to your trading strategy, leading to better-informed decisions and more consistent results.
Frequently Asked Questions (FAQs)
What makes a resistance level strong?
A resistance level is considered strong when the price has been rejected from it multiple times, particularly with high volume. The more tests without a breakout, the more traders recognise and act on that level.
Can resistance become support?
Yes. When the price breaks above a resistance level convincingly, it often flips roles and becomes a new support level. This is known as a resistance-turned-support scenario and is widely used in breakout strategies.
Do resistance levels work in all markets?
Resistance analysis is applicable across markets, stocks, forex, crypto, and commodities. However, effectiveness can vary depending on volatility and liquidity.
Should I always sell at resistance?
Not necessarily. It depends on the broader trend and the strength of the breakout attempt. In strong uptrends, resistance may be broken easily, so it’s essential to combine resistance analysis with volume, momentum, and other technical indicators.
Q5. How do I confirm a breakout above resistance?
Look for strong bullish candles, increased volume, and a sustained move above the resistance level. Additional confirmation from RSI or MACD can provide more confidence in the breakout.
Disclaimer: This content is for educational purposes only and does not constitute financial or investment advice. Investments in securities or other financial instruments are subject to market risk, including partial or total loss of capital. Past performance is not indicative of future results. Always consider your financial situation carefully and consult a licensed financial advisor before making investment or trading decisions.
Table of Content
Engineered for the obsessed. Built for traders.

Purpose-built terminals.
Zero compromise.
Built for speed.
Plot No 1290, 2nd Floor, 17th Cross, 5th Main, Sector-7, HSR Layout, Bangalore 560102
Follow us on
Mintcap Brokers Private Limited
CIN – U66110KA2023PTC178706 | Registered Address: Plot No 1290, Second Floor, 17th Cross, 5th Main, Sector-7, HSR Layout, Bangalore 560102 | Tel: 080 – 49552310 | Email ID: compliance@capmint.com | SEBI registered Stock Broker: INZ000322732 | NSE Cash/F&O Member ID: 90430 | BSE Cash/F&O Member ID: 6903 | MCX Member ID: 57400 | NCDEX Member ID: 1312 | SEBI registered Depository Participant: IN-DP-806-2025 | CDSL DP ID: 12102300 | NSE Clearing Member code: M70108 | AMFI-Registered Mutual Fund Distributor: ARN-289109 (Valid upto 28-Feb-2027) | Category II Execution Only Platform : E6903
Details of Client Bank Account
Compliance Officer: Ms. Shridevi Vungarala | Email ID: compliance@capmint.com | Tel no. + 91 9035330126 | Grievance Redressal Officer (GRO) – Ms. Shikha Gupta | Email ID: Grievance@capmint.com | Tel no: 9035331595.
Procedure to file a complaint on SEBI SCORES: Register on SCORES portal. Mandatory details for filing complaints on SCORES: Name, PAN, Address, Mobile Number, E-mail ID. Benefits: Effective Communication, Speedy redressal of the grievances. You may refer the website https://scores.sebi.gov.in/ for more information. You may also download the SEBI Scores app to log a complaint Android: https://play.google.com > store > apps > sebiscores iOS: https://apps.apple.com > app > sebiscores
Disclaimer
Investment in the securities market are subject to market risks, read all the related documents carefully before investing. Brokerage will not exceed the SEBI prescribed limit.
Mutual fund investments are subject to market risks, read all scheme related documents carefully before investing. Mutual Funds are not exchange-traded products.
Attention Investor:
- Stock Brokers can accept securities as margin from clients only by way of pledge in the depository system w.e.f. September 1, 2020.
- Update your mobile number & email Id with your stock broker/depository participant and receive OTP directly from depository on your email id and/or mobile number to create pledge.
- Pay 20% as upfront margin of the transaction value to trade in cash market segment.
- Investors may please refer to the Exchange’s Frequently Asked Questions (FAQs) issued vide circular reference NSE/INSP/45191 dated July 31, 2020 and NSE/INSP/45534 dated August 31, 2020 and other guidelines issued from time to time in this regard.
- Check your Securities /MF/ Bonds in the consolidated account statement issued by NSDL/CDSL every month.