
Table of Content
- Key Takeaways
- What are Bearish Reversal Patterns?
- How Candlestick Patterns Work?
- How to Confirm a Bearish Reversal Candlestick Pattern?
- Key Bearish Reversal Candlestick Patterns
- Confirming Bearish Reversal Patterns
- Other Tools Used for Bearish Reversal Pattern
- Avoiding Common Mistakes during Bearish Reversal Pattern
- Conclusion
- Frequently Asked Questions (FAQs)
Link copied!
Bearish Reversal Candlestick Patterns
Bearish reversal candlestick patterns signal a potential shift in market direction from an uptrend to a downtrend, indicating that sellers may be gaining control over buyers.
Key Takeaways
- Each bearish reversal pattern visually represents a shift in control from buyers to sellers. Patterns like the Hanging Man, Shooting Star, Bearish Engulfing, Dark Cloud Cover, and Evening Star capture this sentiment change.
- These patterns are more effective when confirmed by volume spikes, key resistance levels, or other technical indicators.
- They work across all timeframes and are often used by traders to time exits or short positions.
- Proper risk management is crucial; even strong reversal patterns can fail due to unexpected news or broader market momentum.
What are Bearish Reversal Patterns?
Bearish reversal patterns are candlestick formations that indicate a potential shift in market sentiment from bullish to bearish. These patterns usually appear after an uptrend and suggest that buying momentum may be weakening while sellers are starting to gain control.
How Candlestick Patterns Work?
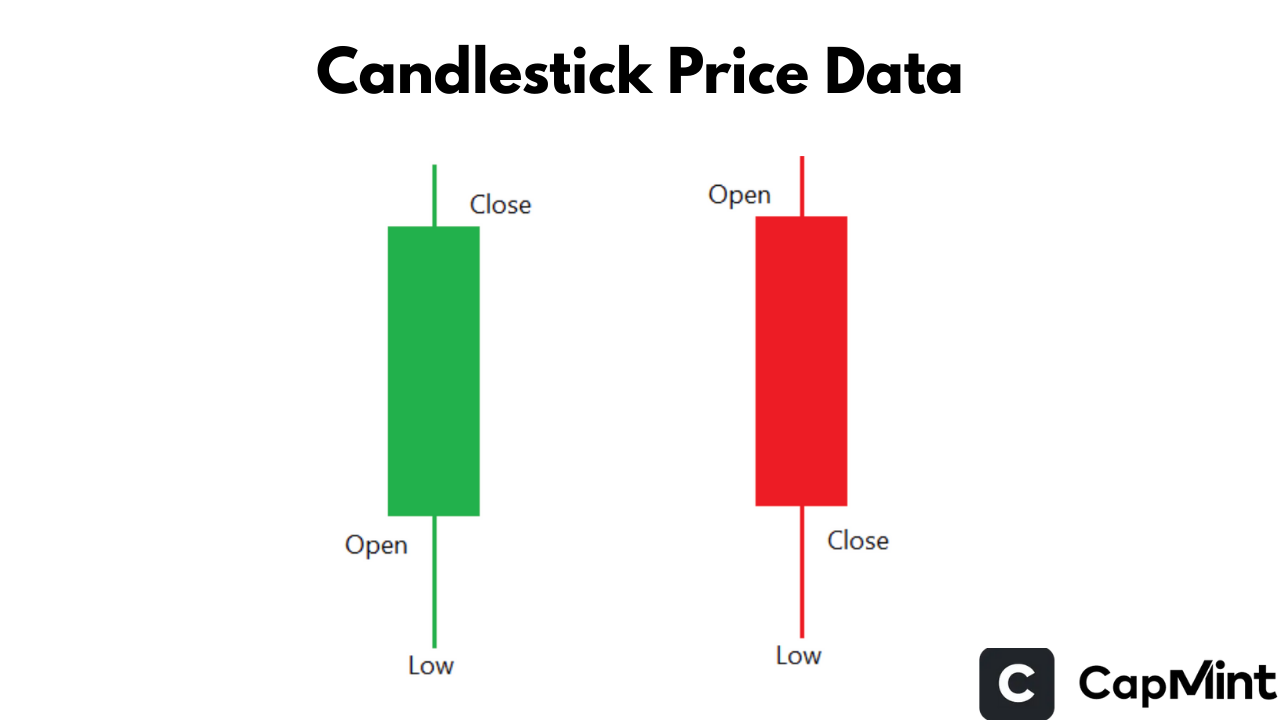
Just like bullish patterns, bearish candlestick patterns are built from single or multiple candlesticks that reflect price action and sentiment within a particular period. Key components include:
- Open: Starting price of the session.
- Close: Ending price of the session.
- High: Highest traded price.
- Low: Lowest traded price.
Bearish patterns typically form after an uptrend and signal a potential price drop, helping traders make informed decisions.
How to Confirm a Bearish Reversal Candlestick Pattern?
Bearish reversal candlestick patterns become more reliable when supported by additional confirmation signals. Professional traders often combine candlestick analysis with volume, resistance zones, and technical indicators to reduce false signals and improve trade accuracy.
1. Volume Analysis
Volume Analysis helps measure the strength behind a bearish reversal move. When a bearish pattern forms alongside a noticeable increase in trading volume, it often signals stronger selling pressure and growing market participation from sellers.
For example, a Bearish Engulfing or Shooting Star pattern with high volume may indicate that buyers are losing control and sellers are becoming more aggressive.
2. Resistance Zones
Resistance Level plays an important role in confirming bearish reversals. Patterns forming near major resistance levels generally carry more significance because these zones often attract selling pressure.
If the price gets rejected from a resistance zone while forming a bearish candlestick pattern, it increases the probability of a downward move.
3. Technical Indicators
Using additional technical indicators can strengthen the reliability of bearish reversal patterns.
- The Relative Strength Index moving down from overbought levels may indicate weakening bullish momentum.
- Moving Average Convergence Divergence bearish crossovers can confirm a potential shift in trend direction.
- Moving Average breakdowns may suggest that sellers are gaining control of the trend.
4. Confirmation Candle
Many traders wait for the next candle to confirm the reversal signal before entering a trade. A strong bearish candle closing below the reversal pattern often provides additional confirmation that selling momentum is strengthening.
Combining candlestick patterns with confirmation tools and broader market context can help traders identify higher-probability bearish reversal setups and avoid premature trades.
Key Bearish Reversal Candlestick Patterns
The Hanging Man
The Hanging Man appears after an uptrend and suggests a potential reversal. It has a small real body near the top with a long lower shadow, indicating that sellers tried to push prices down, but buyers managed to pull it back up slightly.
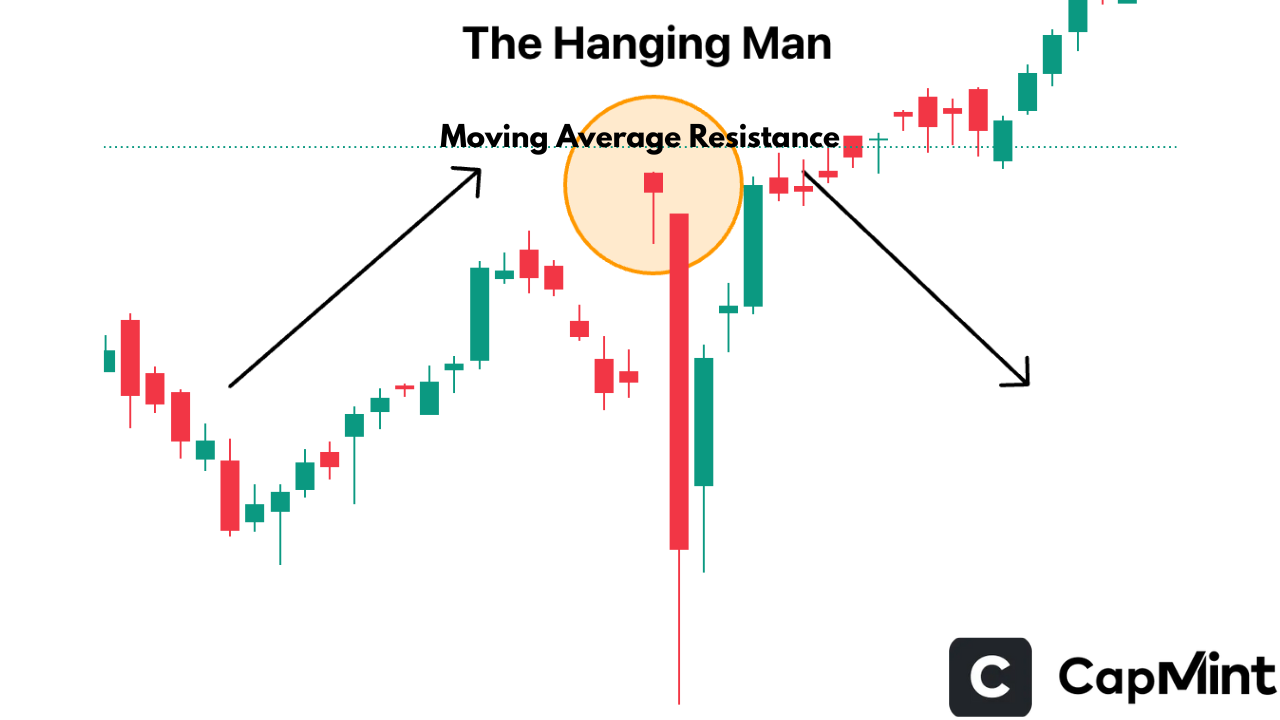
- Shows that buyers are losing control.
- The long lower wick signals increasing selling pressure.
- Needs confirmation from a bearish candle closing below the Hanging Man’s low.
The Shooting Star
The Shooting Star appears after an uptrend and features a small real body near the bottom with a long upper shadow. It indicates that buyers attempted to push the price higher but were overwhelmed by sellers.
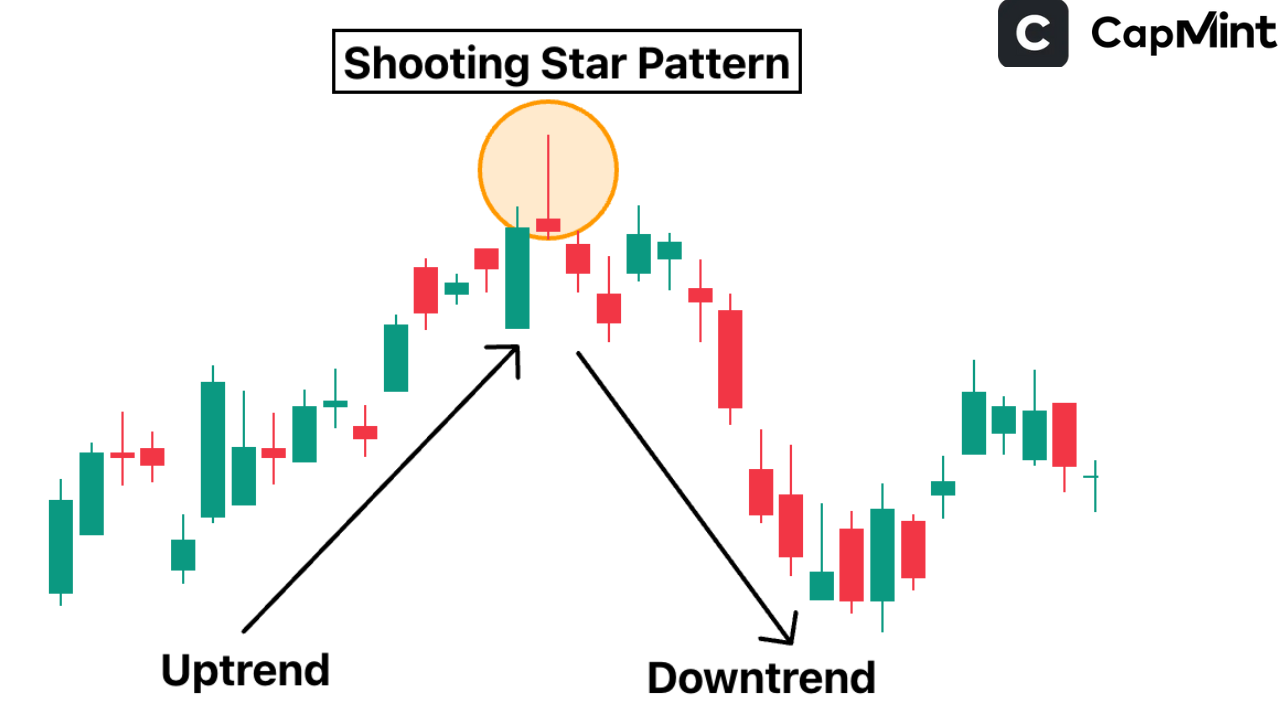
- Suggests exhaustion in buying momentum.
- The long upper wick reflects a failed attempt by bulls to continue the rally.
- Confirmation comes with a lower close on the next candle.
The Bearish Engulfing
This is a two-candle pattern where a large bearish candle completely engulfs the prior small bullish candle.
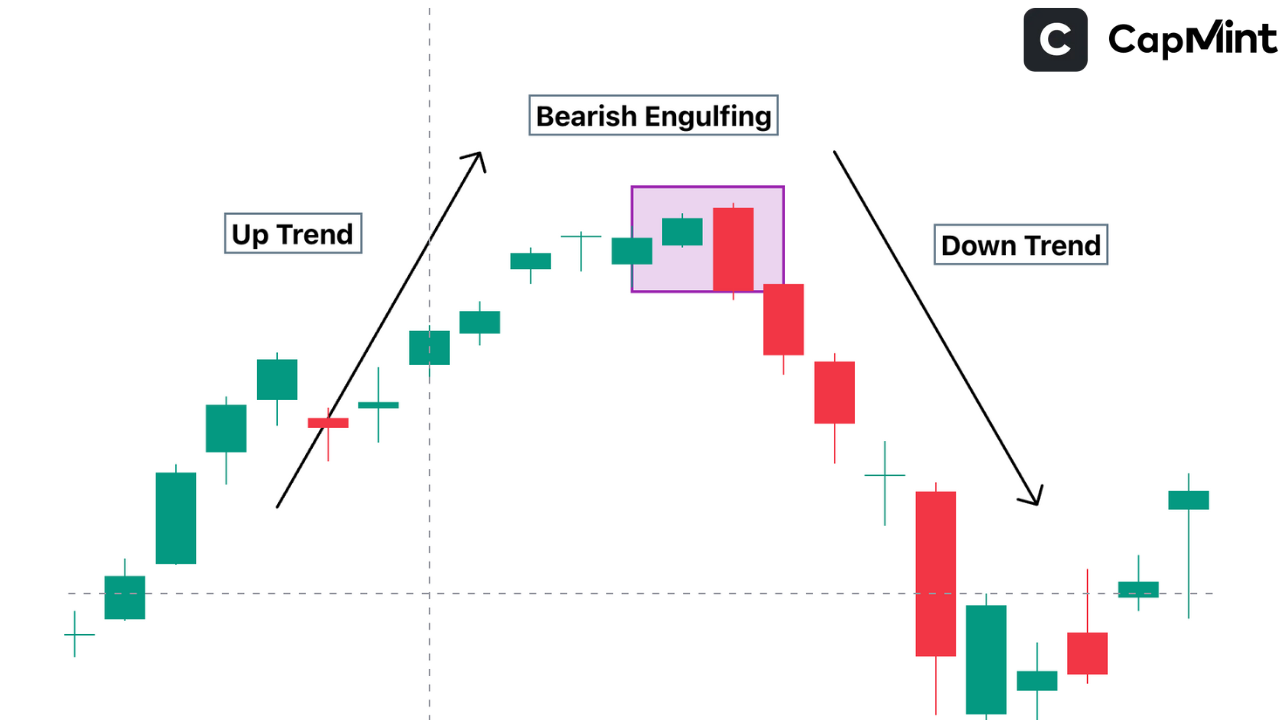
- Signifies a strong shift from buying to selling.
- Indicates aggressive selling pressure overpowering previous gains.
- Most effective when it forms at the end of an uptrend and on high volume.
The Dark Cloud Cover
The Dark Cloud Cover pattern consists of two candles. The first is a bullish candle followed by a bearish candle that opens higher but closes below the midpoint of the first candle.
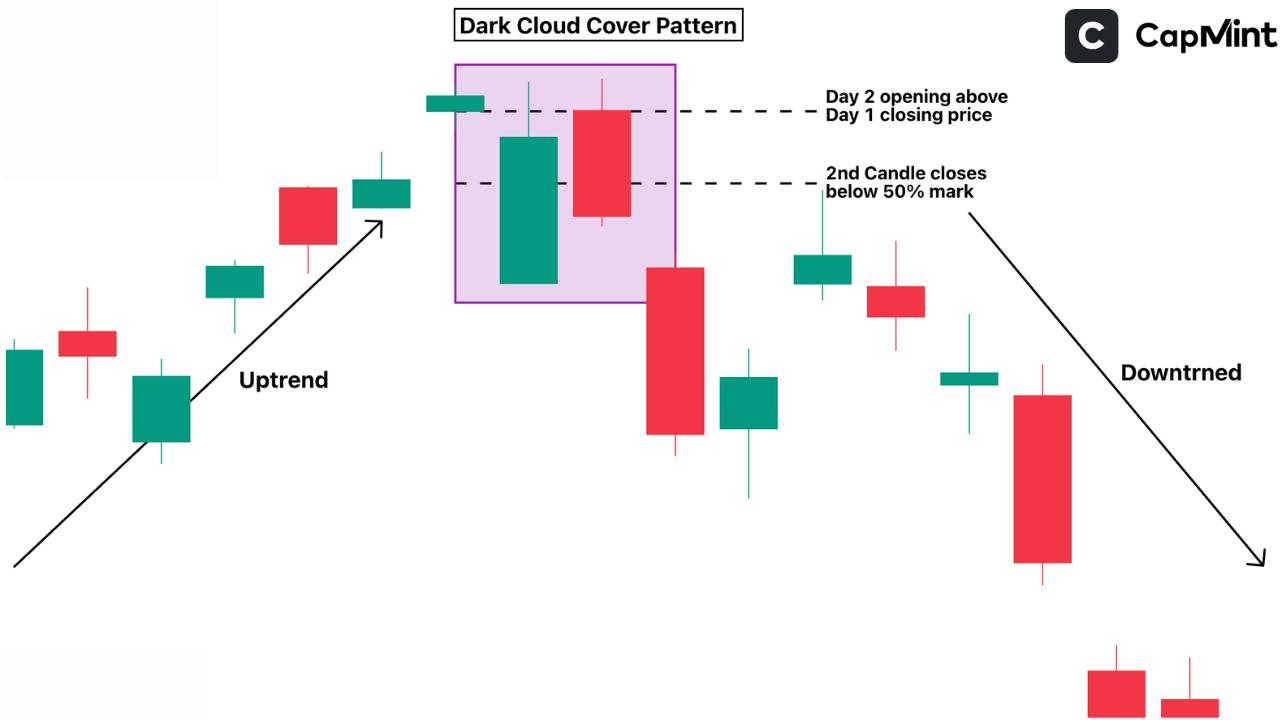
- The gap up shows bullish enthusiasm, but the bearish close below the midpoint shows rejection.
- Signals a loss of control by bulls.
- Confirmation from a lower close on the third candle strengthens the pattern.
The Evening Star
Evening Star is a three-candle reversal pattern that includes a strong bullish candle, a small indecisive candle (the star), and a large bearish candle.
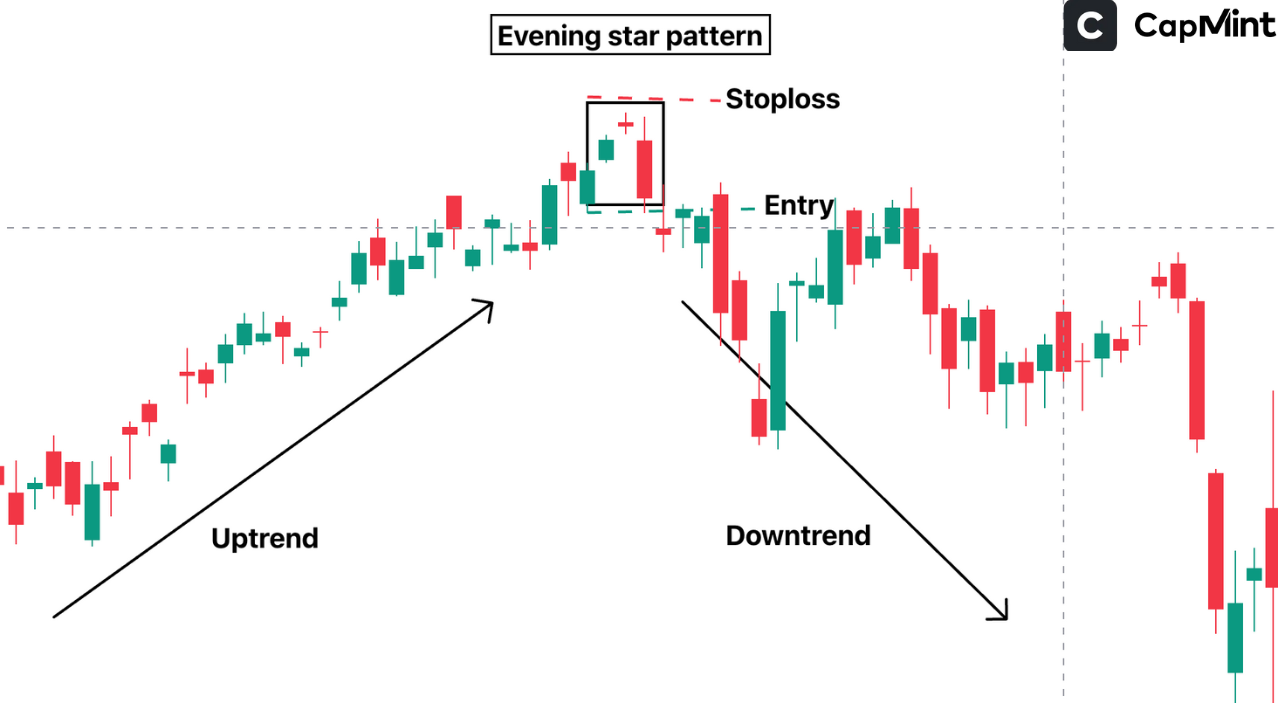
- The first candle shows bullish momentum.
- The star indicates indecision or exhaustion.
- The third candle confirms bearish control with a strong downward move.
- More reliable when the final candle closes below the midpoint of the first candle.
Confirming Bearish Reversal Patterns
To boost your confidence in spotting a valid bearish reversal, it helps to look for certain confirming signs that support what the candlestick pattern is suggesting. Here are a few practical ways to do that:
Volume Analysis
When a bearish reversal pattern appears alongside a spike in trading volume, it’s often a strong sign that the trend might truly be shifting. High volume means that more participants are selling, which adds credibility to the bearish sentiment.
Resistance Zones
If the pattern forms near a known resistance level, a price area where the stock has previously struggled to move higher, it becomes even more powerful. Resistance zones act like a ceiling, and when the price gets rejected there with a bearish signal, it often leads to a downward move.
Technical Indicators
Supportive signals from other technical tools can strengthen your analysis. For example, if the RSI is dropping from overbought territory, or the MACD shows a bearish crossover, or if the price starts trading below key moving averages, all of these add layers of confirmation to the reversal signal.
These extra checks help reduce the chance of acting on a false signal and give you a better picture of what’s happening in the market.
Other Tools Used for Bearish Reversal Pattern
Bearish reversal candlestick patterns are more effective when combined with additional trading tools and confirmation techniques. Traders often use multiple indicators together to improve analysis and identify stronger reversal setups.
1. Trendlines
Trendlines help traders identify the overall market direction and potential reversal areas. A bearish reversal pattern forming near an upward trendline breakdown may indicate weakening bullish momentum and the beginning of a possible downtrend.
2. Moving Averages
Moving averages are commonly used to confirm trend direction. If the price falls below key moving averages after a bearish reversal pattern appears, it may strengthen the bearish signal.
3. RSI Indicator
The Relative Strength Index helps identify overbought market conditions. A bearish reversal pattern accompanied by an RSI decline from overbought levels can indicate fading buying strength and growing selling pressure.
4. MACD Indicator
Moving Average Convergence Divergence helps traders identify momentum shifts. A bearish MACD crossover alongside a bearish reversal pattern may confirm a potential trend reversal.
5. Volume Analysis
Volume Analysis helps validate the strength of the reversal. Higher trading volume during a bearish reversal pattern often signals stronger participation from sellers and improves pattern reliability.
6. Support and Resistance Levels
Support and Resistance help traders identify important price levels where reversals are more likely to occur. Bearish reversal patterns forming near resistance zones generally carry greater significance.
Using these tools together with bearish candlestick patterns can help traders filter false signals and make more informed trading decisions.
Avoiding Common Mistakes during Bearish Reversal Pattern
Even seasoned traders can fall into some common traps when using bearish candlestick patterns. Here’s how to steer clear of them:
Don’t act on a single candle without confirmation
It can be tempting to jump in as soon as a pattern appears, but acting too quickly can lead to false entries. Always wait for the next candle to confirm the reversal.
Always consider the broader market context
A pattern might look perfect on a chart, but if the overall market is strongly bullish, the setup might not play out as expected. It’s crucial to look at what the larger market and sector are doing.
Use stop-loss orders to manage risk
Even the most textbook-perfect candlestick patterns can fail due to news events or sudden shifts in sentiment. Having a stop-loss in place protects your capital and helps you stay disciplined. Don’t act on a single candle without confirmation.
Conclusion
Bearish reversal candlestick patterns help traders identify potential topping points in uptrending markets. While they offer powerful visual signals, combining them with confirmation tools like volume, resistance levels, and technical indicators is essential for effective trading decisions. Practising patience, applying sound risk management, and waiting for confirmation can help traders avoid false signals and improve overall success.
Frequently Asked Questions (FAQs)
What is the most reliable bearish reversal candlestick pattern?
The Bearish Engulfing and Evening Star are among the most reliable, especially when confirmed with high volume and resistance.
Can these patterns be used for intraday trading?
Yes, they are effective across all timeframes, including intraday charts. However, confirmation becomes even more important in lower timeframes.
Should I enter a trade right after spotting the pattern?
No. Always wait for confirmation, like a bearish close below the pattern or supporting indicator signals, to reduce risk.
Are these patterns enough for trading decisions?
Not on their own. They are best used alongside other technical tools and proper risk management practices.
Disclaimer: This content is for educational purposes only and does not constitute financial or investment advice. Investments in securities or other financial instruments are subject to market risk, including partial or total loss of capital. Past performance is not indicative of future results. Always consider your financial situation carefully and consult a licensed financial advisor before making investment or trading decisions.
Table of Content
- Key Takeaways
- What are Bearish Reversal Patterns?
- How Candlestick Patterns Work?
- How to Confirm a Bearish Reversal Candlestick Pattern?
- Key Bearish Reversal Candlestick Patterns
- Confirming Bearish Reversal Patterns
- Other Tools Used for Bearish Reversal Pattern
- Avoiding Common Mistakes during Bearish Reversal Pattern
- Conclusion
- Frequently Asked Questions (FAQs)
Engineered for the obsessed. Built for traders.

Purpose-built terminals.
Zero compromise.
Built for speed.
Plot No 1290, 2nd Floor, 17th Cross, 5th Main, Sector-7, HSR Layout, Bangalore 560102
Follow us on
Mintcap Brokers Private Limited
CIN – U66110KA2023PTC178706 | Registered Address: Plot No 1290, Second Floor, 17th Cross, 5th Main, Sector-7, HSR Layout, Bangalore 560102 | Tel: 080 – 49552310 | Email ID: compliance@capmint.com | SEBI registered Stock Broker: INZ000322732 | NSE Cash/F&O Member ID: 90430 | BSE Cash/F&O Member ID: 6903 | MCX Member ID: 57400 | NCDEX Member ID: 1312 | SEBI registered Depository Participant: IN-DP-806-2025 | CDSL DP ID: 12102300 | NSE Clearing Member code: M70108 | AMFI-Registered Mutual Fund Distributor: ARN-289109 (Valid upto 28-Feb-2027) | Category II Execution Only Platform : E6903
Details of Client Bank Account
Compliance Officer: Ms. Shridevi Vungarala | Email ID: compliance@capmint.com | Tel no. + 91 9035330126 | Grievance Redressal Officer (GRO) – Ms. Shikha Gupta | Email ID: Grievance@capmint.com | Tel no: 9035331595.
Procedure to file a complaint on SEBI SCORES: Register on SCORES portal. Mandatory details for filing complaints on SCORES: Name, PAN, Address, Mobile Number, E-mail ID. Benefits: Effective Communication, Speedy redressal of the grievances. You may refer the website https://scores.sebi.gov.in/ for more information. You may also download the SEBI Scores app to log a complaint Android: https://play.google.com > store > apps > sebiscores iOS: https://apps.apple.com > app > sebiscores
Disclaimer
Investment in the securities market are subject to market risks, read all the related documents carefully before investing. Brokerage will not exceed the SEBI prescribed limit.
Mutual fund investments are subject to market risks, read all scheme related documents carefully before investing. Mutual Funds are not exchange-traded products.
Attention Investor:
- Stock Brokers can accept securities as margin from clients only by way of pledge in the depository system w.e.f. September 1, 2020.
- Update your mobile number & email Id with your stock broker/depository participant and receive OTP directly from depository on your email id and/or mobile number to create pledge.
- Pay 20% as upfront margin of the transaction value to trade in cash market segment.
- Investors may please refer to the Exchange’s Frequently Asked Questions (FAQs) issued vide circular reference NSE/INSP/45191 dated July 31, 2020 and NSE/INSP/45534 dated August 31, 2020 and other guidelines issued from time to time in this regard.
- Check your Securities /MF/ Bonds in the consolidated account statement issued by NSDL/CDSL every month.