
Table of Content
- Key Takeaways
- What is VWAP in the share market?
- What Is The Significance of VWAP in the Stock Market?
- How to Calculate VWAP?
- How to Use VWAP Indicator?
- Practical Applications of VWAP in Trading
- Difference between VWAP and SMA
- Limitations of Using VWAP
- What VWAP Tells Traders?
- Important Points to Remember While Using VWAP
- Conclusion
- Frequently Asked Questions (FAQs)
Link copied!
Volume Weighted Average Price (VWAP)
The Volume Weighted Average Price (VWAP) is a significant technical analysis tool used by traders to gauge the average price of a security over a specified period based on both volume and price. It plays a vital role in the stock market, helping traders make informed decisions.
Key Takeaways
- VWAP helps determine the average price at which a security has traded throughout the day, based on both volume and price.
- It is a key indicator for identifying the market trend. When the stock price is above the VWAP, it indicates a bullish trend, and when it is below, it suggests a bearish trend.
- Institutional traders often use VWAP to ensure they are buying or selling securities at the best possible price.
- VWAP can also be used to gauge the supply and demand dynamics of a particular security.
What is VWAP in the share market?
VWAP stands for Volume Weighted Average Price. It calculates the average price a security has traded at throughout the day, using both price and volume data. Unlike other indicators that might consider only price movements, VWAP integrates volume into its calculations, providing a more comprehensive view.
Know more about volume in trading.
What Is The Significance of VWAP in the Stock Market?
The VWAP indicator holds significant value in the stock market for several reasons:
VWAP as a Benchmark
VWAP is often used as a benchmark to compare the current price of a stock. If the stock price is below the VWAP, it might be undervalued; if it is above, it might be overvalued.
VWAP Helps in Analysing Trends
Traders often use VWAP to identify and confirm market trends. A rising VWAP can indicate an uptrend, while a falling VWAP can suggest a downtrend.
VWAP as Support and Resistance
Many traders use VWAP lines as levels of support and resistance, aiding in decision-making for entry and exit points.
Overall, VWAP is a versatile and powerful tool in a trader’s arsenal. Understanding and effectively using VWAP can enhance trading strategies and potentially improve trading outcomes.
How to Calculate VWAP?
Volume Weighted Average Price (VWAP) is a crucial indicator used by traders. VWAP calculation can help traders understand the average price at which a stock has traded throughout the day. Here’s a step-by-step guide to calculating VWAP manually and using charting tools:
VWAP Formula
The formula to calculate VWAP is:
VWAP = (Sum of (Tick Price × Tick Volume)) / Trading Volume
Manual Calculation of VWAP
Follow these steps to manually calculate VWAP:
- Collect Data: Gather the price and volume data for each tick (transaction) throughout the trading day.
- Calculate the Product for Each Tick: Multiply the price of each tick by the volume of each tick to get the tick value.
- Sum the Tick Products: Add up all the values obtained in the previous step.
- Sum the Volumes: Add up all the volumes traded during the trading day.
- Apply the Formula: Divide the total value obtained from the sum of tick products by the total trading volume.
Example:
- Tick 1: Price = ₹100, Volume = 50
- Tick 2: Price = ₹102, Volume = 30
- Tick 3: Price = ₹101, Volume = 20
Sum of (Tick Price × Tick Volume) = (100×50) + (102×30) + (101×20) = 5000 + 3060 + 2020 = 10080
Sum of Volumes = 50 + 30 + 20 = 100
VWAP = 10080 / 100 = ₹100.80
How to Use VWAP Indicator?
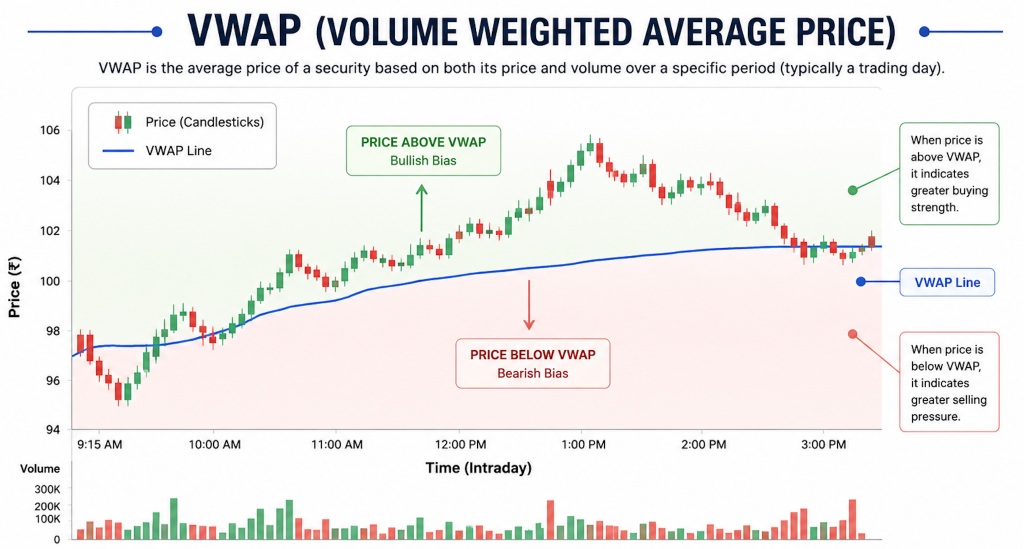
Traders use the VWAP indicator to identify market direction, potential entry points, and exit opportunities during intraday trading. When the stock price trades above the VWAP line, it generally indicates bullish momentum, while trading below the VWAP may suggest bearish sentiment.
Many traders also use VWAP as a support and resistance level to plan trades more effectively. It is often combined with indicators like RSI, moving averages, and volume analysis for better confirmation and improved trading decisions.
Read more: volume indicators.
Practical Applications of VWAP in Trading
The Volume Weighted Average Price (VWAP) is a versatile tool in trading that offers actionable insights and benefits, especially when integrated into sophisticated trading strategies. Here, we explore three primary applications of VWAP in trading:
1. VWAP as a Trend Confirmation Tool
Traders extensively use VWAP to confirm market trends. By comparing the current price to the VWAP, traders can determine whether the market is in an uptrend or a downtrend:
- If the price is above the VWAP, it indicates a bullish trend, suggesting buying opportunities.
- If the price is below the VWAP, it signifies a bearish trend, signalling selling opportunities.
The utility of VWAP helps traders ensure that their trades align with the overarching market trend, reducing the risk of acting against the market direction.
Read more: trend analysis.
2. Usage by Institutional Traders to Minimise Market Impact
Institutional traders, who typically deal with large volumes of stocks, use VWAP to minimise market impact. Executing large trades can move the market unfavourably if not done systematically. Here’s how VWAP helps:
- Traders break their large orders into smaller, more manageable chunks executed at or near the VWAP.
- By doing so, they avoid significant price moves that could adversely impact their trading outcomes.
- This approach ensures a more consistent and gradual participation in the market, maintaining price stability.
Using VWAP in this manner aligns institutional trading practices with market conditions, promoting smoother trade executions.
3. Integration of VWAP into Trading Strategies
VWAP can be seamlessly integrated into various trading strategies to enhance their effectiveness. Some ways traders use VWAP include:
- Intraday Trading: Day traders use VWAP to decide entry and exit points within a single trading day, taking advantage of VWAP’s ability to reflect the average trading price.
- Algorithmic Trading: Automated trading programs incorporate VWAP to execute trades based on predefined rules, ensuring trades are made at optimal prices.
- Swing Trading: Swing traders rely on VWAP to identify short-term market reversals and capitalise on price swings by comparing the price to the VWAP trend.
Thus, VWAP serves as a critical component in both manual and automated trading strategies, providing a robust metric to guide trading decisions.
Overall, the practical applications of VWAP in trading exemplify its importance and utility in achieving better-informed and more strategic trading decisions.
Difference between VWAP and SMA
|
Aspect |
VWAP (Volume Weighted Average Price) |
SMA (Simple Moving Average) |
|---|---|---|
|
Calculation Method |
Average price weighted by volume. Calculated as (Price × Volume) ÷ Total Volume over a period. |
Average of closing prices over a fixed number of periods. All prices get equal weight. |
|
Use Case |
Used mainly for intraday trading by institutional traders to execute large orders efficiently. |
Used by retail traders to identify market trends and generate trading signals. |
|
Trading Strategy |
Helps find ideal entry/exit points during the day without moving the market too much. |
Helps determine overall trend direction (bullish or bearish) over time. |
|
Example |
A trader buys when the price is below VWAP to get a better deal and avoid pushing the price higher. |
A 50-day SMA crossing above the 200-day SMA may signal a buying opportunity (Golden Cross). |
|
Timeframe |
Typically used on intraday charts (like 1-min or 5-min). |
Applied to both short-term and long-term charts (like 20-day, 50-day, or 200-day). |
Limitations of Using VWAP
While VWAP (Volume Weighted Average Price) is a valuable tool for traders, it does come with certain limitations that must be acknowledged. Understanding these constraints can help traders make more informed decisions when incorporating VWAP into their strategies.
Single-day Indicator and Its Lagging Nature
VWAP is a single-day indicator, meaning it resets at the start of each trading day. This can limit its effectiveness for traders looking to analyse longer time frames. Additionally, because VWAP is calculated using historical data from the current trading day, it can lag behind real-time market movements. This lag might cause traders to react to market changes more slowly than preferred.
Potential Missed Opportunities in Uptrends
Another limitation of VWAP is its potential to cause traders to miss out on buying opportunities during strong uptrends. Since VWAP requires a stock’s price to return to the average before signalling a buy, traders might miss out on potential gains if the stock continues to rise without pulling back.
Dependence on Historical Data
VWAP relies heavily on historical data to provide its average price. While this can offer a stable reference point, it can also be problematic during periods of high volatility or significant market events that may cause rapid price changes. Dependence on past data means VWAP might not always accurately reflect the current market conditions or predict future movements.
In summary, although VWAP is an essential tool for many traders, understanding its limitations is crucial for enhancing trading strategies and avoiding potential pitfalls.
What VWAP Tells Traders?
The Volume Weighted Average Price (VWAP) is an essential tool for traders to gain critical insights into stock performance over a trading session. Below are the key areas where VWAP proves invaluable:
Insights into Stock Liquidity
VWAP helps traders understand the liquidity of a stock, which is crucial for deciding entry and exit points. A higher VWAP signifies high buying activity and increased stock liquidity, whereas a lower VWAP may indicate low liquidity and selling pressure.
Understanding Institutional Trading Strategies
Many institutional traders and hedge funds use VWAP as a benchmark for their trades. Keeping an eye on VWAP can give retail traders a glimpse into the strategies of these large players. For instance, if the market price is below the VWAP, institutional traders might be buying, assuming the stock is undervalued.
Analysing Average Price and Volume Trends
VWAP gives traders a comprehensive view of price movements and trading volumes throughout the day. By comparing the current price to the VWAP, traders can assess if they are getting a good deal on their trades. It also helps in identifying price trends and possible reversals, fostering better trading decisions.
In summary, VWAP is a multifaceted indicator helping traders to assess liquidity, understand major market participants’ strategies, and analyse average price trends, thereby providing a well-rounded view for making trading decisions.
Important Points to Remember While Using VWAP
Time Frame
VWAP is recalculated every day, so it is best used for intraday trading rather than long-term investment decisions.
Volume Consideration
Heavy trading volume around the VWAP line can indicate stronger price movements and can be a signal for a potential trade.
Avoiding Market Noise
VWAP can help filter out market noise and provide a clearer picture of the security’s true value.
Combining with Other Indicators
Using VWAP in conjunction with other technical indicators like Moving Averages or Relative Strength Index (RSI) can provide a more robust trading strategy.
Customisation
Many trading platforms allow customisation of VWAP indicator settings, such as different time frames or additional bands around the VWAP line to suit specific trading needs.
By adequately understanding and utilising VWAP, Indian traders can improve their entry and exit points, leading to more informed and strategic trading decisions.
Conclusion
In conclusion, VWAP is a valuable tool that helps traders understand the true average price of a stock during the day by including both price and volume. It can guide better entry and exit points, show market direction, and reduce the impact of large trades.
Whether you are a beginner or an experienced trader, using VWAP can improve your decision-making and give you a clearer view of market trends. Adding VWAP to your trading strategy can help you stay more informed and confident in fast-moving markets. It’s a smart step towards making more balanced and thoughtful trading choices.
Frequently Asked Questions (FAQs)
What does the VWAP tell you?
VWAP (Volume Weighted Average Price) shows the average price a stock has traded at during the day, taking both price and volume into account. It helps traders understand whether the current price is higher or lower than the day’s average, giving a sense of market trend and fair value.
Is VWAP bullish or bearish?
VWAP itself isn’t bullish or bearish. If the price is above VWAP, it’s usually seen as bullish because buyers are in control. If the price is below VWAP, it’s often viewed as bearish since sellers dominate.
Is VWAP better than EMA?
VWAP and EMA are used differently. VWAP is an intraday tool focused on price and volume, widely used by day traders and institutions to assess fair value. EMA (Exponential Moving Average) smooths price data and can be applied across any timeframe, making it useful for spotting trends. Neither is strictly better; it depends on your trading style and objective.
Disclaimer: This content is for educational purposes only and does not constitute financial or investment advice. Investments in securities or other financial instruments are subject to market risk, including partial or total loss of capital. Past performance is not indicative of future results. Always consider your financial situation carefully and consult a licensed financial advisor before making investment or trading decisions.
Table of Content
- Key Takeaways
- What is VWAP in the share market?
- What Is The Significance of VWAP in the Stock Market?
- How to Calculate VWAP?
- How to Use VWAP Indicator?
- Practical Applications of VWAP in Trading
- Difference between VWAP and SMA
- Limitations of Using VWAP
- What VWAP Tells Traders?
- Important Points to Remember While Using VWAP
- Conclusion
- Frequently Asked Questions (FAQs)
Engineered for the obsessed. Built for traders.

Purpose-built terminals.
Zero compromise.
Built for speed.
Plot No 1290, 2nd Floor, 17th Cross, 5th Main, Sector-7, HSR Layout, Bangalore 560102
Follow us on
Mintcap Brokers Private Limited
CIN – U66110KA2023PTC178706 | Registered Address: Plot No 1290, Second Floor, 17th Cross, 5th Main, Sector-7, HSR Layout, Bangalore 560102 | Tel: 080 – 49552310 | Email ID: compliance@capmint.com | SEBI registered Stock Broker: INZ000322732 | NSE Cash/F&O Member ID: 90430 | BSE Cash/F&O Member ID: 6903 | MCX Member ID: 57400 | NCDEX Member ID: 1312 | SEBI registered Depository Participant: IN-DP-806-2025 | CDSL DP ID: 12102300 | NSE Clearing Member code: M70108 | AMFI-Registered Mutual Fund Distributor: ARN-289109 (Valid upto 28-Feb-2027) | Category II Execution Only Platform : E6903
Details of Client Bank Account
Compliance Officer: Ms. Shridevi Vungarala | Email ID: compliance@capmint.com | Tel no. + 91 9035330126 | Grievance Redressal Officer (GRO) – Ms. Shikha Gupta | Email ID: Grievance@capmint.com | Tel no: 9035331595.
Procedure to file a complaint on SEBI SCORES: Register on SCORES portal. Mandatory details for filing complaints on SCORES: Name, PAN, Address, Mobile Number, E-mail ID. Benefits: Effective Communication, Speedy redressal of the grievances. You may refer the website https://scores.sebi.gov.in/ for more information. You may also download the SEBI Scores app to log a complaint Android: https://play.google.com > store > apps > sebiscores iOS: https://apps.apple.com > app > sebiscores
Disclaimer
Investment in the securities market are subject to market risks, read all the related documents carefully before investing. Brokerage will not exceed the SEBI prescribed limit.
Mutual fund investments are subject to market risks, read all scheme related documents carefully before investing. Mutual Funds are not exchange-traded products.
Attention Investor:
- Stock Brokers can accept securities as margin from clients only by way of pledge in the depository system w.e.f. September 1, 2020.
- Update your mobile number & email Id with your stock broker/depository participant and receive OTP directly from depository on your email id and/or mobile number to create pledge.
- Pay 20% as upfront margin of the transaction value to trade in cash market segment.
- Investors may please refer to the Exchange’s Frequently Asked Questions (FAQs) issued vide circular reference NSE/INSP/45191 dated July 31, 2020 and NSE/INSP/45534 dated August 31, 2020 and other guidelines issued from time to time in this regard.
- Check your Securities /MF/ Bonds in the consolidated account statement issued by NSDL/CDSL every month.