
Link copied!
Trend Analysis
Trend analysis is the process of studying price movements over time to identify patterns or directions in the market, whether it’s going up, down, or moving sideways.
Key Takeaways
- What is Trend Analysis?
Trend analysis means studying past price movements to understand which way the market is moving—whether it’s going up, down, or sideways. It helps traders guess what might happen next by looking at what has happened before. - Types of Market Trends
There are mainly three types of trends: upward (prices rising), downward (prices falling), and sideways (prices moving in a flat range). Knowing which one is happening helps traders make smarter decisions. - Why It’s Important
Trend analysis helps traders follow the market’s direction instead of going against it. It also reduces emotional mistakes and helps in picking the right time to buy or sell a stock. - Tools That Help Spot Trends
Traders use tools like moving averages, MACD, RSI, chart patterns, and volume to find and confirm market trends. But it’s important to know that these tools aren’t perfect and should be used with care.
What Is Trend Analysis?
Trend analysis involves studying historical market data such as price, volume, or indices to predict how an asset might move in the future. It helps traders and investors understand the likely direction of the market based on past patterns.
The main focus of trend analysis is on identifying the direction (uptrend, downtrend, or sideways), the strength (how strong the move is), and the duration (how long the trend might last). By analysing these factors, traders can align their strategies with the current market momentum.
This technique isn’t limited to just stock prices. It can also be applied to market indices, trading volumes, moving averages, and even economic indicators, making it a versatile tool for anyone involved in the financial markets.
Types of Trends
While analysing a chart, there are three types of charts. Here is the breakdown of them:
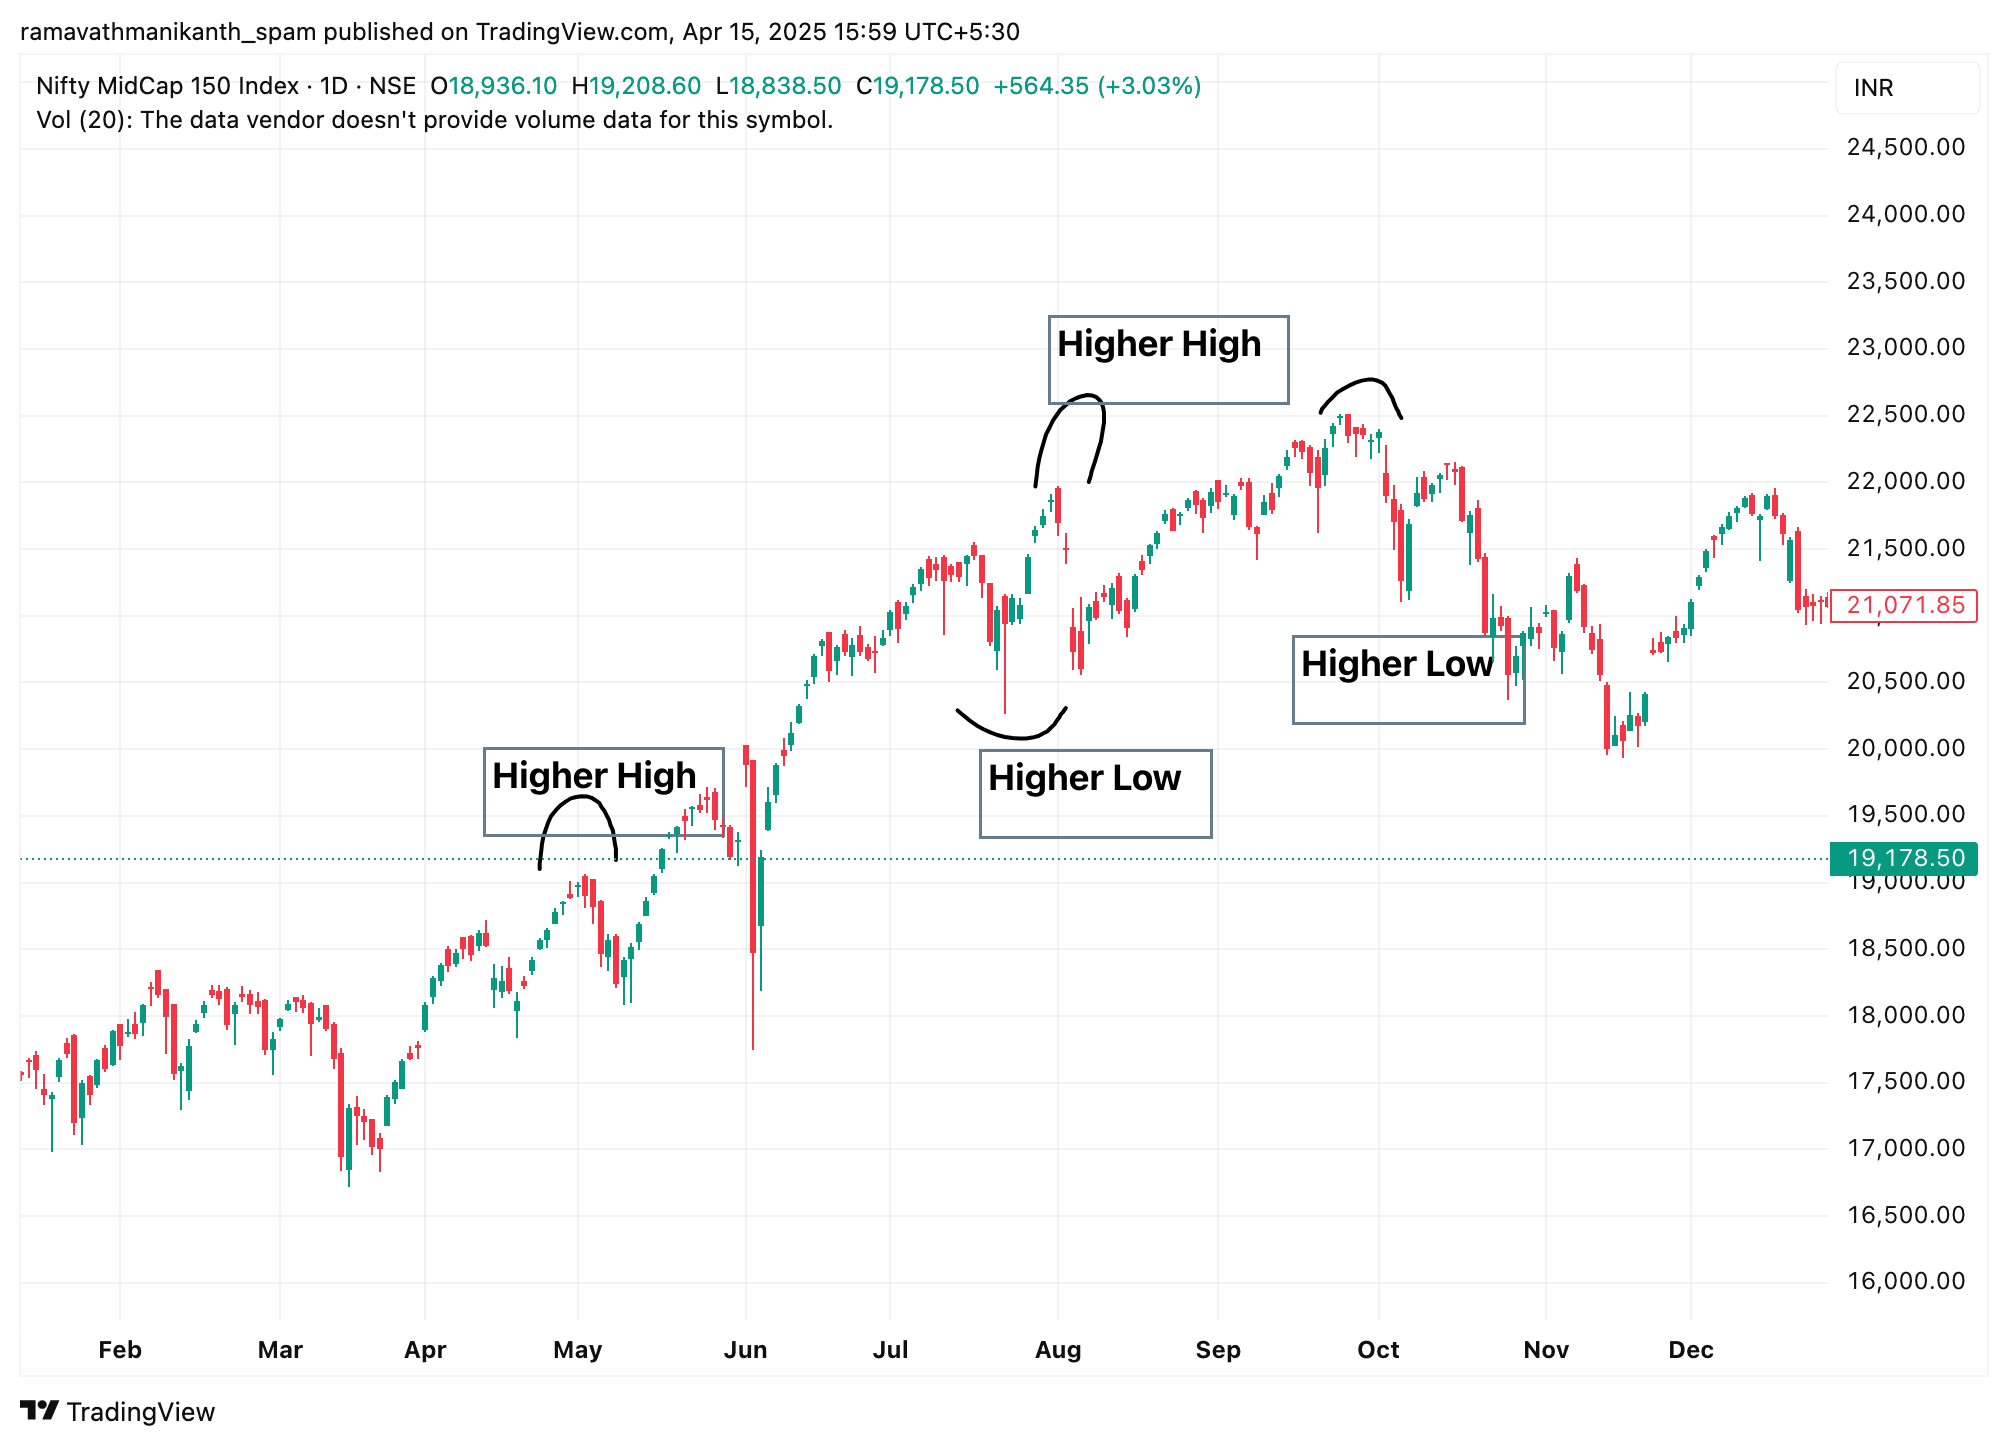
Uptrend:
An uptrend is when the price keeps making higher highs and higher lows. It shows strong buying interest and signals a bullish market sentiment.
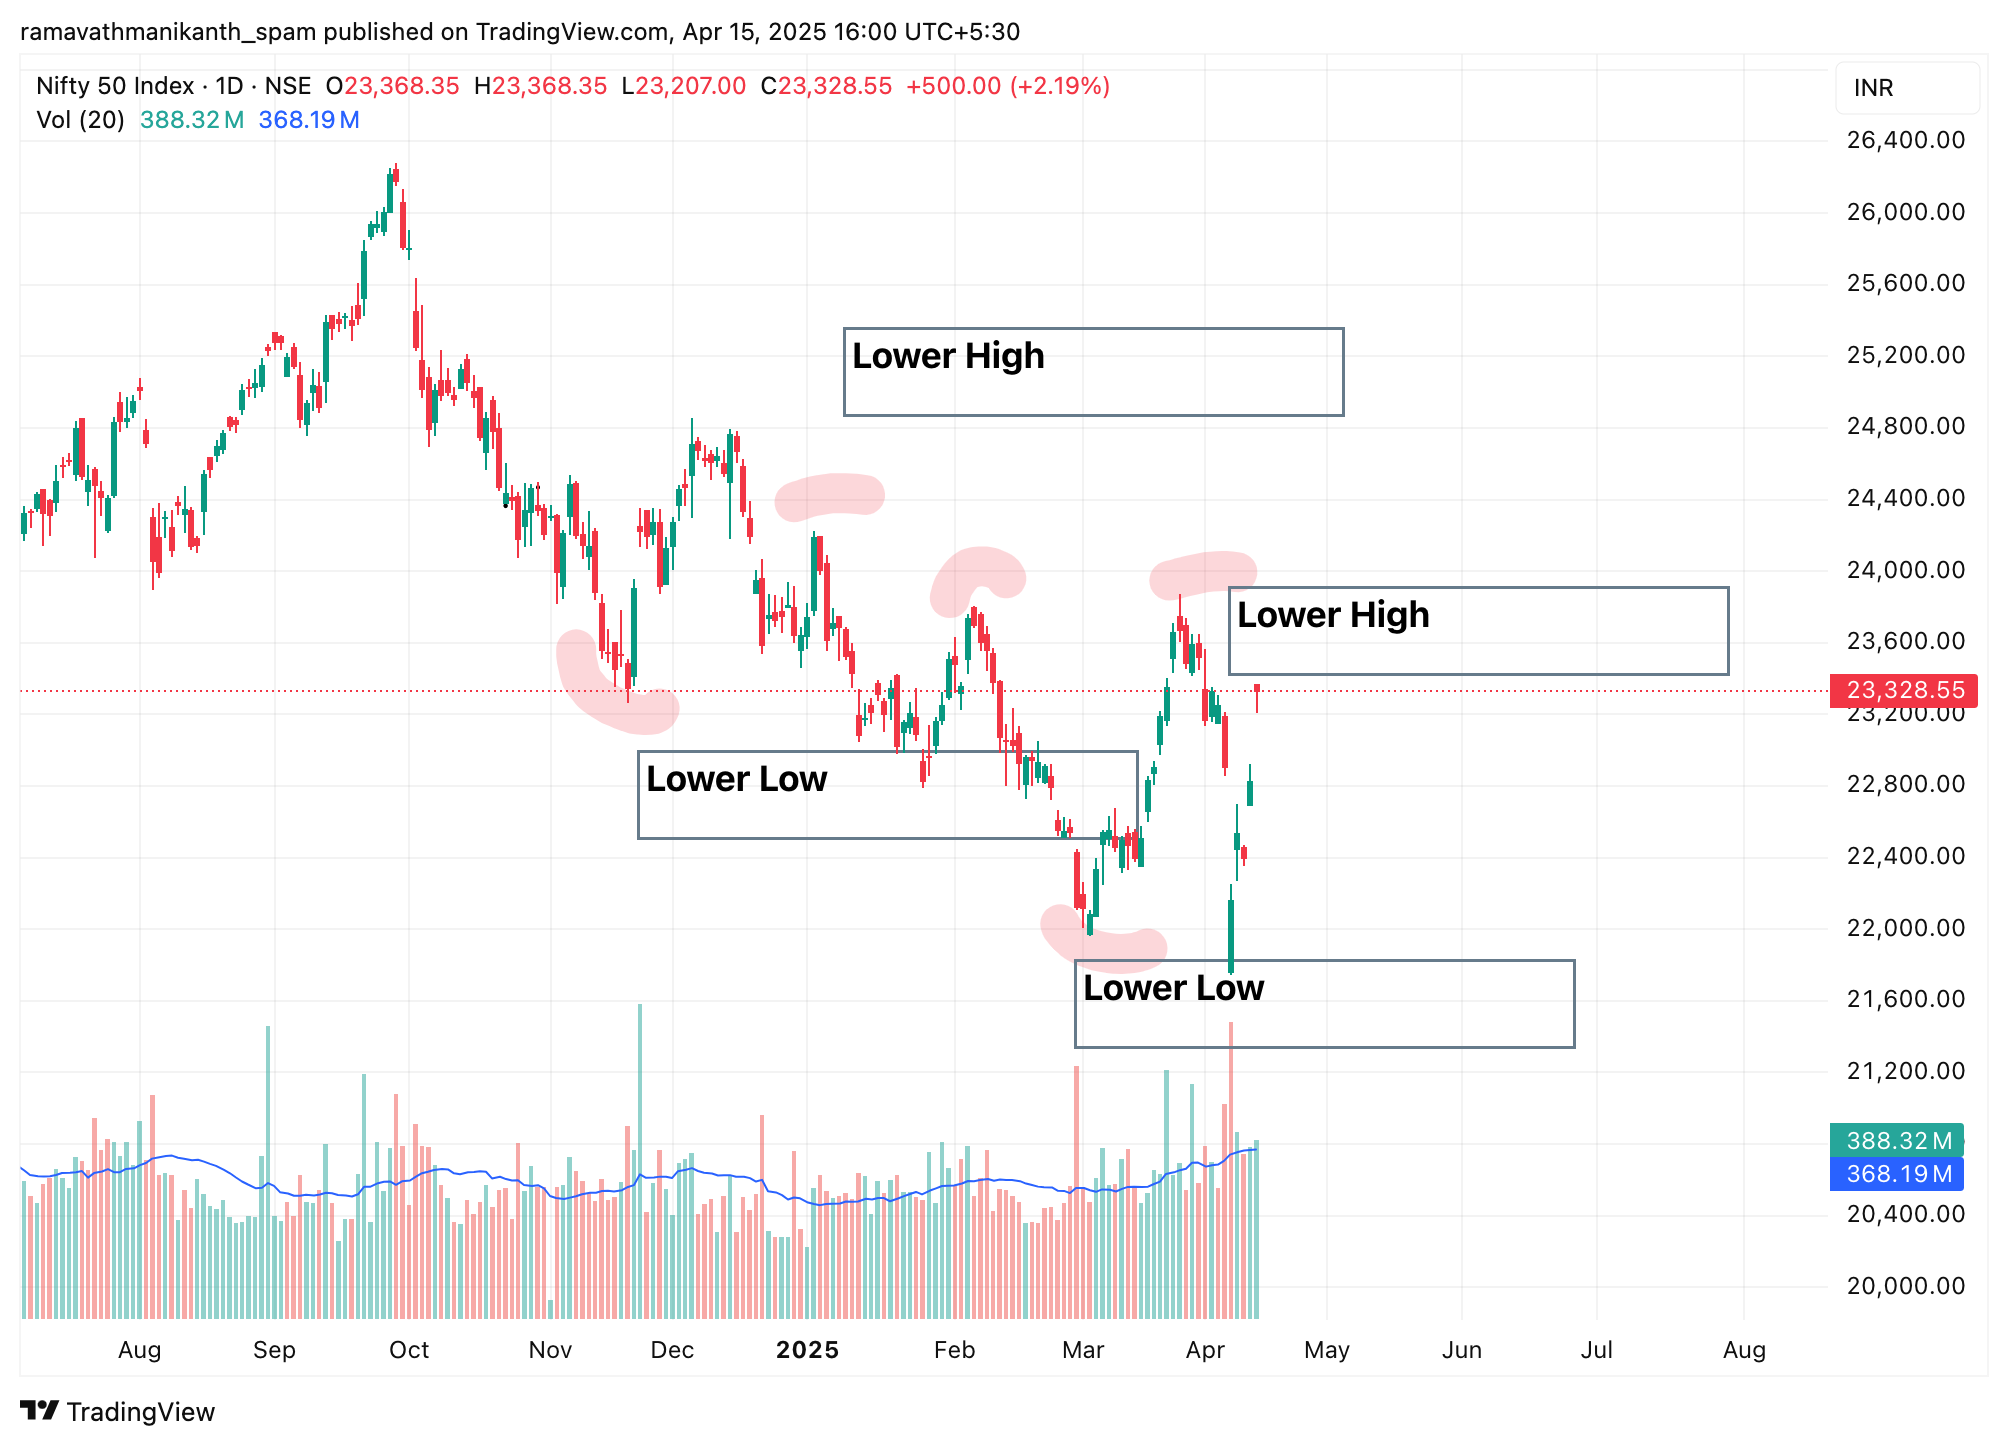
Downtrend:
Lower highs and lower lows mark a downtrend. It indicates selling pressure and a bearish outlook in the market.
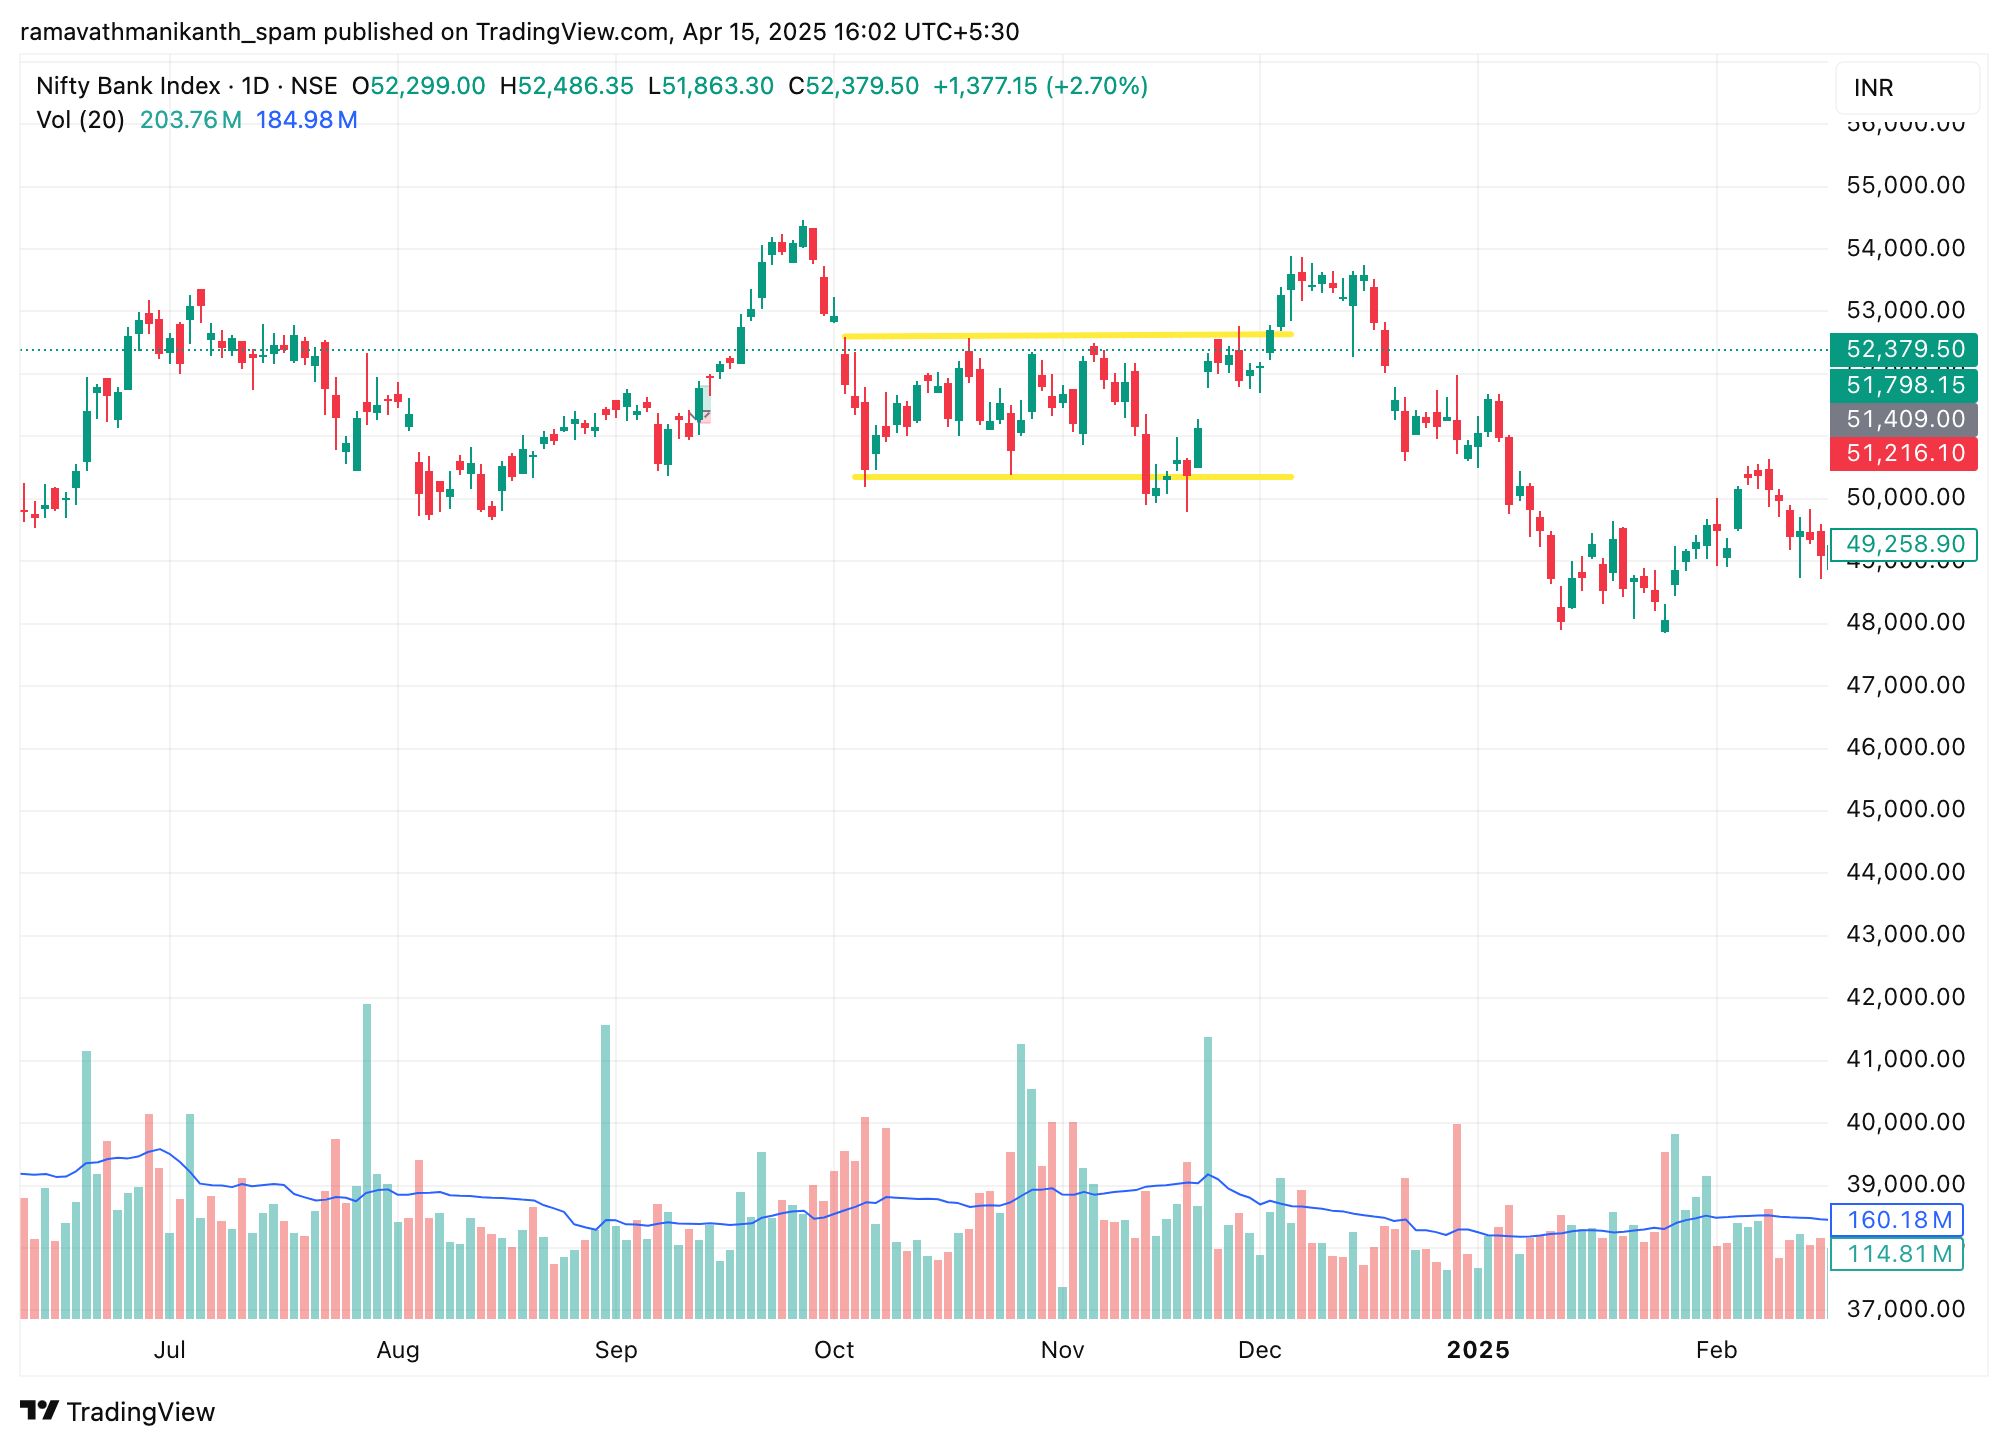
Sideways/Range-bound:
In a sideways trend, the price moves within a horizontal range without a clear direction. It reflects market indecision, where neither buyers nor sellers are in control.
Why does Trend Analysis Matter in the Stock Market?
With a clear understanding of different trend types, the next step is to recognise why trend analysis plays such a vital role in stock market decision-making.
Helps traders align with market momentum
Trend analysis allows traders to move with the market rather than against it. By identifying whether the market is in an uptrend, downtrend, or range, traders can align their strategies accordingly, buying in bullish phases and selling or shorting in bearish ones.
Reduces emotional decision-making
One of the biggest challenges in trading is managing emotions like fear and greed. Trend analysis provides an objective view of the market, helping traders stick to a plan based on data instead of reacting impulsively to price fluctuations.
Supports entry/exit timing
Knowing the current trend helps traders spot ideal points to enter or exit a position. For example, entering during a pullback in an uptrend or exiting before a trend reversal can greatly improve trade performance and risk management.
Crucial for technical trading strategies
Technical trading methods such as breakout trading, moving average strategies, or support-resistance setups depend heavily on trend direction. Without understanding the trend, applying these strategies can lead to poor results or false signals.
Tools & Techniques for Trend Analysis
In trend analysis, there are some specific tools, like technical indicators, that help in identifying different types of trends; here are some of them:
Technical Indicators
Technical indicators help decode market trends and momentum. Moving averages smooth out price noise to show direction. MACD tracks momentum shifts using two EMAs. RSI shows if a stock is overbought or oversold. Bollinger Bands highlight price volatility by expanding or contracting around the stock. Together, they offer quick signals for smarter trading.
Chart Patterns
These patterns tell stories of crowd psychology. A head-and-shoulders pattern, for example, signals a possible reversal after a strong trend. Flags and channels often point to continuation, like a short break before the trend resumes. Recognising them is like understanding the mood swings of the market.
Trendlines
Support lines show where a stock tends to stop falling, while resistance shows where it struggles to go higher. Drawing them helps visualise price barriers. If a stock breaks these lines, it might indicate a new trend beginning. It’s like marking checkpoints on a price journey.
Volume Analysis
Volume tells you how serious a move is. If a stock rises with high volume, the trend is more likely to be real. If volume is low, the move might be weak or short-lived. It’s the difference between a few whispers and a full-blown crowd shouting.
Limitations of Trend Analysis
- Lagging Nature: Most tools react after the price has moved, so signals often come with a delay.
- False Signals: In sideways or volatile markets, indicators can mislead and trigger wrong entries or exits.
- Ignores News & Events: Trend analysis doesn’t factor in sudden events like policy changes, earnings announcements, or global news, which can instantly shift market direction.
Conclusion
Trend analysis helps traders understand which direction the market is moving—up, down, or sideways. It gives a clear picture of price patterns and helps in making better decisions. By studying trends, traders can plan when to buy or sell with more confidence. It also reduces emotional decisions by focusing on data. While it’s a helpful tool, it’s not perfect and should be used carefully with other information. Trend analysis does not predict the future exactly, but it gives useful clues about what might happen next. Learning how to read trends is an important skill for every stock market trader.
Frequently Asked Questions (FAQs)
What are the 4 types of trends?
There are four main types of trends in the stock market:
Uptrend – When prices keep moving higher over time.
Downtrend – When prices keep falling.
Sideways Trend – When prices move within a range without a clear up or down direction.
Parabolic Trend – A steep rise or fall in prices, often unsustainable and risky.
What is the meaning of trend ratio analysis?
Trend ratio analysis is a method used in financial analysis to see how a company’s performance changes over time. It compares key financial figures (like revenue or profit) across multiple periods to spot patterns, whether things are improving, declining, or staying the same.
How do you identify a trend in the stock market?
A trend can be identified by analysing price movements on charts. An uptrend shows higher highs and higher lows, while a downtrend shows lower highs and lower lows. Traders often use tools like trendlines and moving averages for confirmation.
Why is trend analysis important for investors?
Trend analysis helps investors understand the overall direction of the market. It allows them to make better entry and exit decisions, manage risk effectively, and align their strategies with prevailing market conditions.
What tools are used for trend analysis?
Common tools include moving averages, trendlines, support and resistance levels, and technical indicators like RSI and MACD. These tools help traders identify the strength and direction of a trend more accurately.
Disclaimer: This content is for educational purposes only and does not constitute financial or investment advice. Investments in securities or other financial instruments are subject to market risk, including partial or total loss of capital. Past performance is not indicative of future results. Always consider your financial situation carefully and consult a licensed financial advisor before making investment or trading decisions.
Engineered for the obsessed. Built for traders.

Purpose-built terminals.
Zero compromise.
Built for speed.
Plot No 1290, 2nd Floor, 17th Cross, 5th Main, Sector-7, HSR Layout, Bangalore 560102
Follow us on
Mintcap Brokers Private Limited
CIN – U66110KA2023PTC178706 | Registered Address: Plot No 1290, Second Floor, 17th Cross, 5th Main, Sector-7, HSR Layout, Bangalore 560102 | Tel: 080 – 49552310 | Email ID: compliance@capmint.com | SEBI registered Stock Broker: INZ000322732 | NSE Cash/F&O Member ID: 90430 | BSE Cash/F&O Member ID: 6903 | MCX Member ID: 57400 | NCDEX Member ID: 1312 | SEBI registered Depository Participant: IN-DP-806-2025 | CDSL DP ID: 12102300 | NSE Clearing Member code: M70108 | AMFI-Registered Mutual Fund Distributor: ARN-289109 (Valid upto 28-Feb-2027) | Category II Execution Only Platform : E6903
Details of Client Bank Account
Compliance Officer: Ms. Shridevi Vungarala | Email ID: compliance@capmint.com | Tel no. + 91 9035330126 | Grievance Redressal Officer (GRO) – Ms. Shikha Gupta | Email ID: Grievance@capmint.com | Tel no: 9035331595.
Procedure to file a complaint on SEBI SCORES: Register on SCORES portal. Mandatory details for filing complaints on SCORES: Name, PAN, Address, Mobile Number, E-mail ID. Benefits: Effective Communication, Speedy redressal of the grievances. You may refer the website https://scores.sebi.gov.in/ for more information. You may also download the SEBI Scores app to log a complaint Android: https://play.google.com > store > apps > sebiscores iOS: https://apps.apple.com > app > sebiscores
Disclaimer
Investment in the securities market are subject to market risks, read all the related documents carefully before investing. Brokerage will not exceed the SEBI prescribed limit.
Mutual fund investments are subject to market risks, read all scheme related documents carefully before investing. Mutual Funds are not exchange-traded products.
Attention Investor:
- Stock Brokers can accept securities as margin from clients only by way of pledge in the depository system w.e.f. September 1, 2020.
- Update your mobile number & email Id with your stock broker/depository participant and receive OTP directly from depository on your email id and/or mobile number to create pledge.
- Pay 20% as upfront margin of the transaction value to trade in cash market segment.
- Investors may please refer to the Exchange’s Frequently Asked Questions (FAQs) issued vide circular reference NSE/INSP/45191 dated July 31, 2020 and NSE/INSP/45534 dated August 31, 2020 and other guidelines issued from time to time in this regard.
- Check your Securities /MF/ Bonds in the consolidated account statement issued by NSDL/CDSL every month.