
Link copied!
Market Phases
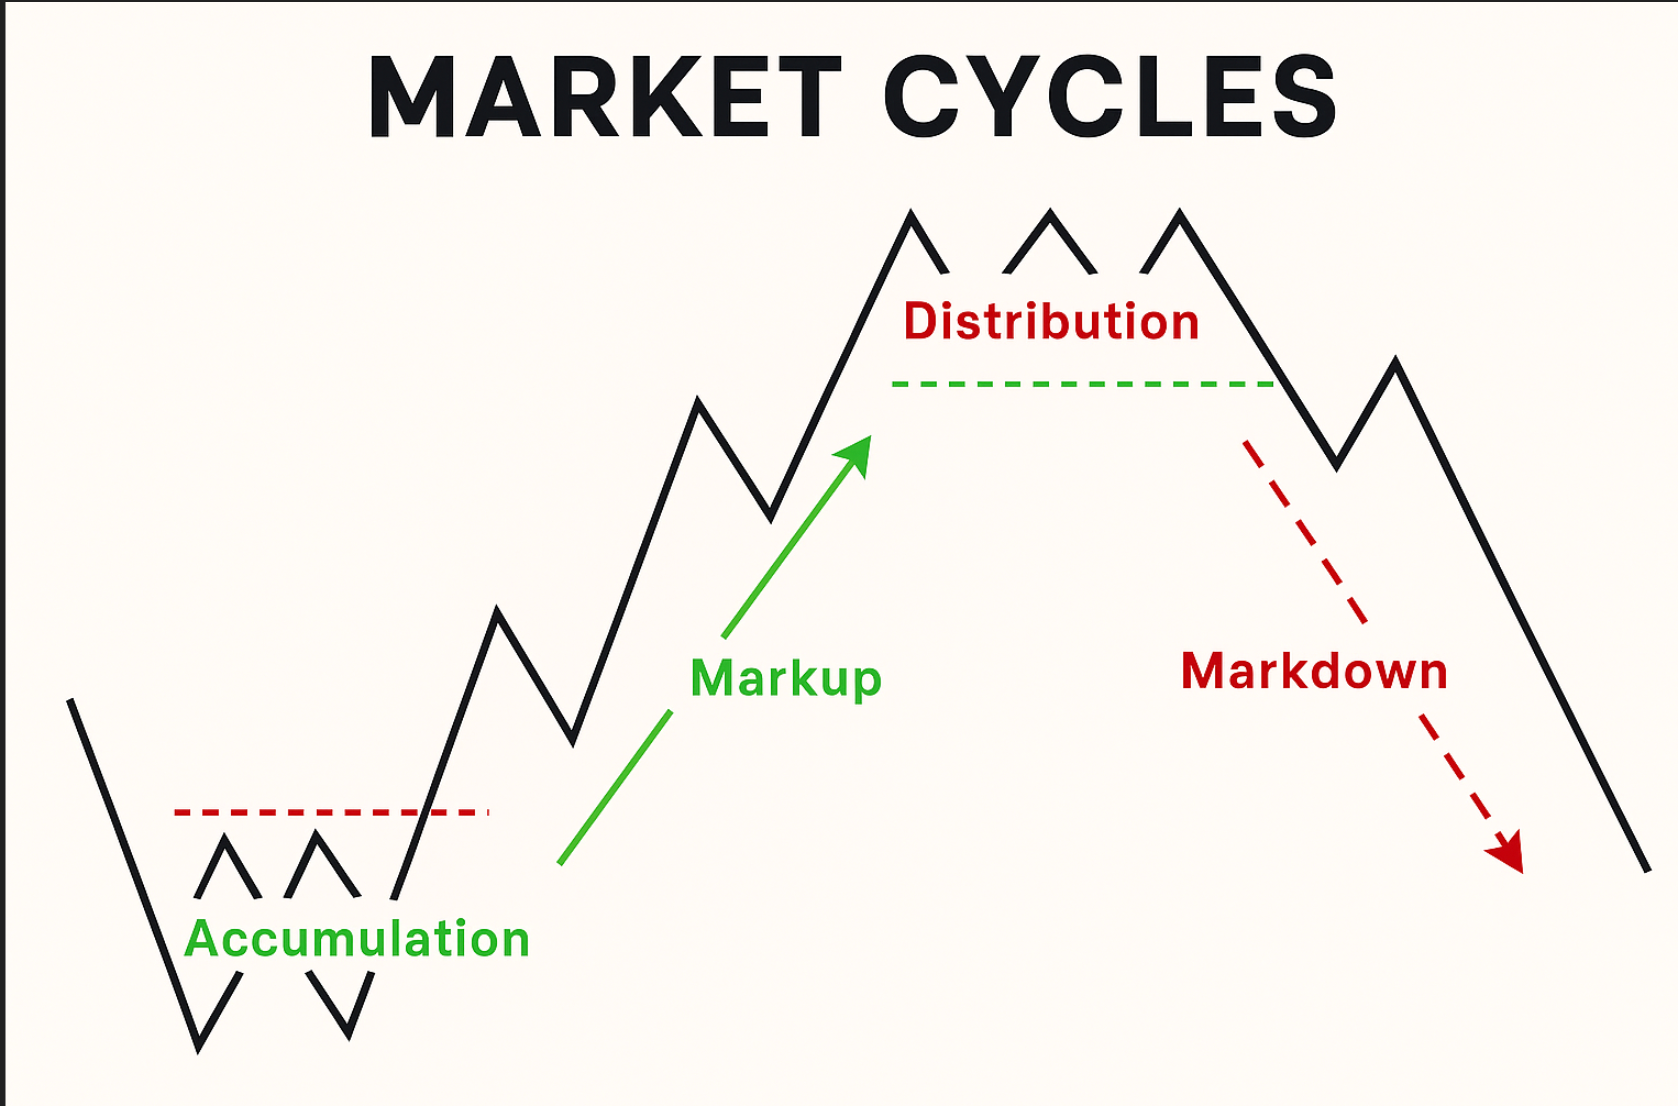
Market phases are recurring stages of price movement accumulation, markup, distribution, and markdown that reflect changing investor sentiment from pessimism to optimism and back.
Key Takeaways
- Market phases follow a predictable pattern: accumulation, markup, distribution, and markdown.
- Investor emotions like fear and greed play a major role in each phase.
- Technical indicators like moving averages, RSI, MACD, and volume help identify the current phase.
- Understanding where we are in the cycle helps investors make smarter, more timely decisions.
Understanding Market Phases
Market phases show how prices in the stock market move in a repeated pattern over time. It starts with accumulation, where smart investors buy when prices are low and most people are fearful. Then comes the markup phase, more people gain confidence, start buying, and prices rise quickly as optimism grows.
Next is the distribution phase, where experienced investors begin to sell because prices are high and the market feels too excited. Finally, the markdown phase begins, prices fall, fear returns, and many people sell in panic. After this, the cycle slowly resets, starting again with quiet accumulation. These phases are driven mostly by changing emotions like fear and greed.
Four Important Phases of a Market Cycle
Understanding market phases helps investors stay grounded and make better decisions through emotional highs and lows. Let’s break down the four phases with their timing, behaviour, traits, and smart strategies:
Accumulation Phase
The accumulation phase occurs right after a market crash or major correction, when fear dominates, and most investors have exited. During this time, the overall sentiment is still negative, but smart investors, often referred to as “smart money,” quietly begin buying undervalued stocks. Prices are low, trading volumes are subdued, and opportunities are often overlooked due to the emotional aftermath of the crash. This is the ideal time for value investing, where disciplined investors focus on buying fundamentally strong companies at a discount, setting the foundation for future gains as the market recovers.
Markup Phase
The markup phase begins when the economy starts to stabilise and signs of recovery become visible. Earnings improve, consumer confidence returns, and gradually, more investors re-enter the market. This steady influx of participants causes stock prices to rise consistently. Optimism builds, news flow turns positive, and participation broadens across sectors. This is a period where growth investing strategies work well, allowing investors to ride the trend and benefit from the overall upward momentum. Staying invested and sticking to your asset allocation becomes key as the market rewards early positioning.
Distribution Phase
The distribution phase typically happens near the peak of a market cycle. Prices have risen significantly, and the mood is euphoric; the media is filled with bullish headlines, and retail participation surges. However, under the surface, smart money begins to sell quietly, taking profits while the crowd still believes the rally will continue forever. This phase is marked by high volatility, conflicting signals, stretched valuations, and unpredictable price swings. The smart strategy here is to stay cautious, book some profits, reduce exposure to overvalued assets, and rebalance your portfolio to manage risk.
Decline (Markdown) Phase
The decline or markdown phase sets in as the market begins to turn downward, often triggered by weakening earnings, macroeconomic shocks, or shifts in investor sentiment. Fear spreads quickly, leading to panic selling and a rapid drop in stock prices. This is when pessimism dominates, the media turns negative, and recession fears grow. Many investors make the mistake of selling at the bottom or freezing altogether. Instead, a smart approach is to stay calm, avoid emotional decisions, and focus on long-term fundamentals. If you have liquidity, this phase can also be an opportunity to gradually accumulate quality assets again in preparation for the next cycle.
The Strategic Value of Market Cycles
While the structure of market cycles, accumulation, markup, distribution, and markdown is well documented, their real significance lies in how they shape investor behaviour and strategy. These phases are not merely technical observations but reflections of shifting sentiment across the investing public. Recognising the emotional undercurrents, fear during accumulation, euphoria in distribution, and panic in markdown can provide critical context for decision-making.
Rather than attempting to predict every market move, experienced investors use cycle awareness to align their asset allocation, entry timing, and risk exposure more effectively. When paired with technical tools like moving averages, RSI, or volume trends, market cycle analysis becomes a practical framework for navigating uncertainty and maintaining discipline across market conditions.
Technical Indicators Market Phases
Technical analysis offers valuable tools to determine which phase of the market cycle an asset or index may be in. The table below summarises how key technical indicators behave during each phase of the market cycle.
|
Technical Indicator |
Accumulation |
Markup |
Distribution |
Markdown |
|---|---|---|---|---|
|
Moving Averages (50-day & 200-day) |
Price flat or slightly rising below MAs |
Price breaks above 50 & 200-day MAs |
Price moves sideways above MAs, MAs flatten |
Price falls below MAs, death cross |
|
RSI (Relative Strength Index) |
RSI below 30 (oversold) |
RSI rising to 40–70 |
RSI above 70 (overbought) |
RSI dropping toward 30 |
|
MACD (Moving Average Convergence Divergence) |
MACD line turning upward, possible crossover |
Bullish crossover, histogram turns positive |
MACD flattens or shows bearish divergence |
Bearish crossover, histogram negative |
|
Volume Trends |
Low volume with stable price |
Rising volume with price |
High volume, choppy price action |
Volume spikes during sell-offs |
Conclusion
Understanding market phases is essential for making informed investment decisions and avoiding emotional mistakes. Each phase of accumulation, markup, distribution, and markdown reflects shifts in price trends and investor sentiment. By combining technical indicators like moving averages, RSI, MACD, and volume with a clear understanding of market psychology, investors can better identify opportunities and risks. Smart investors use these insights to buy low, ride the trend, exit cautiously, and stay calm during downturns. Recognising where the market stands in the cycle helps you stay grounded, build wealth consistently, and avoid chasing fads or panic selling in volatile times.
Frequently Asked Questions (FAQs)
How many market phases are there?
There are 4 main phases in a market cycle:
- Accumulation – smart investors buy after a crash
- Markup – prices rise, and more people invest
- Distribution – prices peak and experienced investors start selling
- Markdown – prices fall and panic spreads
What is the market cycle in India?
India also follows the same 4-phase cycle. For example, 2020 was a markdown phase, followed by a strong markup in 2021 and 2022. By late 2022, signs of distribution appeared, and in 2023–2024, the market showed early accumulation again. Factors like elections, RBI policies, and global trends influence this cycle.
What is the 17-year market cycle?
The 17-year market cycle is a long-term idea that markets go through a full, big up-and-down pattern roughly every 17 to 18 years. For example, the dot-com crash in 2000, the 2008 crisis, and the 2020 Covid crash are all spaced around 8–9 years apart, forming a full cycle.
How long is a cycle in the market?
A full market cycle usually lasts 5 to 10 years. Sometimes, it can be as short as 2–3 years during fast-moving events like pandemics. Other times, it stretches over 10 years if the economy grows steadily.
Disclaimer: This content is for educational purposes only and does not constitute financial or investment advice. Investments in securities or other financial instruments are subject to market risk, including partial or total loss of capital. Past performance is not indicative of future results. Always consider your financial situation carefully and consult a licensed financial advisor before making investment or trading decisions.
Engineered for the obsessed. Built for traders.

Purpose-built terminals.
Zero compromise.
Built for speed.
Plot No 1290, 2nd Floor, 17th Cross, 5th Main, Sector-7, HSR Layout, Bangalore 560102
Follow us on
Mintcap Brokers Private Limited
CIN – U66110KA2023PTC178706 | Registered Address: Plot No 1290, Second Floor, 17th Cross, 5th Main, Sector-7, HSR Layout, Bangalore 560102 | Tel: 080 – 49552310 | Email ID: compliance@capmint.com | SEBI registered Stock Broker: INZ000322732 | NSE Cash/F&O Member ID: 90430 | BSE Cash/F&O Member ID: 6903 | MCX Member ID: 57400 | NCDEX Member ID: 1312 | SEBI registered Depository Participant: IN-DP-806-2025 | CDSL DP ID: 12102300 | NSE Clearing Member code: M70108 | AMFI-Registered Mutual Fund Distributor: ARN-289109 (Valid upto 28-Feb-2027) | Category II Execution Only Platform : E6903
Details of Client Bank Account
Compliance Officer: Ms. Shridevi Vungarala | Email ID: compliance@capmint.com | Tel no. + 91 9035330126 | Grievance Redressal Officer (GRO) – Ms. Shikha Gupta | Email ID: Grievance@capmint.com | Tel no: 9035331595.
Procedure to file a complaint on SEBI SCORES: Register on SCORES portal. Mandatory details for filing complaints on SCORES: Name, PAN, Address, Mobile Number, E-mail ID. Benefits: Effective Communication, Speedy redressal of the grievances. You may refer the website https://scores.sebi.gov.in/ for more information. You may also download the SEBI Scores app to log a complaint Android: https://play.google.com > store > apps > sebiscores iOS: https://apps.apple.com > app > sebiscores
Disclaimer
Investment in the securities market are subject to market risks, read all the related documents carefully before investing. Brokerage will not exceed the SEBI prescribed limit.
Mutual fund investments are subject to market risks, read all scheme related documents carefully before investing. Mutual Funds are not exchange-traded products.
Attention Investor:
- Stock Brokers can accept securities as margin from clients only by way of pledge in the depository system w.e.f. September 1, 2020.
- Update your mobile number & email Id with your stock broker/depository participant and receive OTP directly from depository on your email id and/or mobile number to create pledge.
- Pay 20% as upfront margin of the transaction value to trade in cash market segment.
- Investors may please refer to the Exchange’s Frequently Asked Questions (FAQs) issued vide circular reference NSE/INSP/45191 dated July 31, 2020 and NSE/INSP/45534 dated August 31, 2020 and other guidelines issued from time to time in this regard.
- Check your Securities /MF/ Bonds in the consolidated account statement issued by NSDL/CDSL every month.